Abstract
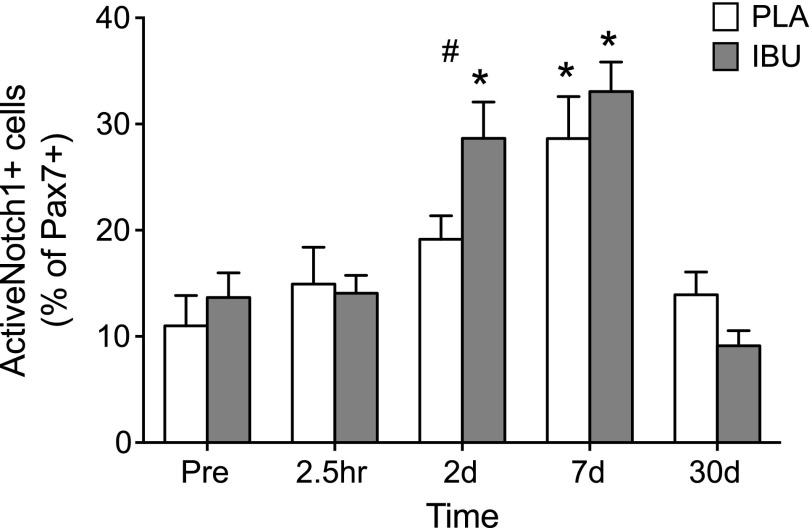
With this study we investigated the role of nonsteroidal anti-inflammatory drugs (NSAIDs) in human skeletal muscle regeneration. Young men ingested NSAID [1200 mg/d ibuprofen (IBU)] or placebo (PLA) daily for 2 wk before and 4 wk after an electrical stimulation–induced injury to the leg extensor muscles of one leg. Muscle biopsies were collected from the vastus lateralis muscles before and after stimulation (2.5 h and 2, 7, and 30 d) and were assessed for satellite cells and regeneration by immunohistochemistry and real-time RT-PCR, and we also measured telomere length. After injury, and compared with PLA, IBU was found to augment the proportion of ActiveNotch1+ satellite cells at 2 d [IBU, 29 ± 3% vs. PLA, 19 ± 2% (means ± sem)], satellite cell content at 7 d [IBU, 0.16 ± 0.01 vs. PLA, 0.12 ± 0.01 (Pax7+ cells/fiber)], and to expedite muscle repair at 30 d. The PLA group displayed a greater proportion of embryonic myosin+ fibers and a residual ∼2-fold increase in mRNA levels of matrix proteins (all P < 0.05). Endomysial collagen was also elevated with PLA at 30 d. Minimum telomere length shortening was not observed. In conclusion, ingestion of NSAID has a potentiating effect on Notch activation of satellite cells and muscle remodeling during large-scale regeneration of injured human skeletal muscle.—Mackey, A. L., Rasmussen, L. K., Kadi, F., Schjerling, P., Helmark, I. C., Ponsot, E., Aagaard, P., Durigan, J. L. Q., Kjaer, M. Activation of satellite cells and the regeneration of human skeletal muscle are expedited by ingestion of nonsteroidal anti-inflammatory medication.
Keywords: Pax7, electrical stimulation, telomere length, extracellular matrix, Notch signaling pathway
The requirement of satellite cells for skeletal muscle regeneration is absolute, as previously described (1). Recent evidence from satellite cell–depleted mice that were subjected to overload indicates that, whereas skeletal muscle hypertrophy is permitted in the absence of satellite cells in the short term (2), it is attenuated in the long term (3), which indicates that satellite cells are essential for continued hypertrophic adaptation to loading. Of interest, it has also been shown that satellite cell depletion in overloaded muscle leads to the accumulation of muscle extracellular matrix (ECM) and an increased number of fibroblasts (3). Given these critical roles for satellite cells in facilitating the adaptation of skeletal muscle myofibers and their adjacent ECM structures and fibroblast cells, factors that alter the response of satellite cells are likely to have important implications for the range of adaptive plasticity of muscle mass and function.
The potential of nonsteroidal anti-inflammatory drugs (NSAIDs) to influence skeletal muscle adaptation to exercise and injury has been extensively studied with divergent outcomes, as reviewed previously (4–6). In clinical practice, it would seem that the administration of NSAIDs in the early phase of injury is often advocated (7), for example, during the first 2–3 d after injury. However, general guidelines for physicians, at least in Denmark, conclude that there is a lack of consensus regarding a potential beneficial effect of NSAID use in the repair of acute muscle injury, which likely reflects a poor understanding of the role of cyclooxygenase/prostaglandin inflammatory pathways in muscle repair at the cellular and molecular levels. In addition, the importance of inflammation for muscle regeneration has been demonstrated in the form of pro- and anti-inflammatory macrophage cell activities that orchestrate satellite cell proliferation and the fusion of myoblasts into myotubes, respectively (8); however, we lack insight into what influence the blocking of inflammation has both on satellite cell activation and during the extended regeneration process in humans.
In humans, we have previously reported that exposure to NSAIDs, either through oral ingestion (9) or direct infusion into the working muscle (10), resulted in an apparent attenuation of the increase in satellite cell content observed in untreated muscle. In these models of voluntary muscle contraction, however, there was little myofiber damage and, therefore, only minor muscle regeneration. Furthermore, muscle regeneration, which is defined as events after myofiber necrosis to form new muscle (11), is known to be accompanied by substantial inflammatory cell activity (8) and by remodeling of the muscle ECM as well as the myofibers themselves in the early and late phases, respectively (12); thus, this process represents a situation different from physiologic exercise in which NSAIDs can act. In our previous study on the regeneration of human muscle (12), we observed the up-regulation of genes that encode for fibrillar collagens (types I and III), basement membrane proteins (laminin-β1 and -β2 and collagen type IV), matricellular proteins (tenascin-C and connective tissue growth factor) and collagen type XII, a member of the family of collagens known as fibril-associated collagens with interrupted triple helices. At 30 d postinjury, the persistent remodeling of ECM components by these different groups was associated with an improved resistance to reinjury, which highlights the potential of muscle ECM to act as a key orchestrator of muscle repair and as a protector against myocellular injury. Yet the potential of NSAIDs to influence muscle ECM remodeling is unknown. In the current study, we chose to focus on these same groups of matrix proteins and also to include decorin, which has been shown to play a role in modulating fibrosis (13) as well as in activating satellite cells (14).
Many factors have been recognized as regulators of satellite cell activity at the molecular level, and the Notch signaling pathway, in particular, has been identified as a prominent and pivotal pathway for the determination of satellite cell fate (15, 16). Indeed, loss of Notch signaling, specifically in the satellite cells of adult mice, has been shown to lead to rapid myogenic differentiation at the expense of renewing the satellite cell pool (17, 18). For human skeletal muscle, however, there is a lack of studies on Notch signaling in the early and late phases of regeneration, during which the determination of satellite cell fate is critical to the success of muscle repair and satellite cell pool replenishment. Given these important roles, and because the mechanism by which the previously observed inhibitory effects of NSAID exposure on satellite cell proliferation is completely unknown, we set out to investigate the possibility that Notch signaling is modified by NSAID ingestion.
The aim of this study was to investigate the potential of NSAID ingestion to alter satellite cell response and the time course of regeneration in the experimentally injured skeletal muscle of young healthy men. We employed neuromuscular electrical stimulation (ES) to evoke lengthening (eccentric) muscle contractions, which have been shown to be more effective than voluntary contractions to induce muscle cytoskeletal damage (12, 19). On the basis of previous reports, we hypothesized that NSAID ingestion would have a negative effect on muscle regeneration, which would be characterized by a diminished early satellite cell response and a delayed time course of muscle regeneration and ECM remodeling, accompanied by a delayed recovery of muscle function. We also sought to investigate the impact of supraphysiologic stimulus delivered by the electrically evoked lengthening contractions on the regenerative capacity of muscle by analyzing minimum telomere length, which we hypothesized would reflect the influence of NSAID ingestion on satellite cell response.
MATERIALS AND METHODS
Subjects and experimental design
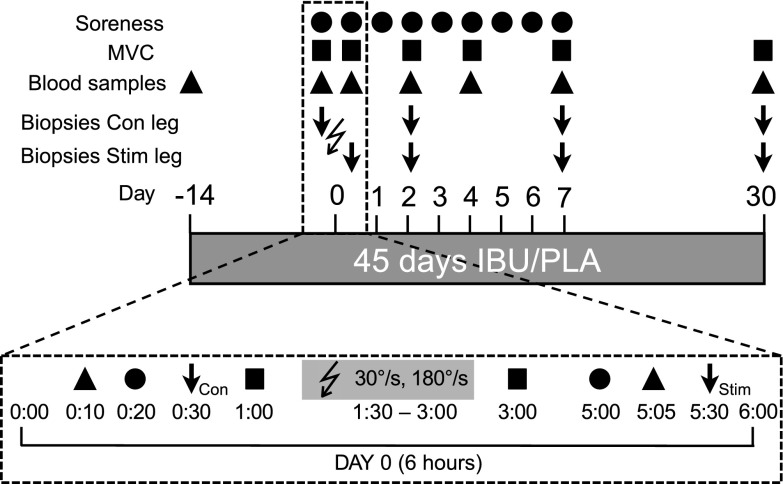
The Regional Scientific Ethical Committees of Copenhagen approved this study (Ref: HD-2008-074), and all procedures conformed to the Declaration of Helsinki. This study is registered on ClinicalTrials.gov with the identifier NCT00832663. We recruited 32 young men from the greater Copenhagen area. As well as being healthy, we included participants that were age ≥ 18 and ≤ 35 yr. Exclusion criteria included regular smoking, regular resistance training in the previous 2 y, regular participation in exercise (except for cycling as a means of transport), stomach ulcers, and previous biopsy sampling from either vastus lateralis muscle. After participants gave written informed consent, a screening blood sample was taken and analyzed for signs of kidney or liver dysfunction, which were also exclusion criteria. Study participants were assigned to either a placebo (PLA) or ibuprofen (IBU) group by an investigator not involved in the inclusion process, who ensured that groups were similar with regard to mean age, height, and weight throughout the accrual period. (See Table 1 for an overview of subject characteristics.) Inclusion of participants from both groups was similarly distributed throughout the study period (April–December 2009). Participants were asked to remain sedentary for the duration of the study, using public transport or a car instead of a bicycle as a means of transport. An overview of the study design is presented in Fig. 1. Biopsies from a subset of participants were analyzed for inflammatory cell activity, published elsewhere (8).
TABLE 1.
Participant characteristics
| Characteristic | IBU | PLA |
|---|---|---|
| Completed (n) | 15 | 14 |
| Age (yr) | 21 ± 3 | 21 ± 3 |
| Height (m) | 1.8 ± 0.1 | 1.8 ± 0.1 |
| Weight (kg) | 73 ± 8 | 72 ± 7 |
| Fiber type (% type I) | 48 ± 13 | 46 ± 11 |
Data are given as means ± sd. Fiber type was determined from the biopsy collected from the control leg on d 0.
Figure 1.
Study design. Overview of the study design indicating the timing of blood sampling, muscle biopsies, and measurements of muscle soreness and MVC during the 45-d period of IBU or PLA ingestion in young healthy male volunteers. The bottom timeline displays in more detail the timing and order of events during the 6-h protocol for d 0 when ES was performed. On this day, 100 slow (30°/s) and 100 fast (180°/s) lengthening contractions were induced by ES to the vastus lateralis muscle of one leg. Four biopsies were collected from the stimulated (stim) leg and 4 from the unstimulated leg as a control (con). The order of events on the postinjury d was as follows: blood sampling, biopsies, and MVC. The lightning bolt symbol indicates ES.
IBU and PLA administration
Participants received, in a double-blinded manner, IBU 2 × 600 mg IBU/d (Ibumetin; Nycomed Danmark Aps, Hobro, Denmark) or PLA 2 tablets/d, beginning 14 d before ES and ending after the final biopsy was collected 30 d after ES (45 d total). PLA tablets were comprised of potato starch, gelatin, and lactose monohydrate, and were identical in appearance to IBU.
ES protocol
The ES protocol used in this study was adapted from Crameri et al. (19). Participants were seated upright in an isokinetic dynamometer (Kinetic Communicator; Chattecx, Chattanooga, TN, USA). Range of motion during the isokinetic measurement was set from 90 to 10° (0°, fully extended leg). Two stimulation electrodes were placed across the vastus lateralis muscle of the randomly assigned leg ∼5 cm from the top of the patella and ∼5 cm from the anterior superior iliac spine. ES was performed by using a constant–bicurrent stimulator (ELPHA II 3000; Biofina, Odense, Denmark) with continuous impulse trains (300 μs single-pulse duration; 35 Hz; maximal current, 100 mA). The participant controlled the stimulator device and was regularly encouraged to increase the current to the highest tolerable level. ES consisted of a total of 200 eccentric contractions: 5 sets of 20 contractions at 30 and 180°/s each, with a 30 s break between each set and a 5 min break between the slow and fast contractions. All muscle contractions were ES-induced without any voluntary contribution, as this protocol has been shown to elicit substantially greater amounts of cytoskeletal damage compared with maximal voluntary contractions (19). Muscle moment–joint angle curves were recorded for each contraction and expressed relative to body weight (kg) to measure the total contractile work produced by the knee extensors during ES. Total work was calculated as the sum of the integrated area measured for each moment–joint angle curve performed, with joint angles expressed in radians (19).
Blood samples
Approximately 40 ml of blood was collected from the antecubital vein at screening and on d −14 and 0 pre-ES as well as post-ES at +2 h and on d 2, 4, 7, and 30 (Fig. 1). Plasma creatine kinase (CK) and lactate dehydrogenase (LDH) levels were measured at the Department of Clinical Biochemistry, Bispebjerg Hospital, and plasma myoglobin (Mb) levels were measured at the Department of Clinical Biochemistry at Frederiksberg Hospital, Copenhagen, as previously described (20). Circulating levels of IBU were determined by HPLC at the Department of Clinical Biochemistry and Pharmacology, Odense University Hospital, at all time points for all participants. No IBU was detected in any samples from the PLA group. IBU was detected in all samples from the IBU group, except from one time point (d 4) for one participant.
An additional sample of blood was collected in CPT Vacutainer tubes (362781; BD, San Jose, CA, USA) to measure telomere length on isolated leukocytes. Immediately after blood collection, leukocytes were isolated and frozen according to the manufacturer instructions.
Muscle biopsies
Along both vastus lateralis muscles, 4 biopsies were taken within a distance of 12 cm, ensuring ≥ 3 cm between incision sites to minimize the repeated biopsy effect. Furthermore, participants were stratified into 3 patterns of biopsy sites on the thigh. On the day of ES (d 0), a muscle biopsy was taken in the control leg before ES and in the stimulated leg 2.5 h after completion of ES. Biopsies were subsequently taken from both legs on d 2, 7, and 30 after ES. Muscle biopsies were collected under local anesthetic (1% lidocaine; Amgros I/S, Copenhagen, Denmark), by using the Bergström percutaneous needle biopsy technique with 5–6 mm biopsy needles and manual suction. On removal, parts of the specimen suited for histology were aligned in parallel, embedded in Tissue-Tek (Sakura Finetek Europe, Zoeterwoude, The Netherlands), and frozen in isopentane, precooled by liquid nitrogen, and stored at −80°C until analysis. Parts not suited to histology were snap frozen in liquid nitrogen for mRNA and telomere length analyses. Embedded samples were sectioned (10 µm) at −20°C by using a cryostat and stored at −80°C. All biopsy section analyses were performed blinded to the treatment groups.
Muscle soreness
Muscle soreness was assessed pre- and postexercise (+2 h) and every day for 7 d by using a visual analog scale, which ranged from 0 (normal, no pain) to 10 (extremely painful). Participants were instructed to assess soreness first thing in the morning in 3 ways: by self-palpation of the belly of the vastus lateralis muscle with 3 fingers, starting distally and moving toward the knee; passive quadriceps stretch when standing; and active muscle lengthening contraction (sitting down slowly onto a chair over 5-s period). Muscle soreness was also assessed by visual analog scale during the last contraction of each part of the ES protocol (30 and 180°/s).
Strength measurements
Maximum voluntary isometric contractions (MVCs) were performed unilaterally by the knee extensors of both legs at two knee joint angles (50 and 70°) and measured using the Good Strength device (Metitur Oy, Jyväskylä, Finland). Three MVCs lasting 3–5 s each were performed for each leg at each angle, with 30 s rest between contractions. The highest value of the 3 MVCs was selected. The order of the 4 tests (left/right 70° and left/right 50°) was stratified. MVC testing was performed before ES (Pre), and subsequent tests were performed immediately after ES and on recovery d 2, 4, 7, and 30. Contractile rate of force development (RFD) was determined from MVC data, derived as the average slope of the moment–time curve in time intervals of 0–50 and 0–100 ms relative to the onset of contraction (21). To evaluate potential differential changes in RFD vs. MVC, relative RFD was obtained as the slope of the moment–time curve normalized relative to peak isometric torque (MVC) calculated in the time interval from onset of contraction to 50 and 67% MVC, respectively.
Analysis of muscle degeneration and regeneration
Hematoxylin and eosin
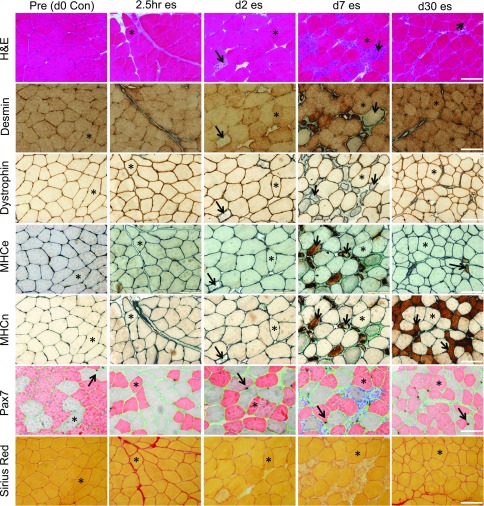
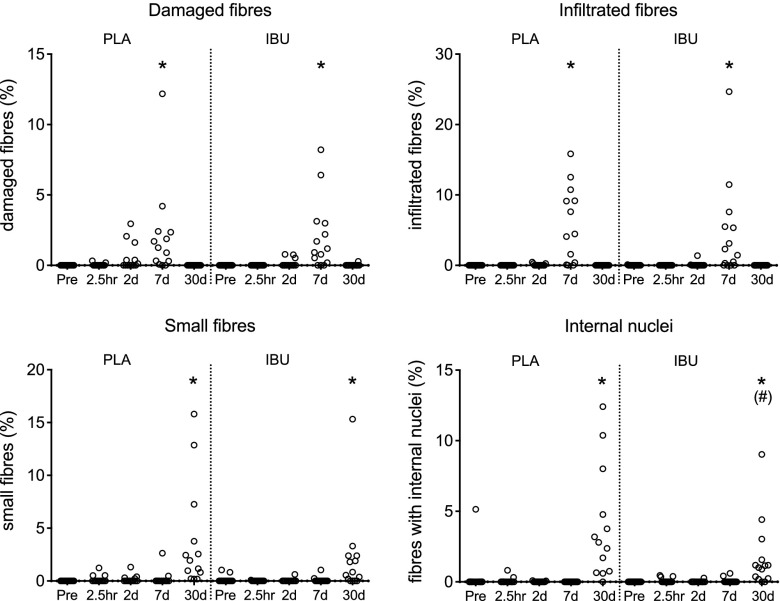
One section from each biopsy (control and stimulated leg) was stained with hematoxylin and eosin (H&E), from which we quantified damaged muscle fibers (fibers showing loss of normal polygonal outline, hyaline aspect, and/or disruption of the sarcolemma), fibers infiltrated by mononuclear cells, fibers with internal nuclei, and small muscle fibers. These values were expressed as a percentage of the number of muscle fibers in the specimen. See Fig. 2 for examples of staining.
Figure 2.
Microscope images of histologic analyses. To provide insight into the extent of myofiber damage, these images depict sections cut from Pre biopsies before a single bout of es and from postinjury at 2.5 h, and on d 2, 7, and 30. All sections are from the same participant and, in most cases, for each time point, the same fibers (indicated with asterisks) can be identified in the 7 different stains used to evaluate damage (H&E and desmin-negative or dystrophin-negative fibers) and regeneration [embryonic (MHCe) or neonatal (MHCn) myosin-positive fibers] as well as the muscle content of satellite cells (Pax7) and collagen (Sirius Red). Examples of affected fibers, as described in Materials and Methods, are indicated with arrows. Pax7 cells are visible as black cells (arrows), associated with type I (red) or type II (gray) fibers. Laminin (green) was used to indicate the fiber borders. Scale bars, 100 μm.
Damage and regeneration immunohistochemistry
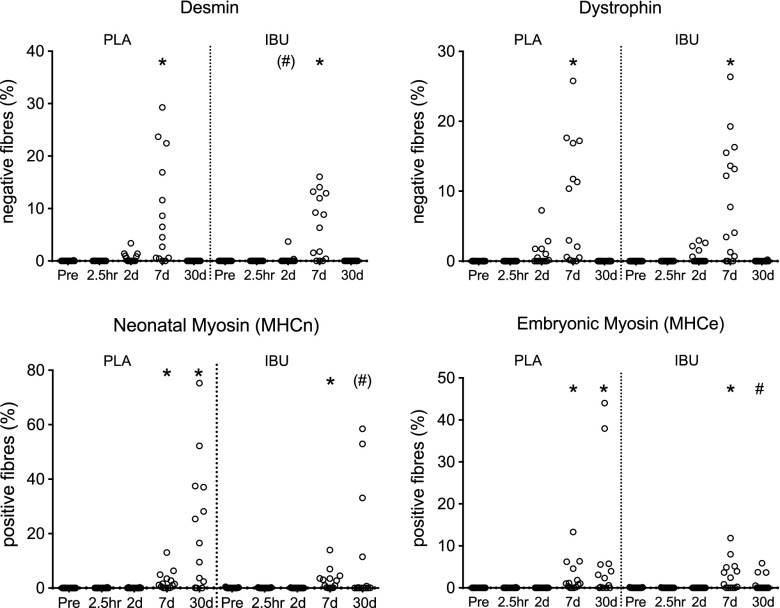
Sections from each biopsy (control and stimulated leg) underwent immunohistochemistry (IHC) staining to assess muscle fiber damage (the proportion of fibers that lacked desmin and dystrophin immunoreactivity) and muscle fiber regeneration [the proportion of fibers that demonstrated immunoreactivity for neonatal myosin (MHCn) and embryonic myosin (MHCe)]. The same general protocol was followed for all 4 stainings, although only the sections stained for desmin were fixed in 5% formaldehyde solution. Cold acetone was used to fix the sections for the dystrophin staining, whereas staining for MHCn and MHCe required unfixed sections. All protocols involved the quenching of endogenous peroxidase activity with 0.3% hydrogen peroxidase and blocking with 1% bovine serum albumin. A rabbit anti-laminin antibody (Dako Denmark A/S, Glostrup, Denmark) was mixed with one of the following antibodies and incubated overnight with the sections at refrigerator temperature: 1) mouse anti-desmin (18-0016; Zymed, San Francisco, CA, USA); 2) mouse anti-dystrophin (NCL-DYS2; Novocastra; Leica Microsystems A/S, Ballerup, Denmark); 3) mouse anti-MHCn (NCL-MHCn; Novocastra); or 4) mouse anti-MHCe (F1.652; Developmental Studies Hybridoma Bank, Iowa City, IA, USA). ImmPress anti-mouse (MP-7402; Vector Laboratories, Peterborough, United Kingdom) followed by 3,3′-diaminobenzidine allowed the visualization of binding sites of the mouse antibody, whereas ImmPress anti-rabbit (Vector Laboratories) followed by Vector SG (Vector Laboratories) stained laminin. Methyl green was used to stain nuclei, and sections were dehydrated in graded alcohols, cleared in xylene, and mounted in Pertex (Histolab, Gothenburg, Sweden).
Satellite cell IHC
Staining for satellite cells (Pax7), laminin, and type I fibers
IHC was performed by using a combination of indirect enzymatic labeling and fluorescent staining, as previously described (22), with the addition of a step to quench endogenous peroxidase activity by using 0.3% hydrogen peroxidase. In brief, satellite cells were labeled with a mouse anti-Pax7 antibody (MO15020; Neuromics, Edina, MN, USA), Vectastain Elite ABC kit (PK6102; Vector Laboratories), and 3,3′-diaminobenzidine substrate (SK-4105; Vector Laboratories). Sections were then incubated with mouse anti-myosin type I (A4.951; Developmental Studies Hybridoma Bank) and rabbit anti-laminin (Z0098; Dako) antibodies, followed by Alexa Fluor 488 goat anti-rabbit (A11034; Invitrogen A/S, Taastrup, Denmark) and Alexa Fluor 568 goat anti-mouse secondary antibodies (Molecular Probes, A11031; Invitrogen). DAPI in the mounting medium (Molecular Probes ProLong Gold anti-fade reagent, P36935; Invitrogen) stained the nuclei, rendering visible by fluorescence microscopy red type I myosin, green laminin, and blue nuclei. Sites of Pax7 antigenicity were stained brown and were visible by light microscopy.
Satellite cell enumeration
All Pax7 cells were identified and, with the aid of laminin staining to identify the adjacent fiber border, their association with type I (A4.951+) or type II (A4.951−) fibers was determined, as described (22). Obtained values were expressed relative to the total number of types I or II fibers included in the assessment. All slides were blinded to treatment group, participant identity, leg, and time point. One cross section from each biopsy was evaluated and, excluding all fibers not cut cross-sectionally, all fibers were included. See Table 2 for the number of fibers per cross section included in the analysis and Fig. 2 for examples of staining.
TABLE 2.
Number of fibers for satellite cell analysis
| Day | IBU control | IBU stimulated | PLA control | PLA stimulated |
|---|---|---|---|---|
| 0 | 1601 ± 726 | 1441 ± 588 | 1113 ± 458 | 1422 ± 634 |
| 2 | 1368 ± 601 | 1098 ± 382 | 1313 ± 499 | 1217 ± 571 |
| 7 | 1377 ± 499 | 1270 ± 505 | 1410 ± 872 | 1307 ± 660 |
| 30 | 1057 ± 657 | 1451 ± 770 | 1400 ± 669 | 1426 ± 512 |
The total number of fibers included in satellite cell enumeration of muscle biopsy cross sections (means ± sd) from the control and stimulated legs of individuals who received either IBU or PLA.
Proliferating satellite cells
After fixation in 5% formaldehyde, mouse anti-Pax7 (MO15020; Neuromics) and Ki-67 (CP249; Biocare Medical, Concord, CA, USA) antibodies were applied to the sections together and incubated overnight, followed by Alexa Fluor 488 goat anti-rabbit and Alexa Fluor 568 goat anti-mouse secondary antibodies (Molecular Probes, A11034, A11031; Invitrogen) and DAPI. All Pax7+ cells were identified, and whether they were positive or negative for Ki-67 was recorded. See Supplemental Fig. 1 for an example of staining. The number of proliferating satellite cells (Ki-67+ Pax7+) was expressed as a percentage of the total number of identified Pax7 cells. All time points from the control and stimulated leg were analyzed and blinded to treatment group, participant identity, leg, and time point.
ActiveNotch1+ satellite cells
We identified ActiveNotch1+ satellite cells by using sections stained with the same protocol as for the Ki-67 antibody above, substituting the Ki-67 antibody with an antibody against released (active) Notch1 intracellular domain (ab8925; Abcam, Cambridge, United Kingdom). This antibody has been used in previous IHC analysis of active Notch signaling (23, 24). All Pax7+ cells were identified, and whether they were positive or negative for ActiveNotch1 was recorded. See Supplemental Fig. 2 for examples of staining. We analyzed the Pre biopsy from the control leg and all time points from the stimulated leg, blinded to treatment group, subject identity, leg, and time point.
RNA extraction
Of muscle tissue, 10–20 mg was homogenized in 1 ml TriReagent (Molecular Research Center, Cincinnati, OH, USA) that contained 5 stainless steel balls 2.3 mm in diameter (BioSpec Products, Inc., Bartlesville, OK, USA) and one 1-mm silicon carbide sharp particle (BioSpec Products, Inc.) by shaking in a FastPrep-24 instrument (MP Biomedicals, Inc., Illkirch, France) at speed level 4 for 15 s. To obtain complete homogenization of tissue, the shaking process was repeated 3 times with cooling on ice between each shaking to avoid heating of the sample. After homogenization, bromochloropropane was added to separate the samples into an aqueous and an organic phase. After isolation of the aqueous phase, RNA was precipitated with isopropanol. The RNA pellet was then washed in ethanol and subsequently dissolved in 20 μl RNase-free water. Total RNA concentrations and purity were determined by spectroscopy at 260, 280, and 240 nm. Good RNA integrity was ensured by gel electrophoresis.
Real-time RT-PCR
Of total RNA, 500 ng was converted into cDNA in 20 μl by using OmniScript RT (Qiagen, Valencia, CA, USA) and 1 μM poly-dT (Invitrogen) according to the manufacturer protocol. For each target mRNA, 0.25 μl cDNA was amplified in a 25 μl SYBR Green PCR that contained 1× Quantitect SYBR Green Master Mix (Qiagen) and 100 nM of each primer (Table 3). Amplification was monitored in real time by using the MX3005P real-time PCR machine (Stratagene, San Diego, CA, USA). Ct values were related to a standard curve made with known concentrations of cloned PCR products or DNA oligonucleotides (UltramerTM oligos; Integrated DNA Technologies, Inc., Leuven, Belgium) with a DNA sequence that corresponded with the sequence of the expected PCR product. The specificity of the PCR products was confirmed by melting curve analysis after amplification. RPLP0 mRNA was chosen as an internal control, and the data for the stimulated leg were expressed relative to the biopsy taken at the same time point from the control leg. Data for the control leg (Supplemental Fig. 3) are expressed relative to the Pre biopsy.
TABLE 3.
Primers for real-time RT-PCR
| mRNA | GenBank | Sense | Antisense |
|---|---|---|---|
| RPLP0 | NM_053275.3 | GGAAACTCTGCATTCTCGCTTCCT | CCAGGACTCGTTTGTACCCGTTG |
| GAPDH | NM_002046.4 | CCTCCTGCACCACCAACTGCTT | GAGGGGCCATCCACAGTCTTCT |
| CD68 | NM_001251.2 | CAGCTTTGGATTCATGCAGGACC | CTCTGCCCCAGGGGTGCTTG |
| IGF-1Ea | NM_000618.3 | GACATGCCCAAGACCCAGAAGGA | CGGTGGCATGTCACTCTTCACTC |
| IGF-1Ec | NM_001111283.1 | GCCCCCATCTACCAACAAGAACAC | CGGTGGCATGTCACTCTTCACTC |
| CCL2 | NM_002982.3 | GCCCTTCTGTGCCTGCTGCT | GCAGGTGACTGGGGCATTGATT |
| αβ-Crystallin | NM_001885.2 | GTGTTGGGAGATGTGATTGAGGTG | CTGGGATCCGGTATTTCCTGTGG |
| HSP70 | NM_005345.5 | GTGGCTGGACGCCAACACCTT | TTACACACCTGCTCCAGCTCCTTC |
| Tenascin-C | NM_002160.3 | CAACCATCACTGCCAAGTTCACAA | GGGGGTCGCCAGGTAAGGAG |
| NOTCH1 | NM_017617.3 | TACAAGATCGAGGCCGTGCAGA | GCCCACGAAGAACAGAAGCACA |
| NOTCH2 | NM_024408.3 | TGCAGTGACTTCATTGGTGGATACAGA | ATTCTGGCAGGGCTGATTCTGG |
| NOTCH3 | NM_000435.2 | CACAGAGTGCCCAGAGGCCAAG | TGAGTCCACTGACGGCAATCC |
| NOTCH4 | NM_004557.3 | AGATGGAAGCCCCTGACCTGGA | CGGACTGTACTTCCCCACAGCAA |
| HES1 | NM_005524.3 | CAGTGAAGCACCTCCGGAACCT | GCTCGGTACTTCCCCAGCACAC |
| HES6 | NM_018645.5 | GGAAGCCCCTGGTGGAGAAGAA | GCACCGTCAGCTCCAGCACTT |
| COL1A1 | NM_000088.2 | GGCAACAGCCGCTTCACCTAC | GCGGGAGGACTTGGTGGTTTT |
| COL4A1 | NM_001845.5 | TCGCTGTGGATCGGCTACTCTT | CGATGAATGGCGCACTTCTAAAC |
| COL12A1 | NM_080645.2 | CCCAGGTCCTCCTGGATACTGTGA | GCAGCACTGGCGACTTAGAAAATGT |
| LAMB1 | NM_002291.2 | GGACAAGAGCAATGAGGAGCTGAGA | AGCAACTGCTTCAATGCTGTCCAA |
| Decorin | NM_133505.2 | GGTGGGCTGGCAGAGCATAAGT | TGTCCAGGTGGGCAGAAGTCA |
| TCF7L2 | NM_001146274.1 | CGGAAGGAGCGACAGCTTCAT | GTCTCTCCCGGCTGCTTGTCC |
Circulating leukocyte and muscle telomere length measurements
Because of the missing times points (lack of extracted leukocytes), blood samples from 23 participants were analyzed for mean telomere length. DNA yield was too low for samples from 12 participants, which resulted in blood telomere data for 11 participants (6 PLA and 5 IBU). These individuals were pooled for statistical analysis. For muscle biopsies, there was sufficient remaining tissue for telomere length analysis in 12 participants. Of these 12, an additional 3 participants were excluded as a result of weak signal and 1 subject as a result of technical issues with the analysis. Mean and minimum telomere length values were thus generated from the control and stimulated legs of 5 PLA and 4 IBU participants, pooled for statistical analyses.
Mean and minimum telomere lengths were assessed by using a Southern blot protocol as previously described (25). In brief, samples were digested overnight in a lysis buffer (Triton X-100, 10 mM Tris-Cl, pH 8.0, 1 mM EDTA, pH 7.5, 0.5 M NaCl) and proteinase K. Nucleic acids were extracted with phenol/chloroform/isoamyl alcohol followed by precipitation with ammonium acetate/ethanol. DNA was then washed in 70% ethanol, resuspended in Tris/EDTA buffer (10 mM Tris-Cl, pH 8.0, 1 mM EDTA, pH 7.5) and digested with HinfI (New England Biolabs, Ipswich, MA, USA). Of digested genomic DNA, 3 μg, together with a high molecular weight and 1-kb DNA ladder, were migrated in 0.7% agarose gels (20 h, 90 V) at 4°C. Gels were dried, denatured, and then neutralized. Telomere restriction fragments were detected directly in the dried gels by hybridization to a [32P]-labeled (TTAGGG)4 probe. Gels were exposed to X-ray film (BioMax MS; Kodak, Rochester, NY, USA) with a BioMax transcreen (BioMax MS). Signals were scanned, analyzed by using a computer-assisted system (Scion Image 4.03; Scion Corp, Frederick, MD, USA) and then modeled as previously described (25). A representative Southern blot and derived signal intensity curves for the muscle biopsies from one participant are shown in Supplemental Fig. 4.
For blood samples, δ values were determined in relation to the Pre sample. For muscle, δ values for the stimulated leg were calculated in relation to the same-day biopsy from the control leg. For reference, δ values for the stimulated and control leg were also calculated in relation to Pre (Supplemental Fig. 5).
Muscle collagen staining (PicroSirius Red)
Cross sections were stained with Sirius Red as follows: slides were placed in Bouin’s fluid [70% saturated aqueous picric acid (P6744; Sigma-Aldrich, St. Louis, MO, USA), 5% acetic acid, 25% formalin] for 30 min, rinsed in distilled water for 1 min and placed in 0.15% fast blue RR (F0500; Sigma-Aldrich) in a magnesium borate buffer (7 mM magnesium sulfate, 60 mM magnesium borate) for 10 min. After 3 washes in distilled water, slides were placed in PicroSirius Red solution [0.1% Sirius Red F3B (Direct Red 80, 365548; Sigma-Aldrich) in saturated aqueous picric acid] for 60 min. A 10-s rinse in acidified water (0.5% glacial acetic acid in distilled water) was followed by a picric alcohol rinse (20% absolute ethanol, 70% distilled water, 10% saturated picric acid). Sections were dehydrated, cleared in xylene, and mounted with Pertex. Images were captured by using a 20× objective in areas of the section not containing perimysium. The area in one image was 0.15 mm2, and, in general, 3 images per section were analyzed and averaged by using ImageJ software (v1.50e; NIH, Bethesda, MD, USA), using the thresholding function to determine the Raw Integrated Density, which takes into account the area and staining intensity of the stained pixels. We included the Pre biopsy from the control leg and all time points from the stimulated leg in the analysis.
Statistics
All data were analyzed by using SigmaPlot for Windows 11.0 (Systat Software, San Jose, CA, USA). The Mann-Whitney test was used to compare IBU and PLA for the parameters total work, current, and perceived soreness during and immediately after stimulation. Nonparametric tests were also used to evaluate the following data sets: H&E evaluations, Ki-67, desmin, dystrophin, MHCe, MHCn, and Sirius Red (illustrated by scatter plots). Each treatment group was tested separately with the Friedman test and, if the outcome was significant, with Dunnett’s method for multiple comparisons to compare each time point with Pre. To test for a drug effect, IBU and PLA were compared at each postexercise time point with the Mann-Whitney test. mRNA data (log-transformed), satellite cell data, circulating leukocytes, circulating damage markers (log-transformed), and all functional data were analyzed by using a 2-way repeated measures ANOVA with time and drug as factors. (For mRNA data on the stimulated leg, the Pre time point was included as Pre = 1.) Where a drug × time interaction was detected, the Student-Newman-Keuls method of multiple comparisons was performed. Time points different from Pre are reported. Blood and muscle telomere data were analyzed by 1-way repeated measures ANOVA, and where a main effect was observed, by Dunnett’s method to compare each time point with Pre. Differences were considered significant at P < 0.05. Data are means ± sem, unless stated otherwise.
RESULTS
Of the 32 recruited, 1 participant dropped out after the d 14 blood sample and a second on d 2 as a result of muscle soreness. A third participant was excluded because of participation in another experiment that involved muscle biopsies during the course of the study. Thus, 29 subjects (15 IBU, 14 PLA) completed the study. Random assignment of the leg to be stimulated resulted in a similar number of dominant legs being stimulated in each group (8 IBU, 7 PLA 7).
Total work and current
There was no significant difference between IBU and PLA in total work performed by the knee extensor muscles during the ES protocol [IBU, 125 ± 53; PLA, 148 ± 61 J/kg (means ± sd)]. Furthermore, no differences were found in the amount of current applied during ES [30°/s: IBU, 62 ± 12; PLA, 69 ± 13; at 180°/s: IBU, 77 ± 13; PLA, 85 ± 17 mA (means ± sd)].
Mechanical muscle function
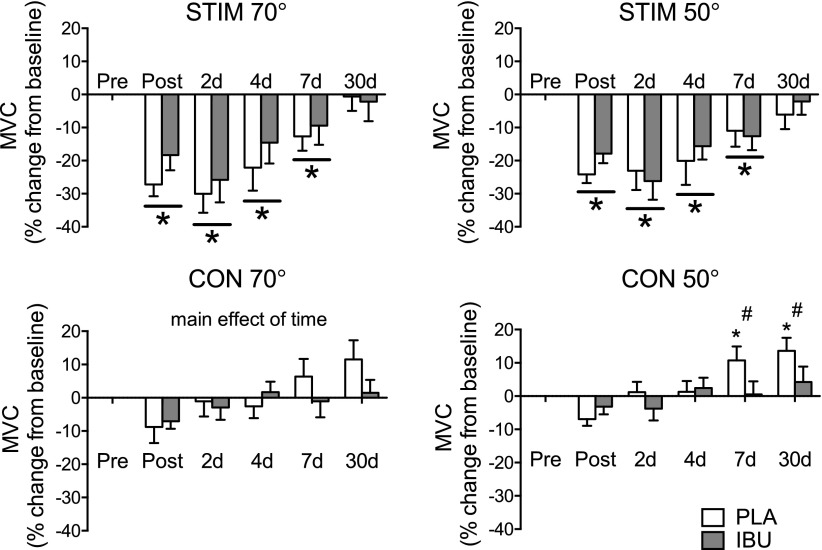
No drug × time interaction was revealed for any of the measures of muscle function in the stimulated leg. A main effect of time was detected for the following measurements made in the stimulated leg, both at a knee angle of 50 and of 70°: MVC, RFD50 ms, RFD100 ms (see Supplemental Table 1 for details of these and all other parameters obtained). In addition, a main effect of drug was found for MVC at 70°, with IBU producing a greater MVC than PLA in general. As shown in Fig. 3, the percent change in MVC was similar for both PLA and IBU, with losses in MVC observed immediately after and on d 2, 4, and 7. In the control leg, a time–drug interaction was found for absolute and relative MVC at 50°, with differences between IBU and PLA observed immediately after stimulation for the absolute values and for the relative change data at dy 7 (IBU, 0.5 ± 15.2%; PLA, 10.7 ± 15.6%) and d 30 (IBU, 4.2 ± 17.5%; PLA, 13.6 ± 14.7%).
Figure 3.
Muscle strength. Changes in MVC measured immediately after and in the days following a single bout of ES of the thigh muscles of one leg in young healthy men receiving either PLA or IBU. Values are percent change from baseline and are presented separately for the stimulated (stim) and control (con) legs at 70 or 50° of knee flexion (means ± sem). IBU, n = 15; PLA, n = 14. *P < 0.05 vs. Pre (main effect of time underlined); #P < 0.05 between groups.
Soreness
During and immediately after ES, there were no differences between IBU and PLA in perceived muscle soreness. When assessed at 2 h and during the 7 d after ES, no differences in soreness measurement between groups were detected. Data are presented in Supplemental Table 2. Soreness increased in the stimulated leg similarly over time in both groups with all time points being elevated compared with palpation, contraction, and stretch tests in Pre.
Circulating leukocytes
As displayed in Supplemental Fig. 6, concentrations of leukocytes and subpopulations of lymphocytes, neutrophils and eosinophils, changed after 2 h in response to ES but were unaffected by IBU ingestion.
Circulating leukocyte telomere length
A main effect of time was detected but no significant changes from Pre were found in mean leukocyte telomere length at any of the investigated time points (Supplemental Fig. 7). Absolute value at baseline was 9.5 ± 0.4 kbp.
Circulating markers of muscle damage
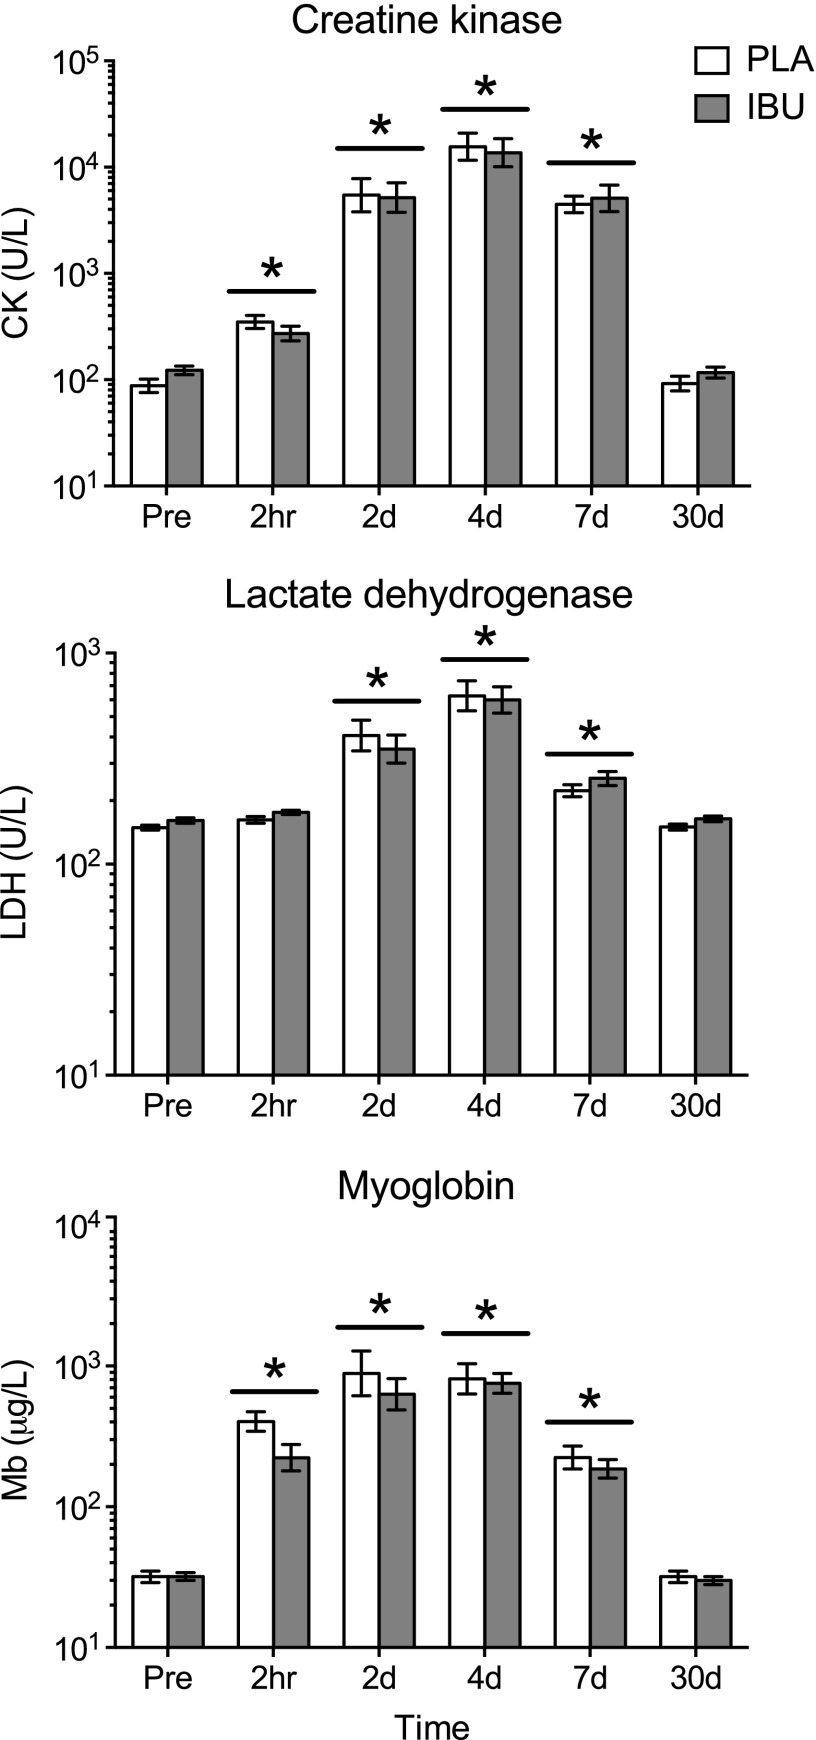
As shown in Fig. 4, circulating levels of CK, LDH, and Mb increased similarly in both groups, with greater levels vs. Pre detected as early as 2 h after for CK and Mb and at d 2 for LDH. There was a tendency for a drug × time interaction for LDH (P = 0.051). Peak mean ± sem CK values of 21,744 ± 3569 and 19,353 ± 5586 U/L for PLA and IBU, respectively, were observed on d 4.
Figure 4.
Circulating markers of muscle damage. Circulating levels of CK, LDH, and Mb were measured as indirect markers of skeletal muscle damage before (Pre) and at 2 h and on d 2, 4, 7, and 30 after a single bout of ES of the thigh muscles of one leg in young healthy men receiving either PLA or IBU. Data are geometric means ± back-transformed sem, displayed on a logarithmic scale y axis. IBU, n = 15; PLA, n = 14. *P < 0.05 vs. (main effect of time underlined).
Muscle biopsy
Damage and regeneration
The extent of fiber damage was determined by the proportion of fibers that demonstrated infiltration (H&E) or a lack of immunoreactivity for desmin or dystrophin (Figs. 5 and 6). Differences vs. Pre occurred on d 7 for all parameters in the injured leg. The proportion of infiltrated fibers peaked on d 7 in both groups. The median (range) of PLA was 4.5% (0.0–15.8) and IBU was 1.9% (0.0–24.7), with only 2 individuals in PLA and 4 in IBU failing to show any infiltrated fibers at this time point. Likewise, the proportion of damaged fibers peaked on d 7 in both groups. In PLA, median (range) was 1.3% (0.0–12.2) and in IBU was 1.1% (0.0–8.2). The peak proportion of desmin-negative fibers observed on d 7 was 5.5% (0.0–29.3) and 7.6% (0.0–16.1) in PLA and IBU, respectively. The peak proportion of dystrophin-negative fibers observed on d 7 was 6.7% (0.0–25.8) and 7.7% (0.0–26.4) in PLA and IBU, respectively. No differences between groups were detected,although a tendency for a difference between IBU and PLA was noted for desmin on d 2 (P = 0.091). Regeneration was assessed by the proportion of small fibers, fibers containing internal nuclei, or fibers displaying immunoreactivity for MHCn or MHCe. Significantly more small fibers or fibers containing internal nuclei were observed on d 30 compared with Pre (with only 1 individual in PLA and 2 in IBU registered zero fibers with internal nuclei at this time point) and a tendency for a difference between groups on d 30 was noted (P = 0.085). The d-30 median (range) values for internal nuclei were 2.8% (0.0–12.4) and 1.1% (0.0–9.0) and for small fibers were 1.9% (0.2–15.8) and 0.7% (0.0–15.3) for PLA and IBU, respectively. MHCe+ and MHCn+ fibers were observed to increase on d 7 in both groups and on d 30 in PLA only, with a difference between groups on d 30 for MHCe and a tendency for the same for MHCn (P = 0.071). The d-30 median (range) values for the proportion of MHCn+ fibers were 16.5% (0.2–75.3) and 0.04% (0.0–58.5), and for MHCe+ fibers were 2.3% (0.0–44.0) and 0.0% (0.0–5.9) in PLA and IBU, respectively. Of note, the 2 PLA individuals who demonstrated the highest values for internal nuclei on d 30 also showed the highest values for MHCn and MHCe, and were within the 3 highest-scoring participants for small fibers on d 30. Similar clustering was observed in IBU in which the 2 highest-scoring individuals for internal nuclei on d 30 also had the highest 2 scores for MHCn and were within the 3 highest scores for MHCe and small fibers on d 30.
Figure 5.
Damage and regeneration (H&E). An assessment of H&E-stained cross sections of muscle biopsies collected before (Pre) a single bout of ES and postinjury at 2.5 h and on d 2, 7, and 30 in young men receiving either PLA or IBU. The proportion of damaged fibers and infiltrated fibers were used to assess fiber injury, whereas the proportion of small fibers and fibers with internal nuclei were used as an indication of muscle regeneration. Note that the y axis scale is not the same on all graphs. IBU, n = 15; PLA, n = 13. #P < 0.05 between groups; *P < 0.05 vs. Pre.
Figure 6.
Damage and regeneration (IHC). An assessment of IHC-stained cross sections of muscle biopsies collected before (Pre) a single bout of ES and postinjury at 2.5 h and on d 2, 7, and 30 in young men receiving either PLA or IBU. Desmin-negative and dystrophin-negative fibers are indicative of muscle damage, whereas the presence of MHCn-positive and MHCe-positive fibers is evidence of muscle regeneration. Note that the y axis scale is not the same on all graphs. IBU, n = 15; PLA, n = 14. #P < 0.05 between groups; *P < 0.05 vs. Pre.
From H&E analyses of the control leg, few biopsies contained affected fibers (damaged, 0; infiltrated, 1; small, 3; internal nuclei, 3), with a maximum of 1% of fibers affected, with the exception of a single biopsy in which 5% of fibers were found to contain central nuclei. For IHC analyses of the control leg, no affected fibers were found to be negative for desmin or dystrophin, whereas 3 biopsies contained MHCe+ fibers and 10 biopsies contained MHCn+ fibers. These affected fibers made up < 1% of the total number of fibers in the respective section.
Satellite cell number
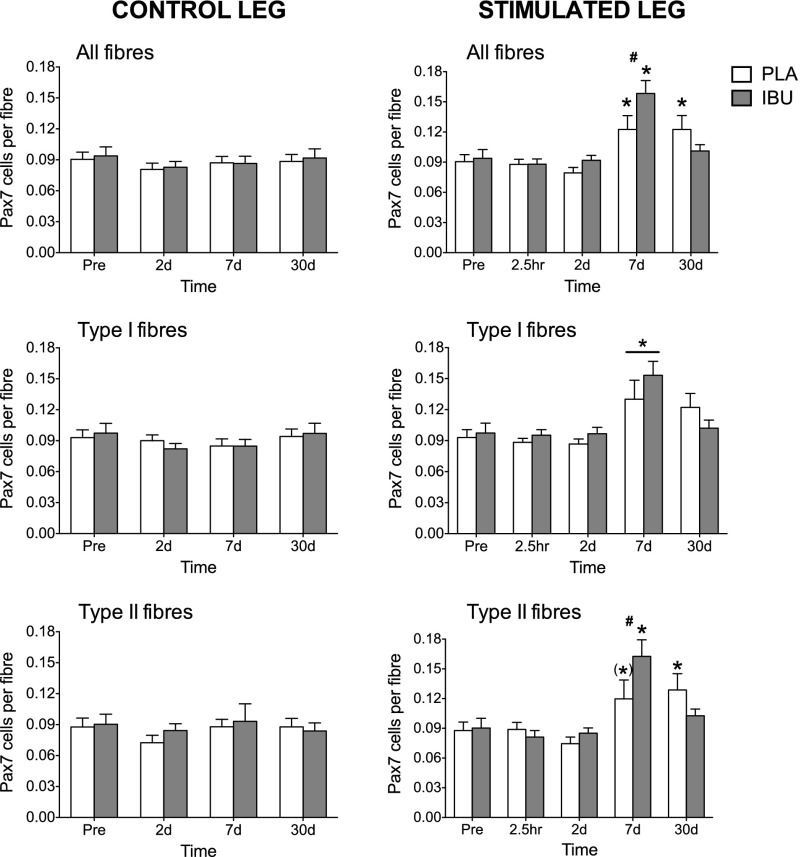
No effect of drug or time was detected for the number of Pax7+ cells in the control leg (Fig. 7). In contrast, increases in the number of Pax7+ cells that were associated with type I fibers were detected in the stimulated leg at d 7 (main time effect). A drug × time interaction was found for the number of Pax7+ cells that were associated with type II fibers and all fibers in which differences between groups were detected on d 7, for which both groups peaked but with greater values in IBU compared with PLA. Compared with Pre, elevated numbers of satellite cells per type II fiber and all fibers were detected on d 30 in PLA only, with numbers returning to baseline levels in IBU for both fiber types. There was a strong tendency for an increase in the number of satellite cells per type II fiber on d 7 vs. Pre in PLA (P = 0.051).
Figure 7.
Satellite cell content. Satellite cell (Pax7+) content as assessed on cross sections of muscle biopsies collected before (Pre) and after (2.5 h and on d 2, 7, and 30) a bout of ES of the thigh muscles of one leg (stimulated leg) from young healthy men receiving either PLA or IBU. Data for the control leg are also shown. Data are expressed relative to the total number of all fibers or separately for the number of type I or type II fibers. IBU, n = 15; PLA, n = 14. #P < 0.05 between groups; *P < 0.05 vs. Pre (main effect of time underlined); (*)P = 0.051 vs. Pre.
Ki-67+ satellite cells
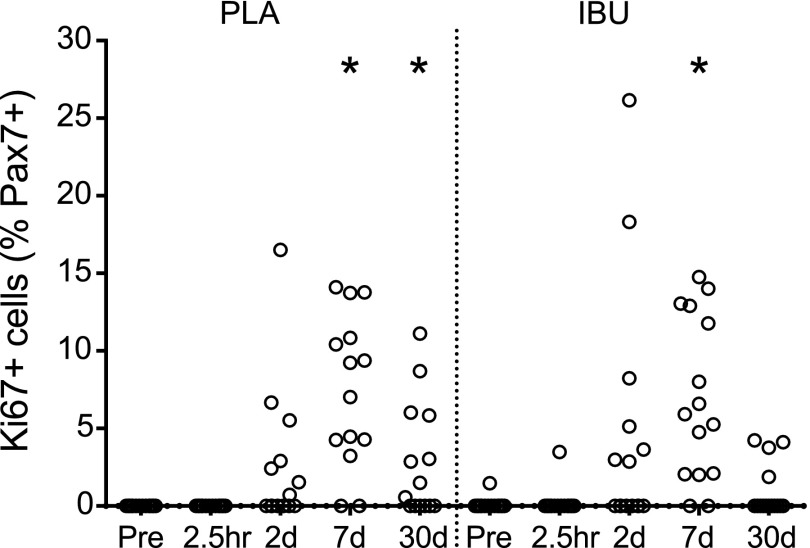
The percentage of satellite cells that was observed to be proliferating (Ki-67+ Pax7+) increased in both groups on d 7 (Fig. 8). The median (range) was 7.5% (0.0–14.1) and 5.9% (0.0–14.8) in PLA and IBU, respectively and was 1% elevated on d 30 in PLA (0.0–11.1). For samples from the control leg, Ki-67+ Pax7+ cells were only observed in 5 biopsies (for one sample, 15% of all Pax7 cells; the other four, < 2%).
Figure 8.
Proliferating satellite cells. The percentage of proliferating (Ki-67+) satellite cells (Pax7+) assessed on cross sections of muscle biopsies collected before (Pre) and after (2.5 h and on d 2, 7, and 30) a bout of ES in young men receiving either PLA or IBU. IBU, n = 15; PLA, n = 14. *P < 0.05 vs. Pre.
ActiveNotch1+ satellite cells
For the proportion of Pax7+ cells that were observed to be ActiveNotch1+, a drug × time interaction was found (Fig. 9). Of Pax7+ cells, 11 ± 3 and 14 ± 2% were observed to be ActiveNotch1+ at Pre in PLA and IBU, respectively. Differences between the groups were detected on d 2 in which only IBU displayed an increase (to 29 ± 3%), whereas both groups peaked on d 7 (PLA, 29 ± 4%; IBU, 33 ± 3%).
Figure 9.
ActiveNotch1+ satellite cells. The percentage of ActiveNotch1+ satellite cells (Pax7+) assessed on cross sections of muscle biopsies collected before (Pre) and after (2.5 h and on d 2, 7, and 30) a bout of ES in young men receiving either PLA or IBU. IBU, n = 15; PLA, n = 14. #P < 0.05 between groups; *P < 0.05 vs. Pre.
mRNA
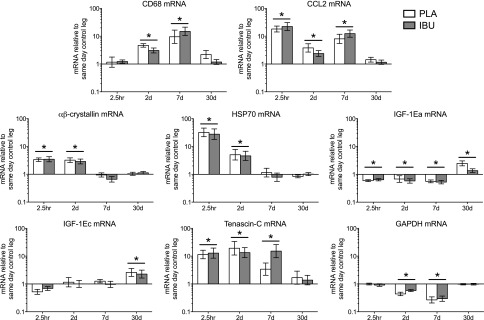
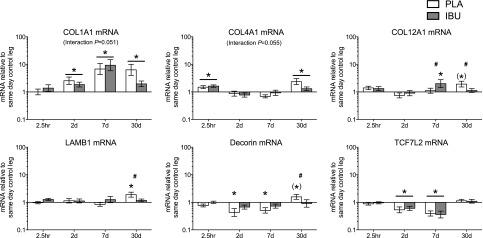
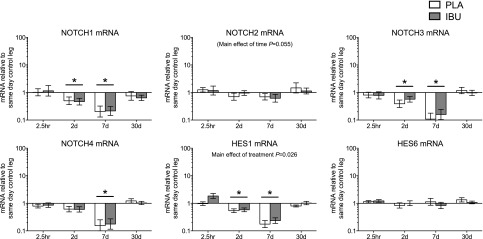
The mRNA targets that were measured are displayed in Figs. 10–12. Main effects of time were detected for CD68, CCL2, αβ-crystallin, HSP70, IGF-1Ea, IGF-1Ec, tenascin-C, GAPDH Notch1, Notch3, Notch4, HES1, COL1A1, COL4A1, and TCF7L2. A drug × time interaction was observed for COL12A1, LAMB1 and decorin. Strong trends toward drug × time interactions were observed for COL1A1 (P = 0.051) and COL4A1 (P = 0.055). Trends were also observed in PLA for COL12A1 (30 d vs. Pre; P = 0.053) and decorin (30 d vs. Pre; P = 0.057).
Figure 10.
Stimulated leg: damage markers. Gene expression levels of markers sensitive to damage in muscle subjected to a bout of ES. Muscle biopsies were collected before and at 2.5 h and on d 2, 7, and 30 poststimulation, and participants received either PLA or IBU for the duration of the study. mRNA levels of CD68, CCL2, αβ-crystallin, HSP70, IGF-1Ea, IGF-1Ec, tenascin-C, and GAPDH are displayed, expressed relative to values for the same-day control leg. Data are geometric means ± back-transformed sem, displayed on a logarithmic scaled y axis. IBU, n = 15; PLA, n = 14. *P < 0.05 vs. Pre (main effect of time underlined).
Figure 12.
Stimulated leg: ECM. Gene expression levels of ECM components in muscle subjected to a bout of ES. Muscle biopsies were collected before and at 2.5 h and on d 2, 7, and 30 poststimulation, and participants received either PLA or IBU for the duration of the study. mRNA levels of collagen types I (COL1A1), IV (COL4A1), XII (COL12A1), and laminin-β1 (LAMB1), decorin, and TCF7L2 are displayed, expressed relative to values for the same-day control leg. Data are geometric means ± back-transformed sem, displayed on a logarithmic scaled y axis. IBU, n = 15; PLA, n = 14. #P < 0.05 between groups; *P < 0.05 vs. Pre (main effect of time underlined); (*)P < 0.06 vs. Pre.
Figure 11.
Stimulated leg: notch. Gene expression levels of Notch signaling in muscle subjected to a bout of ES. Muscle biopsies were collected before and at 2.5 h and on d 2, 7, and 30 poststimulation, and participants received either PLA or IBU for the duration of the study. mRNA levels of NOTCH1, NOTCH2, NOTCH3, NOTCH4, HES1, and HES6 are displayed, expressed relative to values for the same-day control leg. Data are geometric means ± back-transformed sem, displayed on a logarithmic scaled y axis. IBU, n = 15; PLA, n = 14. *P < 0.05 vs. Pre (main effect of time underlined).
Muscle telomere length
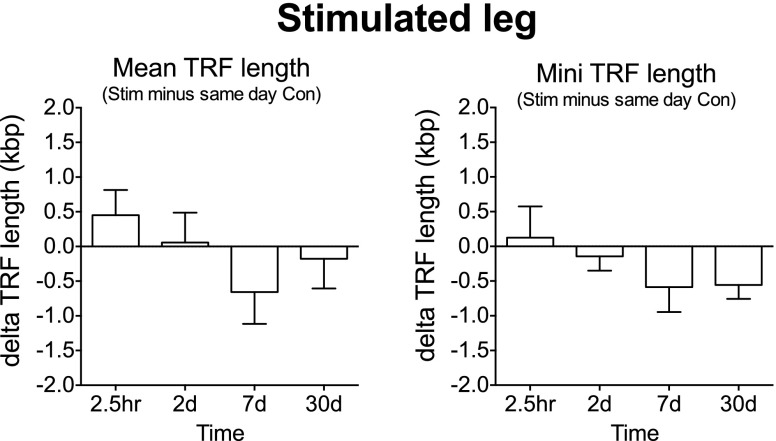
No changes were found for mean or minimum terminal restriction fragment length for the stimulated leg (Fig. 13). The absolute mean and minimum terminal restriction fragment lengths for Pre (control leg) were 10.8 ± 0.5 kbp and 4.8 ± 0.3 kbp, respectively.
Figure 13.
Mean and minimum muscle telomere length. Muscle biopsies were collected before and after (2.5 h and on d 2, 7, and 30) a bout of ES to the thigh muscles of one leg in young men receiving either PLA or IBU. Data are pooled PLA (n = 5) and IBU (n = 4), expressed as δ values for the stimulated (stim) leg vs. same-day biopsy from control (con) leg. TRF, terminal restriction fragment.
Muscle collagen staining (Sirius Red)
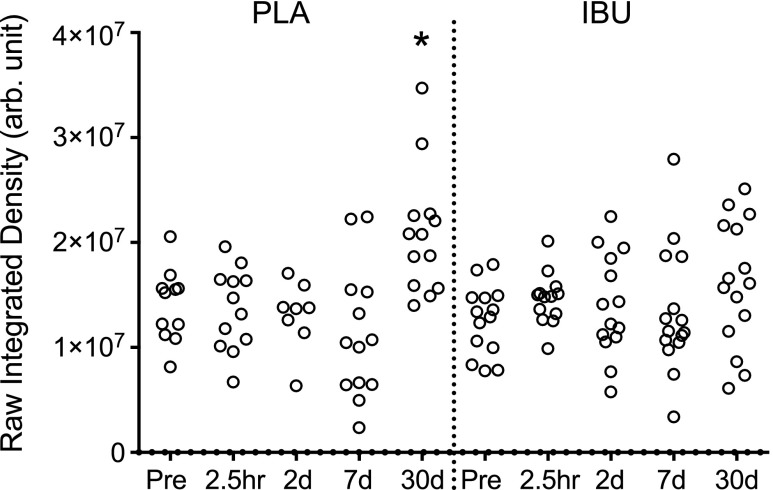
As shown in Fig. 14, a change over time was observed in the PLA group, with elevated levels at 30 d compared with Pre. No changes over time were found for IBU, and no differences between groups at any time point were observed.
Figure 14.
Muscle collagen content. A histologic assessment of Sirius Red–stained cross sections of muscle biopsies collected before (Pre) a single bout of ES and postinjury at 2.5 h and on d 2, 7, and 30 in young men receiving either PLA or IBU. Data reflect endomysial collagen only, as areas that contained perimysium were excluded, and are presented as arbitrary units (arb. unit). IBU, n = 15; PLA, n = 13. *P < 0.05 vs. Pre.
DISCUSSION
The main findings of this study were that ingestion of NSAID resulted in a greater initial increase in satellite cell content compared with placebo treatment in the regeneration of skeletal muscle in young healthy men. This was preceded by a greater proportion of Notch-activated satellite cells and followed by a faster repair of muscle fibers and a return to baseline levels of satellite cells and ECM gene expression levels in NSAID vs. placebo treatment.
Satellite cells
Our finding that there was a greater increase in satellite cell content in NSAID compared with placebo ingestion 7 d after a muscle-injury stimulus contrasted with our hypothesis that was based on our previous observations of an apparent blocking of the increase in satellite cell content observed in nontreated muscle with NSAID exposure (9, 10). In contrast to these earlier studies, the goal of the current study was to induce myofiber damage and necrosis so that we could follow various cell markers of true muscle regeneration at early and late (30 d) time points. It is clear from the damage and regeneration markers used to evaluate our biopsies that this model was successful, with most individuals demonstrating a strong response to our ES model. It is possible that the difference in the extent of muscle damage between the current study and our two previous studies can explain the opposing effect of NSAIDs on the satellite cell response. Of interest, no change over time or effect of IBU was observed in the satellite cell content of the control leg (nonstimulated), which indicated that the size of the satellite cell pool in young healthy males at rest is not altered by IBU during a period of 6 wk. This also demonstrated that repeated biopsy of the same muscle does not result in an increased satellite cell content, at least when sampling sites are separated by 3 cm and adhere to the time course employed in our study. Together, these data show a clear effect of IBU to enhance the number of satellite cells during the initial regeneration phase after myofiber damage. At 30 d, satellite cell content returned to preinjury levels in the IBU group and remained elevated in PLA, which was indicative of a temporal modulation of the satellite cell response with IBU.
These results should also be considered in the context of aging. Of interest, it has been demonstrated in old mice that, although aging muscle maintains an inherent capacity to mount a solid myogenic response to injury, the response is slower than in younger mice. This corresponds to a delayed inflammatory response in older muscles (26). In light of this observation, and given the importance of inflammatory signals in the sequence of steps involved in myogenesis (8), further work may be required to determine whether the present findings also apply to older individuals.
Because Notch signaling has been shown to be key to satellite cell activation (15), we also investigated the proportion of satellite cells that expressed Notch intracellular domain, which was indicative of an activation of the Notch signaling pathway. This led to the second most marked and novel finding of this study: compared with PLA, a greater proportion of satellite cells in IBU were found to be positive for Notch 2 d after ES. It is possible that the superior increase in satellite cell number with IBU administration on d 7 resulted from a greater prior IBU-mediated Notch activation of satellite cells on d 2. Despite the finding that NSAID ingestion leads to potentiated Notch signaling, we were unable to detect any drug effects on this pathway when studied at the gene expression level. Many of the targets, for example, NOTCH1, NOTCH3, NOTCH4, and HES1 mRNA, all decreased over time and to a similar extent in both participant groups. The reason for this decrease was not clear but it is possible to attribute it to the large infiltration of inflammatory cells, which may contribute to elevated levels of RPLP0 mRNA to which all mRNA data were normalized, which in effect diluted levels of muscle-specific genes. In support of this, infiltration peaked on d 7, which coincided with the greatest increase in mRNA levels of macrophage marker CD68 as well as the greatest decrease in many of the muscle fiber–related genes. The mechanism by which anti-inflammatory medication acts on satellite cells is currently unknown and could be related to a modulation in the level of Notch ligands Delta and Jagged. To our knowledge, no data exist on the interaction between NSAIDS and Notch ligands in human skeletal muscle, and although we did not address this aspect, our data provide a theoretical framework for future investigations into the specific mechanisms of action of NSAIDs on Notch signaling in satellite cells.
ECM remodeling
With regard to the later stage of regeneration, our data point to a faster regeneration of myofibers and muscle ECM with IBU intake. This is supported by IHC findings of a greater proportion of fibers that demonstrate embryonic myosin immunoreactivity and a trend toward a greater proportion of fibers with internal nuclei and neonatal myosin in PLA vs. IBU at d 30, all hallmarks of ongoing regeneration. In muscle ECM, we observed elevated levels of endomysial collagen as assessed by Sirius Red staining at 30 d in PLA only, which further supported the ongoing restoration of muscle architecture in this group. With regard to ECM gene expression levels at 30 d, IBU was found to alter the response of collagen XII, laminin-β1, and decorin mRNA, with collagen types I and IV demonstrating a trend toward interaction. These ECM proteins are significant in that collagen XII binds to collagen I fibrils and is important in maintaining the matrix integrity in load-bearing tissues (27). Laminin and collagen IV are major components of the basement membrane, which constitutes one side of the satellite cell niche as well as serving to surround—mechanically support—muscle fibers. The proteoglycan decorin has been shown to play a role in inducing the proliferation of satellite cells (14) and in modulating fibrosis in regenerating muscle (13). Transient fibrosis is often seen during regeneration (28), the removal of which is important for the completion of the restoration process. Taken together, the ∼2-fold up-regulation in PLA compared with IBU, and the consistency in an IBU-dependent response among all of the matrix gene targets studied, provide strong evidence for a role for NSAIDs in the modulation of the adaptation time course of muscle ECM during regeneration. Although further work is required to determine whether these changes in transcriptional activity are mirrored by a similar pattern at the protein level for each target, it is likely that changes at the gene expression level at least reflect the presence of an effective stimulus to remodel the muscle ECM compartment. It also seems from these IHC and gene expression data that IBU administration resulted in an acceleration of these processes, which is likely to be responsible for the faster recovery of baseline values observed with IBU administration.
Although it is reasonable to assume that the faster regeneration of myofibers is at least in part a result of the IBU-enhanced increase in satellite cells that was detected on d 7, the mechanism behind the IBU effects on the muscle ECM are not as clear. Recent data point to a regulatory link between satellite cells and ECM. Here, an accumulation of muscle ECM and the expansion of fibroblasts was observed in satellite cell–depleted mice that were subjected to muscle overload (3), which suggests a regulatory role for satellite cells in muscle ECM content via the modulation of fibroblast activity. On this basis, it may be speculated that the greater satellite cell content on d 7 with IBU not only led to a more rapid repair of myofibers, but was also responsible for the attenuation in ECM transcription observed on d 30. However, we have no evidence that the persistent ECM response detected in PLA at this time point had any negative repercussions on the function of muscle or its capacity to complete the regeneration process successfully. Indeed, our earlier findings also indicated a persistent up-regulation of muscle ECM remodeling 30 d into the regeneration process (12). With regard to the functional implications of these adaptations, no effect of IBU was found on the loss or recovery of mechanical muscle function after injury stimulus in the current study, which suggests that IBU-mediated effects in relation to a single cycle of injury and repair do not translate into effects on the force-producing capacity of muscle. Alternatively, considering the relatively large volume of the entire quadriceps muscle, the damaged areas of the muscle evoked by the ES protocol may have been minor compared with the volume of undamaged (i.e., nonstimulated) muscle tissue, which may potentially blunt the decrement in maximal muscle force and RFD induced by ES both with and without NSAID administration. Regardless, when taken together, the present findings seem point to a more rapid repair of injured skeletal muscle tissue with the ingestion of NSAIDs.
Telomere length
Telomere length as determined in muscle homogenate revealed that, regardless of drug treatment, the proliferation of satellite cells was not accompanied by minimum telomere length shortening. This suggests that the regenerative potential is not jeopardized in human skeletal muscle in which regeneration events of such large magnitude have been induced by nonphysiologic loading. Mean telomere length in skeletal muscle is considered to represent the majority of postmitotic myonuclei, whereas the minimum telomere length represents telomeres from satellite cells and myonuclei newly incorporated during the last mitotic cycles. In cultured satellite cells that were isolated from the skeletal muscle of young adults, a telomeric loss of 155 bp per population doubling was previously reported (29), and differences of 100–200 bp can be detected in whole muscle homogenate (25) as a reference for the mean (nonsignificant) change of ∼500 bp observed in the current study. Abnormally short minimum telomere lengths have been found in the skeletal muscle of endurance athletes with exercise-associated chronic fatigue (30), and an inverse relationship was found between the load imposed on muscles and minimum telomere length in the skeletal muscle of experienced powerlifters (31), which indicates that minimum telomere length could be a sensitive indicator of the regenerative capacity of muscle. However, in the latter study, no differences were found between powerlifters and controls, which suggests that in vivo telomere shortening does not occur in heavily loaded skeletal muscle (31, 32) or even in the skeletal muscle of patients with ongoing cycles of degeneration and regeneration (33). In the latter study, high expression levels of several factors that are involved in telomere length regulation suggested the existence of endogenous mechanisms responsible for telomere length protection. The in vivo recruitment of such factors during the regeneration that was induced in the current study cannot be excluded but may not be the only source of explanation. Of interest, the occurrence of asymmetric segregation of template DNA strands during the division of Pax7 cells has recently been shown in vitro (34), which suggests that template DNA strands segregate to the daughter cell that is acquiring a stem cell state, whereas neosynthetized DNA strands go to the daughter cell that will differentiate. According to such a model, shorter telomeres would not be generated in the pool of quiescent satellite cells. Such a hypothesis can also help to explain the apparent paradox between observations of large increases in satellite cell proliferation and the maintenance of telomere length. It could also lead to the reconsideration of the biologic meaning of minimum telomere length, which is still accepted as an indicator of the length of telomeres present in skeletal muscle satellite cells. It should be noted that a potential limitation of the measurement is that it was performed on whole muscle homogenate rather than on isolated satellite cells, and it is unclear whether the proliferation of satellite cells in response to stimulation was extensive enough to be detected by this method. With regard to the leukocyte mean telomere length, the finding of a main effect of time, but with no time points differing from baseline, suggests that leukocyte telomere length did change during the course of the study. This is most likely a reflection of the fluctuation in the subpopulations of leukocytes that was observed in this study, in which increased numbers of neutrophils and decreased numbers of eosinophils and lymphocytes were detected, resulting in changes over time to the relative proportion of the various cell populations present in circulation.
CONCLUSIONS
Our results clearly show that ingestion of NSAIDs enhance the activation of satellite cells via Notch signaling in the early phase of the regeneration of human skeletal muscle after eccentric contractions evoked by intense neuromuscular electrical stimulation. In addition to the effect on early satellite cell proliferation, the administration of anti-inflammatory medication was observed to accelerate the repair of myofibers in the later stages of regeneration and to mediate a more rapid return of satellite cells and muscle ECM gene expression levels to baseline values, in essence shifting the entire time course of satellite cell, myofiber, and muscle ECM adaptations to a more rapid repair. Of interest, no shortening of muscle telomere length was detected, which further supports the presence of telomere length protective mechanisms in human skeletal muscle in vivo. It should be noted that although these findings clearly point to a beneficial effect of NSAID ingestion in a clinical context in which extensive damage to fibers is evident, these results may not apply in the context of physiologic loading of skeletal muscle, for which further experimental work is required.
Acknowledgments
The authors thank Camilla Hansen (Institute of Sports Medicine Copenhagen, Bispebjerg Hospital) for excellent technical assistance in taking the blood samples and preparing the muscle biopsies and Anja Jokipii (Institute of Sports Medicine Copenhagen, Bispebjerg Hospital) for the mRNA analysis. The authors also thank Mathias Ekstrand (School of Health and Medical Sciences, Örebro University) for excellent technical assistance with the telomere analysis. The F1.652 and A4.951 antibodies developed by Helen M. Blau were obtained from the Developmental Studies Hybridoma Bank (University of Iowa, Iowa City, IA, USA), developed under the auspices of the U.S. National Institutes of Health, Eunice Kennedy Shriver National Institute of Child Health and Human Development and maintained by the Department of Biological Sciences, University of Iowa. This work was supported by the Nordea Foundation (Healthy Aging grant), MYOAGE (#223576), which is funded by the European Commission under FP7, the Danish Rheumatism Association, Team Danmark, Anti Doping Danmark, Øster-Jørgensen og Rømhild Andersen Fonden, King Christian IX and Queen Louise’s Anniversary grant (Kong Christian IX og Dronning Louises Jubilæumslegat), the Danish Agency for Science Technology and Innovation (Medical Research Council), and the Lundbeck Foundation.
Glossary
- CK
creatine kinase
- ECM
extracellular matrix
- ES
electrical stimulation
- H&E
hematoxylin and eosin
- IBU
ibuprofen
- IHC
immunohistochemistry
- LDH
lactate dehydrogenase
- Mb
myoglobin
- MHCe
embryonic myosin heavy chain
- MHCn
neonatal myosin heavy chain
- MVC
maximum voluntary isometric contraction
- NSAID
nonsteroidal anti-inflammatory drug
- PLA
placebo
- Pre
before electrical stimulation protocol
- RFD
rate of force development
Footnotes
This article includes supplemental data. Please visit http://www.fasebj.org to obtain this information.
REFERENCES
- 1.Relaix F., Zammit P. S. (2012) Satellite cells are essential for skeletal muscle regeneration: the cell on the edge returns centre stage. Development 139, 2845–2856 [DOI] [PubMed] [Google Scholar]
- 2.McCarthy J. J., Mula J., Miyazaki M., Erfani R., Garrison K., Farooqui A. B., Srikuea R., Lawson B. A., Grimes B., Keller C., Van Zant G., Campbell K. S., Esser K. A., Dupont-Versteegden E. E., Peterson C. A. (2011) Effective fiber hypertrophy in satellite cell-depleted skeletal muscle. Development 138, 3657–3666 [DOI] [PMC free article] [PubMed] [Google Scholar]
- 3.Fry C. S., Lee J. D., Jackson J. R., Kirby T. J., Stasko S. A., Liu H., Dupont-Versteegden E. E., McCarthy J. J., Peterson C. A. (2014) Regulation of the muscle fiber microenvironment by activated satellite cells during hypertrophy. FASEB J. 28, 1654–1665 [DOI] [PMC free article] [PubMed] [Google Scholar]
- 4.Urso M. L. (2013) Anti-inflammatory interventions and skeletal muscle injury: benefit or detriment? J. Appl. Physiol. (1985) 115, 920–928 [DOI] [PubMed] [Google Scholar]
- 5.Trappe T. A., Liu S. Z. (2013) Effects of prostaglandins and COX-inhibiting drugs on skeletal muscle adaptations to exercise. J. Appl. Physiol. (1985) 115, 909–919 [DOI] [PMC free article] [PubMed] [Google Scholar]
- 6.Mackey A. L., Mikkelsen U. R., Magnusson S. P., Kjaer M. (2012) Rehabilitation of muscle after injury - the role of anti-inflammatory drugs. Scand. J. Med. Sci. Sports 22, e8–e14 [DOI] [PubMed] [Google Scholar]
- 7.Järvinen T. A., Järvinen M., Kalimo H. (2013) Regeneration of injured skeletal muscle after the injury. Muscles Ligaments Tendons J. 3, 337–345 [PMC free article] [PubMed] [Google Scholar]
- 8.Saclier M., Yacoub-Youssef H., Mackey A. L., Arnold L., Ardjoune H., Magnan M., Sailhan F., Chelly J., Pavlath G. K., Mounier R., Kjaer M., Chazaud B. (2013) Differentially activated macrophages orchestrate myogenic precursor cell fate during human skeletal muscle regeneration. Stem Cells 31, 384–396 [DOI] [PubMed] [Google Scholar]
- 9.Mackey A. L., Kjaer M., Dandanell S., Mikkelsen K. H., Holm L., Døssing S., Kadi F., Koskinen S. O. A., Jensen C. H., Schrøder H. D., Langberg H. (2007) The influence of anti-inflammatory medication on exercise-induced myogenic precursor cell responses in humans. J. Appl. Physiol. 103, 425–431 [DOI] [PubMed] [Google Scholar]
- 10.Mikkelsen U. R., Langberg H., Helmark I. C., Skovgaard D., Andersen L. L., Kjaer M., Mackey A. L. (2009) Local NSAID infusion inhibits satellite cell proliferation in human skeletal muscle after eccentric exercise. J. Appl. Physiol. 107, 1600–1611 [DOI] [PMC free article] [PubMed] [Google Scholar]
- 11.Grounds M. D. (2014) The need to more precisely define aspects of skeletal muscle regeneration. Int. J. Biochem. Cell Biol. 56, 56–65 [DOI] [PubMed] [Google Scholar]
- 12.Mackey A. L., Brandstetter S., Schjerling P., Bojsen-Moller J., Qvortrup K., Pedersen M. M., Doessing S., Kjaer M., Magnusson S. P., Langberg H. (2011) Sequenced response of extracellular matrix deadhesion and fibrotic regulators after muscle damage is involved in protection against future injury in human skeletal muscle. FASEB J. 25, 1943–1959 [DOI] [PMC free article] [PubMed] [Google Scholar]
- 13.Acharjee S., Chung T. K., Gopinadhan S., Shankar S. R., Wang Y., Li L., Vercherat C., Gulbagci N. T., Rossner M., Taneja R. (2014) Sharp-1 regulates TGF-β signaling and skeletal muscle regeneration. J. Cell Sci. 127, 599–608 [DOI] [PubMed] [Google Scholar]
- 14.Zeng Q. J., Wang L. N., Shu G., Wang S. B., Zhu X. T., Gao P., Xi Q. Y., Zhang Y. L., Zhang Z. Q., Jiang Q. Y. (2014) Decorin-induced proliferation of avian myoblasts involves the myostatin/Smad signaling pathway. Poult. Sci. 93, 138–146 [DOI] [PubMed] [Google Scholar]
- 15.Conboy I. M., Rando T. A. (2002) The regulation of Notch signaling controls satellite cell activation and cell fate determination in postnatal myogenesis. Dev. Cell 3, 397–409 [DOI] [PubMed] [Google Scholar]
- 16.Brack A. S., Conboy I. M., Conboy M. J., Shen J., Rando T. A. (2008) A temporal switch from notch to Wnt signaling in muscle stem cells is necessary for normal adult myogenesis. Cell Stem Cell 2, 50–59 [DOI] [PubMed] [Google Scholar]
- 17.Mourikis P., Sambasivan R., Castel D., Rocheteau P., Bizzarro V., Tajbakhsh S. (2012) A critical requirement for notch signaling in maintenance of the quiescent skeletal muscle stem cell state. Stem Cells 30, 243–252 [DOI] [PubMed] [Google Scholar]
- 18.Bjornson C. R., Cheung T. H., Liu L., Tripathi P. V., Steeper K. M., Rando T. A. (2012) Notch signaling is necessary to maintain quiescence in adult muscle stem cells. Stem Cells 30, 232–242 [DOI] [PMC free article] [PubMed] [Google Scholar]
- 19.Crameri R. M., Aagaard P., Qvortrup K., Langberg H., Olesen J., Kjaer M. (2007) Myofibre damage in human skeletal muscle: effects of electrical stimulation versus voluntary contraction. J. Physiol. 583, 365–380 [DOI] [PMC free article] [PubMed] [Google Scholar]
- 20.Mackey A. L., Bojsen-Moller J., Qvortrup K., Langberg H., Suetta C., Kalliokoski K. K., Kjaer M., Magnusson S. P. (2008) Evidence of skeletal muscle damage following electrically stimulated isometric muscle contractions in humans. J. Appl. Physiol. 105, 1620–1627 [DOI] [PubMed] [Google Scholar]
- 21.Aagaard P., Simonsen E. B., Andersen J. L., Magnusson P., Dyhre-Poulsen P. (2002) Increased rate of force development and neural drive of human skeletal muscle following resistance training. J. Appl. Physiol. 93, 1318–1326 [DOI] [PubMed] [Google Scholar]
- 22.Mackey A. L., Andersen L. L., Frandsen U., Suetta C., Sjøgaard G. (2010) Distribution of myogenic progenitor cells and myonuclei is altered in women with vs. those without chronically painful trapezius muscle. J. Appl. Physiol. 109, 1920–1929 [DOI] [PubMed] [Google Scholar]
- 23.Carlson M. E., Suetta C., Conboy M. J., Aagaard P., Mackey A., Kjaer M., Conboy I. (2009) Molecular aging and rejuvenation of human muscle stem cells. EMBO Mol. Med. 1, 381–391 [DOI] [PMC free article] [PubMed] [Google Scholar]
- 24.Redmond E. M., Liu W., Hamm K., Hatch E., Cahill P. A., Morrow D. (2014) Perivascular delivery of Notch 1 siRNA inhibits injury-induced arterial remodeling. PLoS One 9, e84122 [DOI] [PMC free article] [PubMed] [Google Scholar]
- 25.Ponsot E., Kadi F. (2008) Signal modelization for improved precision of assessment of minimum and mean telomere lengths. Electrophoresis 29, 542–544 [DOI] [PubMed] [Google Scholar]
- 26.Shavlakadze T., McGeachie J., Grounds M. D. (2010) Delayed but excellent myogenic stem cell response of regenerating geriatric skeletal muscles in mice. Biogerontology 11, 363–376 [DOI] [PubMed] [Google Scholar]
- 27.Chiquet M., Birk D. E., Bönnemann C. G., Koch M. (2014) Collagen XII: protecting bone and muscle integrity by organizing collagen fibrils. Int. J. Biochem. Cell Biol. 53, 51–54 [DOI] [PMC free article] [PubMed] [Google Scholar]
- 28.Lemos D. R., Babaeijandaghi F., Low M., Chang C. K., Lee S. T., Fiore D., Zhang R. H., Natarajan A., Nedospasov S. A., Rossi F. M. (2015) Nilotinib reduces muscle fibrosis in chronic muscle injury by promoting TNF-mediated apoptosis of fibro/adipogenic progenitors. Nat. Med. 21, 786–794 [DOI] [PubMed] [Google Scholar]
- 29.Decary S., Mouly V., Hamida C. B., Sautet A., Barbet J. P., Butler-Browne G. S. (1997) Replicative potential and telomere length in human skeletal muscle: implications for satellite cell-mediated gene therapy. Hum. Gene Ther. 8, 1429–1438 [DOI] [PubMed] [Google Scholar]
- 30.Collins M., Renault V., Grobler L. A., St Clair Gibson A., Lambert M. I., Wayne Derman E., Butler-Browne G. S., Noakes T. D., Mouly V. (2003) Athletes with exercise-associated fatigue have abnormally short muscle DNA telomeres. Med. Sci. Sports Exerc. 35, 1524–1528 [DOI] [PubMed] [Google Scholar]
- 31.Kadi F., Ponsot E., Piehl-Aulin K., Mackey A., Kjaer M., Oskarsson E., Holm L. (2008) The effects of regular strength training on telomere length in human skeletal muscle. Med. Sci. Sports Exerc. 40, 82–87 [DOI] [PubMed] [Google Scholar]
- 32.Rae D. E., Vignaud A., Butler-Browne G. S., Thornell L. E., Sinclair-Smith C., Derman E. W., Lambert M. I., Collins M. (2010) Skeletal muscle telomere length in healthy, experienced, endurance runners. Eur. J. Appl. Physiol. 109, 323–330 [DOI] [PubMed] [Google Scholar]
- 33.Ponsot E., Echaniz-Laguna A., Delis A. M., Kadi F. (2012) Telomere length and regulatory proteins in human skeletal muscle with and without ongoing regenerative cycles. Exp. Physiol. 97, 774–784 [DOI] [PubMed] [Google Scholar]
- 34.Rocheteau P., Gayraud-Morel B., Siegl-Cachedenier I., Blasco M. A., Tajbakhsh S. (2012) A subpopulation of adult skeletal muscle stem cells retains all template DNA strands after cell division. Cell 148, 112–125 [DOI] [PubMed] [Google Scholar]


