

Abstract
I-TASSER is a hierarchical protocol for automated protein structure prediction and structure-based function annotation. Starting from the amino acid sequence of target proteins, I-TASSER first generates full-length atomic structural models from multiple threading alignments and iterative structural assembly simulations followed by atomic-level structure refinement. The biological functions of the protein, including ligand-binding sites, enzyme commission number, and gene ontology terms, are then inferred from known protein function databases based on sequence and structure profile comparisons. I-TASSER is freely available as both an on-line server and a stand-alone package. This unit describes how to use the I-TASSER protocol to generate structure and function prediction and how to interpret the prediction results, as well as alternative approaches for further improving the I-TASSER modeling quality for distant-homologous and multi-domain protein targets.
Keywords: protein structure prediction, protein function annotation, I-TASSER, threading
INTRODUCTION
Proteins are the ‘workhorse’ molecules of life that participate in essentially every cellular process. The structure and function information of proteins thus provide important guidance for understanding the principles of life and developing new therapies to regulate life processes. Although many structural biology studies have been devoted to revealing protein structure and function, the experimental procedures are usually slow and expensive. While computational methods have the potential to create quick and large-scale structure and function models, accuracy and reliability are often a concern. Significant progress has been witnessed in the past two decades in computer-based structure predictions as measured by the community-wide blind CASP experiments (Moult, 2005; Kryshtafovych et al., 2014). One noticeable advance, for instance, is that automated computer servers can now generate models with accuracy comparable to the best human-expert modeling that combines a variety of manual inspections and structural and functional analyses (Battey et al., 2007; Huang et al., 2014). The I-TASSER protocol, built based on iterative fragment assembly simulations (Roy et al., 2010; Yang et al., 2015), represents one of the most successful methods demonstrated in CASP for automated protein structure and function predictions.
The details of the I-TASSER protocol have been described in several other publications (Wu et al., 2007; Zhang, 2007; Roy et al., 2010; Yang et al., 2015). A brief outline of the I-TASSER protocol is shown in Figure 5.8.1, which depicts three steps: structural template identification, iterative structure assembly, and structure-based function annotation. Starting from the amino acid sequence, I-TASSER first identifies homologous structure templates (or super-secondary structural segments if homologous templates are not available) from the PDB library (see UNIT 1.9; Dutta et al., 2007) using LOMETS (Wu and Zhang, 2007), a meta-threading algorithm that consists of multiple individual threading programs. The topology of the full-length models is then constructed by reassembling the continuously aligned fragment structures excised from the LOMETS templates and super-secondary structure segments, whereby the structures of the unaligned regions are created from scratch by ab initio folding based on replica-exchange Monte Carlo simulations (Zhang et al., 2003). The lowest-free-energy conformations are identified by SPICKER (Zhang and Skolnick, 2004b) through the clustering of the Monte Carlo simulation trajectories. Starting from the SPICKER clusters, a second round of structure reassembly is performed to refine the structural models, with the low free-energy conformations refined by full-atomic simulations using FG-MD (Zhang et al., 2011) and ModRefiner (Xu and Zhang, 2011).
Figure 5.8.1.
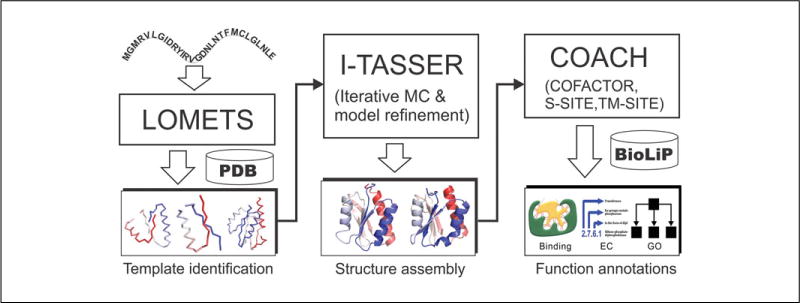
The I-TASSER protocol for protein structure and function prediction.
To derive the biological function of the target proteins, the I-TASSER models are matched with the proteins in the BioLiP library (Yang et al., 2013a), which is a semi-manually curated protein function database. Functional insights, including ligand binding, enzyme commission, and gene ontology, are inferred from the BioLiP templates that are ranked based on a composite scoring function combining global and local structural similarity, chemical feature conservation, and sequence profile alignments (Roy and Zhang, 2012; Yang et al., 2013b).
In this unit, we describe, through illustrative examples, how to use the I-TASSER protocol, how to interpret the structure and function prediction results, and how to further improve the I-TASSER modeling quality for difficult protein targets (in particular for the distant-homology and multi-domain proteins). The focus of this unit is on the online service system, where the standalone I-TASSER Suite (Yang et al., 2015) is also freely available to the academic institutions through http://zhanglab.ccmb.med.umich.edu/I-TASSER/download/.
USING THE I-TASSER SERVER
The only information required to run the online I-TASSER server is the amino acid sequence of the target protein. The predicted structure and biological function are presented in the form of a Web page, the URL address of which is sent to the users by e-mail after the job is completed. The steps for submitting a sequence to the I-TASSER server are described below.
Necessary Resources
Hardware
A personal computer with Internet access.
Software
A Web browser. To facilitate the management of modeling data and resource assignment, users are required to register their institutional e-mail address at http://zhanglab.ccmb.med.umich.edu/I-TASSER/registration.html. After the registration, a password is sent to the user, which allows the user to submit and manage his/her jobs.
Files
The minimum input to the server is the amino acid sequence of a protein in FASTA format (see APPENDIX 1B; Mills, 2014). The example file used in this protocol can be downloaded at http://zhanglab.ccmb.med.umich.edu/I-TASSER/example.fasta. Users can also provide additional insights regarding the target, including experimental restraints, specific template alignment, and secondary structure information, to assist the I-TASSER modeling.
Open a Web browser and go to the URL http://zhanglab.ccmb.med.umich.edu/I-TASSER/, which is the submission page of I-TASSER. Figure 5.8.2 illustrates the submission form of I-TASSER with an example sequence.
Copy and paste the amino acid sequence into the input box. Alternatively, the user can save the sequence in a file for upload by clicking on the Browse button.
Provide the registered e-mail address at which to receive the result, and its associated password.
-
If the user has prior knowledge or experimental information about the protein, e.g., contact/distance restraints, template information, or secondary structure restraints, he/she can provide this information by clicking on ‘Option I’ or ‘Option III’ on the Web page. In addition, for some special purposes (e.g., benchmark), the user may use ‘Option II’ to exclude some templates from the I-TASSER library. The file format for each option is described in detail in the corresponding sections of the submission page.
This step is optional.
Provide a name for the protein, which will be used as the subject line in the e-mail notification. By default, the name is set as your_protein if the user chooses to skip this step.
Choose whether to make the results private or public. By default, the modeling results of a job are made publicly available on the Queue page. If the user chooses to make the job private, a key, assigned to this job, will be needed to access the results of the job. The user can uncheck the box to change the job’s status.
Click on the Run I-TASSER button to submit the job. Upon submission, a job ID and a URL will be assigned to the user for tracking the modeling status.
Receive the modeling results by e-mail. For a protein with ~400 residues, it takes 10 to 24 hr to receive the complete set of modeling results after submission.
Figure 5.8.2.
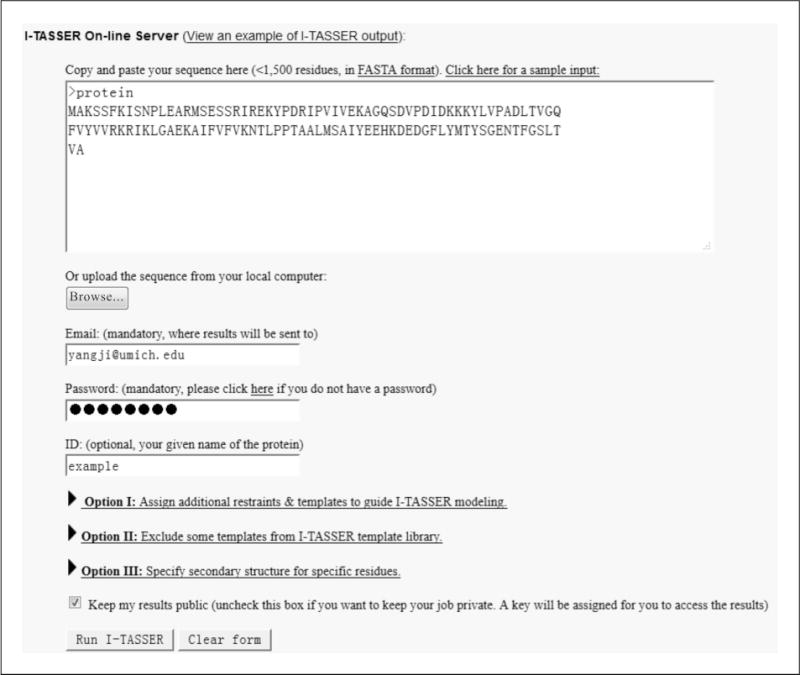
Screenshot of an illustrative job submission on the I-TASSER server.
GUIDELINES FOR UNDERSTANDING I-TASSER RESULTS
Once a job is completed, the user is notified by an e-mail message that contains the images of the predicted structures and a URL link where the complete result is deposited. Below we explain and discuss the modeling results of the I-TASSER server using the example of the protein sequence submitted in Figure 5.8.2. The anticipated output is summarized on a Web page, the items of which are discussed in the following sections in the order of their appearance on the Web page.
tar File
A tar file, containing the complete set of modeling results, can be downloaded from the link at the top of the page. Users are encouraged to download this file to store it permanently on their local computer, because jobs stored on the server for over 3 months will be deleted to save space. In addition, the files for the predicted structures and ligand-binding sites in PDB format are available after unzipping the tar file. The users can view the structures of these files with any professional molecular visualization software (e.g., PyMOL and RasMol; see UNIT 5.4; Goodsell, 2005) and draw customized figures for various purposes.
Summary of the Submitted Sequence
See Figure 5.8.3.
Figure 5.8.3.
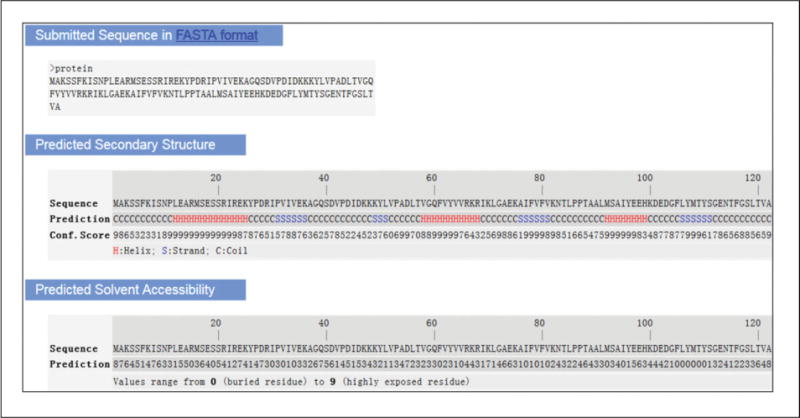
The submitted sequence and predicted secondary structure and solvent accessibility. The sequence submitted, consisting of 122 residues, is listed at the top of the figure. The predicted secondary structure shown at the middle suggests that this protein is an alpha-beta protein, which contains three alpha-helices (in red) and four beta-strands (in blue). “H,” “S,” and “C” indicate helix, strand, and coil, respectively. The predicted solvent accessibility at the bottom is presented in 10 levels, from buried (0) to highly exposed (9).
Predicted Secondary Structure
See Figure 5.8.3. The secondary structure is predicted based on sequence information from the PSSpred algorithm (Yang et al., 2015), which works by combing seven neural network predictors from different parameters and PSI-BLAST (Altschul et al., 1997) profile data.
Predicted Solvent Accessibility
See Figure 5.8.3. The solvent accessibility is predicted by the SOLVE program (Y. Zhang, unpublished).
Predicted Normalized B-Factor
See Figure 5.8.4. B-factor (also called temperature factor) is used to estimate the extent of atomic motion in the X-ray crystallography experiment. Because the distribution of the thermal motion factors in protein crystals can be affected by systematic errors such as experimental resolution, crystal contact, and refinement procedures, the raw B-factor values are usually not comparable between different experimental structures. Therefore, to reduce the influence, I-TASSER calculates a normalized B-factor with the Z-score-based transformation. The normalized B-factor is predicted by ResQ using a combination of template-based assignment and machine-learning-based prediction that employs sequence profile and predicted structural features (Yang et al., submitted).
Figure 5.8.4.
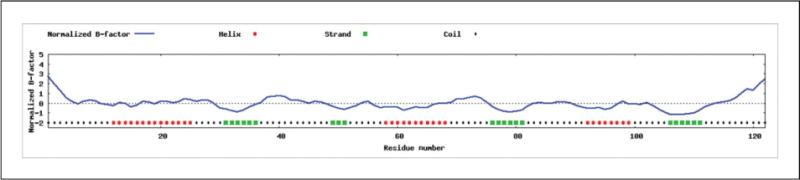
Prediction on the normalized B-factor. The regions at the N- and C-terminals and most of the loop regions are predicted with positive normalized B-factors in this example, indicating that these regions are structurally more flexible than other regions. On the other hand, the predicted normalized B-factors for the alpha and beta regions are negative or close to zero, suggesting these regions are structurally more stable.
The Top 10 Threading Templates and Alignments
See Figure 5.8.5. I-TASSER modeling starts from the structure templates identified by LOMETS (Wu and Zhang, 2007) from the PDB library. LOMETS is a meta-server threading approach containing multiple threading programs, where each threading program can generate tens of thousands of template alignments. I-TASSER only uses the templates of the highest significance in the threading alignments, the significance of which are measured by the Z-score, i.e., the difference between the raw and average scores in the unit of standard deviation. The templates in this section are the 10 best templates selected from the LOMETS threading programs. Although I-TASSER uses restraints from multiple templates, these 10 templates are the most relevant ones because they are given a higher weight in restraint collection and are used as the starting models in the low-temperature replicas in replica-exchange Monte Carlo simulations.
Figure 5.8.5.
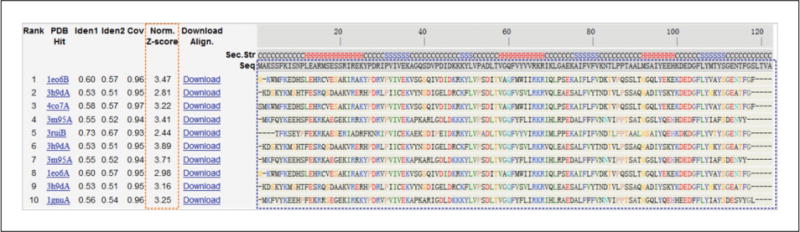
The top 10 threading templates used by I-TASSER. The Z-score, which has been widely used for estimating the significance and the quality of template alignments, equals the difference between the raw alignment score and the mean in units of standard deviation. However, since LOMETS contains templates from multiple threading programs where the Z-scores are not comparable between different programs, I-TASSER uses a normalized Z-score (highlighted by the orange box) to specify the quality of the template, which is defined as the Z-score divided by the program-specific Z-score cutoffs. Thus, a normalized Z-score >1 indicates an alignment with high confidence. In this example, because there are multiple templates with the normalized Z-score above 1, the target is categorized by I-TASSER as an ‘Easy’ target. The multiple alignments between the query and the templates are marked by the blue box, where the residue numbers of each template are available by clicking on the corresponding ‘Download’ link. It can be seen from the multiple sequence alignment that, except for a few residues at the N- and C- terminals of the query (i.e., aligned to gaps ‘-’), other residues are well aligned with templates. This usually indicates that there is a high level of conservation between the target and templates.
The Top-Ranked Structure Models with Global and Local Accuracy Estimations
See Figure 5.8.6. Up to five full-length structural models (Fig. 5.8.6A), together with the estimated global and local accuracy, are returned. The confidence of each structure model is estimated by the confidence score (C-score), that is defined by Equation 1:
| Equation 1 |
where M/Mtot is the number of structure decoys in the SPICKER cluster divided by the total number of decoys generated during the I-TASSER simulations. 〈RMSD〉 is the average RMSD of the decoys to the cluster centroid. Zi/Zcut,i is the normalized Z -score of the best template gene, rated by the ith LOMETS threading program. Our large-scale benchmark tests showed that the C-score defined in Equation 1 is highly correlated with the quality of the predicted models (with a Pearson correlation coefficient >0.9 to the TM-score relative to the native) (Zhang, 2008). The C-score is normally in [−5, 2] and a model of C-score >−1.5 usually has a correct fold, with TM-score >0.5. Here, TM-score is a sequence length-independent metric for measuring structure similarity with a value in the range [0, 1]. A TM score >0.5 generally corresponds to similar structures in the same SCOP/CATH fold family (Xu and Zhang, 2010).
Figure 5.8.6.
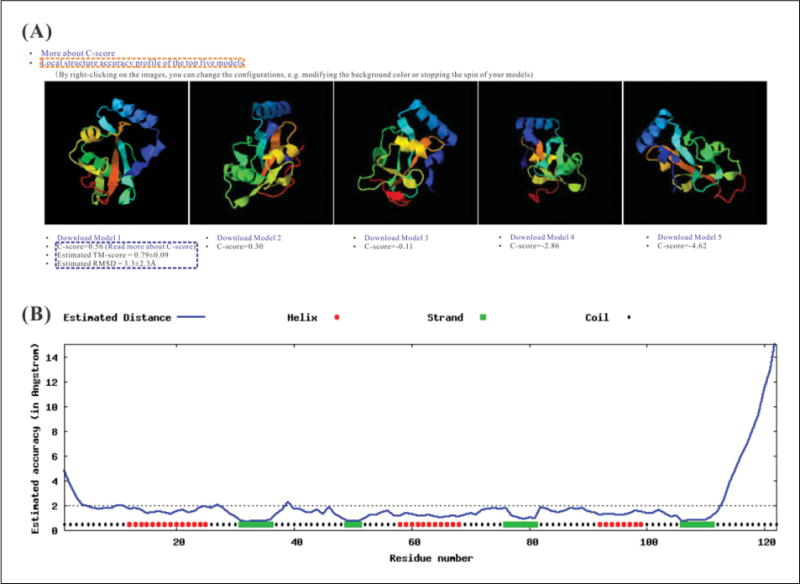
The top five models used I-TASSER, with global and local accuracy estimations. (A) The top five models. In this example, five models are generated and visualized in rainbow cartoon on the results page by JSmol, where blue to red runs from the N- to the C-terminals. Since the C-score is high (=0.56), the first model is expected to have good quality, with an estimated TM-score = 0.79 and RMSD = 3.3 Å relative to the native (highlighted in the blue box). The residue-specific accuracy estimation (in Å) for each model can be viewed by clicking on the link of the ‘Local structure accuracy profile of the top five models’ as highlighted in the orange box. (B) The local accuracy estimation for the first model. This example shows that the majority of residues in the model are modeled accurately, with estimated distance to native below 2 Å. However, the N- and C- terminal residues in the model are estimated with bigger distance, which is probably due to the poor alignments with templates for these residues, as shown in Figure 5.8.5.
In the case where the modeling simulations converge, there may be less than five models reported, which is usually an indication that the models have a relatively high confidence, because the I-TASSER simulations have a higher level of convergence.
In addition to the confidence score of the global structure model, I-TASSER also provides the local error estimation for each residue that is predicted by ResQ (Fig. 5.8.6B). The large-scale benchmark data shows that the average difference between estimated and observed distance errors of the structure models is 1.4 Å for the proteins with a C-score >−1.5 (Yang et al., submitted).
The Top 10 PDB Proteins with Similar Structures to the Target
See Figure 5.8.7. The first I-TASSER model is searched against the PDB library by TM-align (Zhang and Skolnick, 2005) to identify the analogs that are structurally similar to the query protein. Figure 5.8.7 shows the searching results of the example protein. Note that the proteins listed in Figure 5.8.5 and here can be different because they are detected by different methods; the former was detected by a sequence-based threading search while the latter was detected by structural alignment.
Figure 5.8.7.
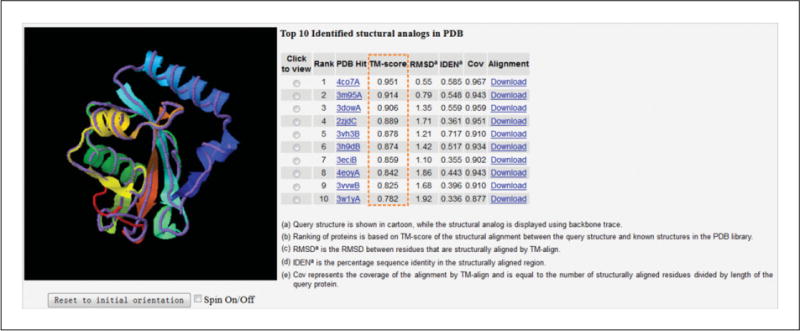
Ten PDB structures close to the target. The structure of the first I-TASSER model (model 1, shown in rainbow cartoon) is superimposed on the analogous structures from the PDB (shown in medium-purple backbone trace). The structural similarity between the target model and the 10 closest proteins are ranked by TM-scores, which are highlighted in the orange box. The coordinate file of the superimposed structures can be downloaded through the Download link for local visualization. In this example, there are multiple analogous structures from the PDB that have a high TM-score (>0.9), including 4co7A, 3m95A, and 3dowA. However, it is also possible that no similar structures can be found in the PDB; this usually indicates that the target protein is a new-fold protein or the fold by I-TASSER prediction is not correct.
Ligand-Binding Site Prediction
See Figure 5.8.8. The first I-TASSER model is submitted to the COACH algorithm (Yang et al., 2013b), which generates ligand binding-site predictions by matching the target models with proteins in the BioLiP database (Yang et al., 2013a). The functional templates are detected and ranked by COACH using a composite scoring function based on sequence and structure profile alignments. Figure 5.8.8 shows the structure of the functional template (left panel) and the predicted ligand binding sites (right panel). By clicking on the radio buttons, users can view ligand-binding sites from different functional templates.
Figure 5.8.8.
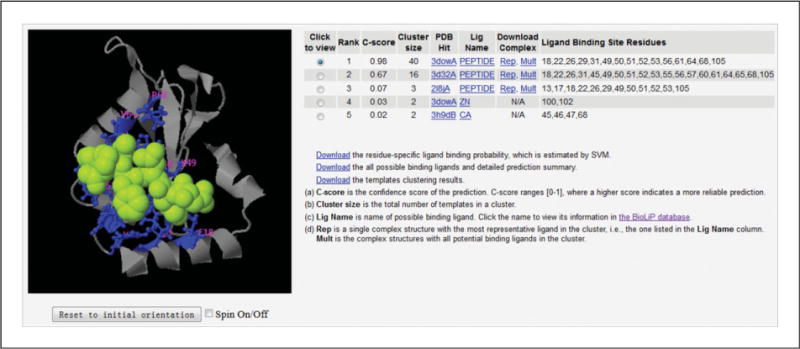
Illustration of ligand binding site prediction. The binding site prediction shown on the table is made by COACH, which combines the prediction results from five complementary algorithms of COFACTOR (Roy et al., 2012), TM-SITE, S-SITE (Yang et al., 2013b), FindSite (Brylinski and Skolnick, 2008), and ConCavity (Capra et al., 2009). The predicted binding ligand is highlighted in yellow-green spheres, with the corresponding binding residues shown as blue ball-and-stick illustrations in the picture of the 3-D model. In this example, the first functional template (PDB ID: 3dowA) has a high confidence score (C-score = 0.98) that it binds with a peptide ligand. Except for the predicted peptide, the protein can also bind to other ligands, which are available in a PDB file at the ‘Mult’ link. The ligands separated by ‘TER’ are put in the end of this file.
Enzyme Commission (EC) Number and Gene Ontology (GO) Term Prediction
Both EC and GO (UNIT 7.2; Blake and Harris, 2008) predictions are generated by CO-FACTOR (Roy et al., 2012), by global and local structural comparisons of the I-TASSER models with known proteins in the BioLiP function library. In Figure 5.8.9, the left panel shows the structure of the I-TASSER model and active sites, while the right panel shows the EC numbers and PDB IDs of the functional templates. Again, by clicking on the radio buttons, users can view results from different function templates.
Figure 5.8.9.
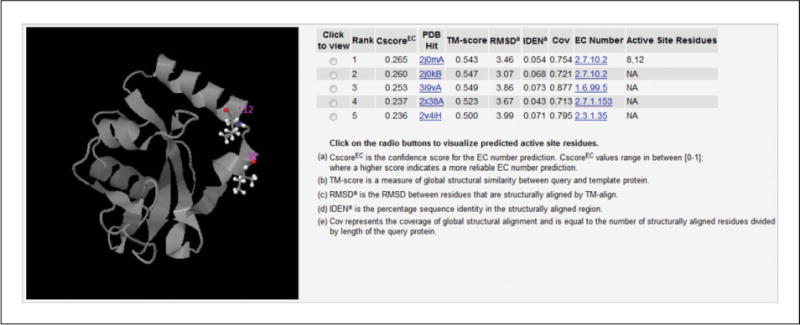
Illustration of enzyme commission (EC) number and active site predictions. In this example, the first model is predicted based on the template of PDB ID: 2j0mA, which is a nonspecific protein-tyrosine kinase with EC number 2.7.10.2. The predicted active-site residues are I8 and L12, shown in colored ball-and-sticks in the right column. Models from other templates can be found by clicking on the radio buttons.
Figure 5.8.10 shows results of GO predictions for the illustrative protein example. The upper panel shows the GO terms from the top 10 functional templates as ranked by the functional score (CscoreGO). The lower panel is the consensus of the GO terms from the top templates in the categories of molecular function, biological process, and cellular component.
Figure 5.8.10.
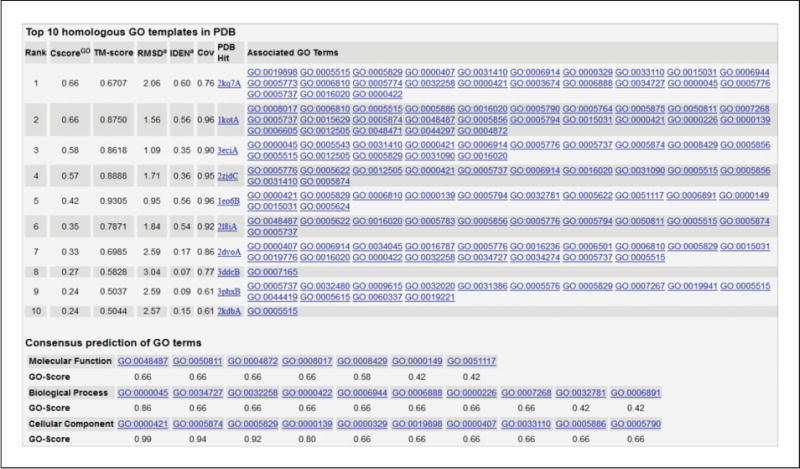
Illustration of gene ontology (GO) term prediction. The GO term predictions are presented in two parts. The first part lists the top 10 template proteins ranked by CscoreGO (Roy et al., 2012). The most frequently occurring GO terms in each of the three functional aspects (molecular function, biological process, and cellular component) are reconciled, with the consensus GO terms presented in the second part along with the confidence score for each predicted GO term (i.e., the ‘GO-Score’ in the table). In this example, the predicted top GO terms for the molecular function, biological process, and cellular component are beta-tubulin binding (GO:0048487), autophagosome assembly (GO:0000045), and autophagosome membrane (GO:0000421), respectively.
COMMENTARY
Background Information
Since the first establishment of the I-TASSER server in 2008 (Zhang, 2008), the server system has generated full-length structure models and function prediction for more than 200,000 proteins submitted by over 50,000 users from 118 countries. I-TASSER-based algorithms were extensively tested in both benchmark studies (Wu et al., 2007; Zhang et al., 2011; Roy et al., 2012; Yang et al., 2013b) and blind tests (Zhang, 2007; Zhang, 2009; Xu et al., 2011; Zhang, 2014). For the blind tests, I-TASSER participated in the community-wide CASP (Moult et al., 2014) and CAMEO (Haas et al., 2013) experiments for protein structure and function predictions. The I-TASSER protocol (with the group name “Zhang-Server”) was ranked as the top server for automated protein structure prediction in the 7th to 11th CASP competitions (Zhang, 2007; Zhang, 2009; Xu et al., 2011; Zhang, 2014). In CASP9, COFACTOR achieved a Matthews correlation coefficient of 0.69 for the ligand-binding site predictions of 31 targets, which was significantly higher than all other participating methods (Schmidt et al., 2011). In CAMEO (Haas et al., 2013), COACH generated ligand-binding site predictions for 5,531 targets (between December 7, 2012 and May 22, 2015) with an average AUC score of 0.85, which was more than 20% higher than the second best method in the experiment. These data suggest that the I-TASSER server represents one of the most robust algorithms for automated protein structure and function prediction.
Critical Parameters
Dealing with multi-domain proteins
I-TASSER has been designed (i.e., with the force field potential optimized) for modeling single-domain globular proteins. For proteins containing multiple domains, the predicted model may not be accurate, especially when homologous multi-domain templates do not exist in the template library. In this case, it is better to parse the protein sequence into individual domains and model their structures separately, which can sometime dramatically improve the model (e.g., C-score increases from <−1.5 to >0).
Users can use the ThreaDom server (Xue et al., 2013) to predict the domain boundary of the query sequence. If the server fails to predict domain boundaries, users can manually split the sequences based on inspection on the threading alignments. One principle of manual domain parsing is that if the residues of a long continuous region in the query are mostly aligned to gaps, the boundaries of such regions may be considered as candidates for domain boundaries. Another factor to consider is the domain structure of the template proteins that can be viewed by opening the PDB file of the templates using molecular visualization software. Figure 5.8.11 provides three typical cases of threading alignments from multiple domain proteins that most frequently occur in I-TASSER jobs. More complicated alignments may happen for big proteins (e.g., >1,000 residues), but a similar strategy can be used to parse the sequences into multiple domains.
Figure 5.8.11.
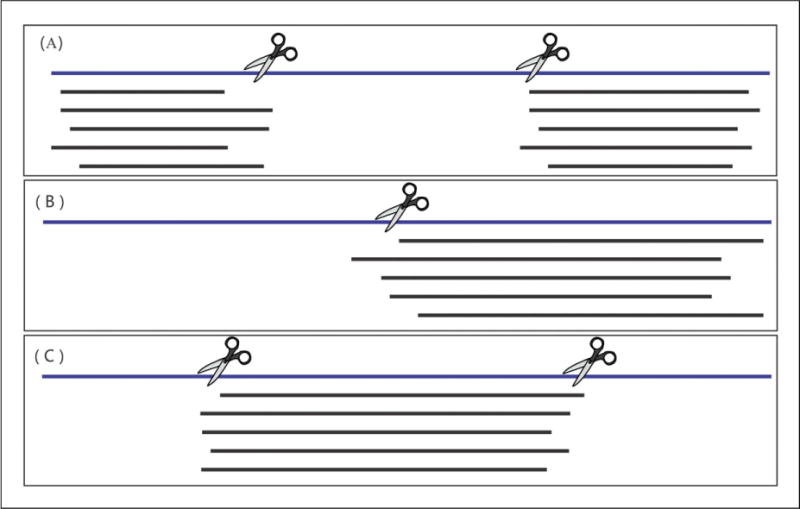
Illustration of domain parsing for multi-domain proteins. The query sequence is shown with a blue line, and the aligned template sequences from LOMETS are shown in black lines. Gaps in the template are blank. (A) The N- and C-terminal domains are well aligned with templates (indicating conserved domains), while the residues in the middle region are aligned to gaps (probably from another domain that is missed from the template). The sequence is parsed into three domains as shown by the two scissors. (B) The C-terminal domain is well aligned with multiple templates, while the residues in the N-terminal domain are aligned to gaps. The sequence is parsed into two putative domains, as shown by the scissor. (C) Only the residues in the middle region are well aligned with multiple templates. The sequence is parsed into three domains, as shown by the two scissors.
Dealing with proteins with long intrinsically disordered regions
In the current setting of I-TASSER, a query sequence is regarded as a structured protein by default. For proteins that include long intrinsically disordered regions, I-TASSER also attempts to build structure for these regions. However, these regions may degrade the quality of the overall models because of the additional cost of simulation time and the intervention with the structural clustering process. Therefore, it is suggested that users remove such residues from the query sequence before submitting the sequence. The disordered residues can be easily predicted with disorder predictors (Habchi et al., 2014).
Additional restraints
If users know of information about the structure of the modeled proteins, the information can be conveniently uploaded to the I-TASSER server. The I-TASSER server accepts three types of user-specified restraints: (1) inter-residue contact and distance restraints; (2) template structures and template-target alignments; (3) secondary structure assignments. The information can often significantly improve the quality of final structural and function predictions.
Troubleshooting
What can I do if the C-score of my model is low?
As a template-based structure and function prediction protocol, the quality of the models predicted by I-TASSER relies on the availability of template proteins in the PDB and the accuracy of threading alignments as generated by LOMETS (Wu and Zhang, 2007). Therefore, a prediction with a low C-score value usually indicates the lack of good templates in the protein structure library.
Several approaches can be used to improve the model quality in this situation.
Split multi-domain proteins and submit the individual domain sequences separately to I-TASSER. Since there are many more single-domain structures than complex structures in the PDB, domain parsing can improve the quality of template identification and therefore the quality of the final models (see Critical Parameters).
Remove intrinsically disordered regions to improve the sampling of structured regions (see Critical Parameters).
Submit non-homologous domain sequences to an ab initio folding service (e.g., QUARK; Xu and Zhang, 2012) that has been optimized for modeling protein structures from scratch.
Provide additional information from experimental or functional studies about the target protein. This information can be used by I-TASSER as restraints to guide the modeling simulations (see Advanced Parameters).
Why some lower-rank models have higher C-score?
We have found that the cluster size is more robust than the C-score for ranking the predicted models. The final I-TASSER models are therefore ranked based on cluster size rather than C-score in the output. Nevertheless, the C-score has a strong correlation with the quality of the final models, which has been used to quantitatively estimate the RMSD and TM-score of the final models relative to the native structure. Unfortunately, such strong correlation only occurs for the first predicted model from the largest cluster. Thus, the C-scores of the lower-ranked models (i.e., models 2 to 5) are listed only for reference, and a comparison among them is not advised. In other words, even though the lower-ranked models may have higher C-scores than the first models in some cases, the first model is on average the most reliable and should be considered unless there are special reasons (e.g., from biological knowledge or experimental data) for not doing so.
Why is the number of generated models less than five?
The I-TASSER server normally outputs five top structure models. There are some cases in which the number of final models is less than five. This is often because the top template alignments identified by LOMETS are very similar to each other, and the I-TASSER simulations converge. Therefore, the number of structure clusters is less than five (see Guidelines for Understanding Results). In these cases, the C-score is usually high, which indicates a high-quality structure prediction.
Can I submit a ligand together with the sequence?
As the current I-TASSER simulation does not take ligand information into account, ligand input is not allowed. However, if the user knows where the ligand binds to the target protein, he/she may submit the target sequence with distance/contact restraints because the residues binding to the ligand are usually close in space (see Advanced Parameters).
What is the best way for reporting my problem with I-TASSER?
To facilitate communication among users and/or between the user community and the I-TASSER team, a discussion board system has been established at http://zhanglab.ccmb.med.umich.edu/bbs. It is suggested that users first search through this message board to find answers from former discussions. They can also post new questions at the board, where some members will study and answer the questions as soon as possible. Since the open discussions can benefit more of our users, we encourage users to post their questions on the message board rather than contact individual team members via e-mail.
Advanced Parameters
When there is some experimental information about a target protein, such as cross-linking data, mutagenesis data, secondary structure information, and templates, users can provide these restraints information to guide I-TASSER simulation to improve the model quality using Options I and III at the homepage of I-TASSER server. Instructions and examples for preparing restraints files for are available at the submission page of the I-TASSER server (see also Critical Parameters).
Suggestions for Further Analysis
I-TASSER is a comprehensive pipeline designed for template-based protein structure and function predictions. There are other structure and function modeling facilities developed in the authors’ lab for specific modeling purposes. These include QUARK for ab initio protein structure modeling (Xu and Zhang, 2012), LOMETS (Wu and Zhang, 2007) and MUSTER (Wu and Zhang, 2008) for threading template identification, and GPCR-I-TASSER for modeling of G protein–coupled receptors (Zhang et al., 2015). For protein-protein complex structure modeling, users can first construct structure models for each monomer with I-TASSER and then construct complex models by docking the monomer models with docking software (Chen and Weng, 2002; Tovchigrechko and Vakser, 2005). Alternatively, users can submit the complex sequences to the SPRING (Guerler et al., 2013) and COTH (Mukherjee and Zhang, 2011) servers, which were developed for constructing complex models by multi-chain threading (Szilagyi and Zhang, 2014).
Meanwhile, there are a number of computer programs and Web servers that are developed in the community for protein structure prediction. A partial list of high-quality and widely used systems is presented in Table 5.8.1. These systems can be used as optional structure prediction approaches that are complementary to the I-TASSER protocol.
Table 5.8.1.
Frequently Used Resources for Protein Structure Prediction
| Name and URL | Note |
|---|---|
| I-TASSER http://zhanglab.ccmb.med.umich.edu/I-TASSER |
Hierarchal structure prediction by reassembling threading fragments based on replica-exchange Monte Carlo simulation (Yang and Zhang, 2015) |
| Rosetta http://robetta.bakerlab.org |
Ab initio structure prediction by assembling 3- and 9-mer fragments based on simulated annealing Monte Carlo simulation (Kim et al., 2004) |
| QUARK http://zhanglab.ccmb.med.umich.edu/QUARK |
Ab initio structure folding by assembling continuously distributed fragments based on replica-exchange Monte Carlo simulations (Xu and Zhang, 2012) |
| HHpred http://toolkit.tuebingen.mpg.de/hhpred |
Threading template identification based on hidden Markov model alignments (Soding et al., 2005) |
| Phyre2 http://www.sbg.bio.ic.ac.uk/phyre2 |
Threading template identification using profile-profile alignments (recent update uses HHpred) (Kelley et al., 2015) |
| GenThreader http://bioinf.cs.ucl.ac.uk/psipred |
Threading template identification based on profile-profile comparison (Buchan et al., 2010) |
| RaptorX http://raptorx.uchicago.edu |
Threading template identification using nonlinear alignment scores (Källberg et al., 2012) |
| FFAS http://ffas.burnham.org |
Threading template recognition by profile-profile alignment (Jaroszewski et al., 2005) |
| TASSER http://cssb.biology.gatech.edu/skolnick/webservice/TASSER/index.html |
Structure assembly from threading fragments based on Monte Carlo simulation (Zhang and Skolnick, 2004a; Zhou and Skolnick, 2007) |
| LOMETS http://zhanglab.ccmb.med.umich.edu/LOMETS |
Meta-threading server to identify structural templates using multiple threading programs (Wu and Zhang, 2007) |
| Modeller https://salilab.org/modeller |
Package for comparative structure modeling by satisfying spatial restraints (Sali and Blundell, 1993) |
| Swiss-Model http://swissmodel.expasy.org |
Homologous modeling server using templates from Blast and HHpred (Biasini et al., 2014) |
| CASP http://predictioncenter.org |
Platform for community-wide benchmark of protein structure prediction (Moult et al., 2014) |
| CAMEO http://cameo3d.org |
Platform for continuous evaluation of structure and function prediction methods (Haas et al., 2013) |
Acknowledgments
This project is supported in part by the NIGMS (GM083107 and GM084222), NSFC (Grant No. 11501306), and Nankai University start-up funding (Grant No. ZB15006103).
Literature Cited
- Altschul SF, Madden TL, Schaffer AA, Zhang J, Zhang Z, Miller W, Lipman DJ. Gapped BLAST and PSI-BLAST: A new generation of protein database search programs. Nucleic Acids Res. 1997;25:3389–3402. doi: 10.1093/nar/25.17.3389. [DOI] [PMC free article] [PubMed] [Google Scholar]
- Battey JN, Kopp J, Bordoli L, Read RJ, Clarke ND, Schwede T. Automated server predictions in CASP7. Proteins. 2007;69:68–82. doi: 10.1002/prot.21761. [DOI] [PubMed] [Google Scholar]
- Biasini M, Bienert S, Waterhouse A, Arnold K, Studer G, Schmidt T, Kiefer F, Cassarino TG, Bertoni M, Bordoli L, Schwede T. SWISS-MODEL: Modelling protein tertiary and quaternary structure using evolutionary information. Nucleic Acids Res. 2014;42:W252–258. doi: 10.1093/nar/gku340. [DOI] [PMC free article] [PubMed] [Google Scholar]
- Blake JA, Harris MA. The gene ontology (GO) project: Structured vocabularies for molecular biology and their application to genome and expression analysis. Curr Protoc Bioinformatics. 2008;23(7.2):7.2.1–7.2.9. doi: 10.1002/0471250953.bi0702s23. [DOI] [PubMed] [Google Scholar]
- Brylinski M, Skolnick J. A threading-based method (FINDSITE) for ligand-binding site prediction and functional annotation. Proc Natl Acad Sci USA. 2008;105:129–134. doi: 10.1073/pnas.0707684105. [DOI] [PMC free article] [PubMed] [Google Scholar]
- Buchan DW, Ward SM, Lobley AE, Nugent TC, Bryson K, Jones DT. Protein annotation and modelling servers at University College London. Nucleic Acids Res. 2010;38:W563–568. doi: 10.1093/nar/gkq427. [DOI] [PMC free article] [PubMed] [Google Scholar]
- Capra JA, Laskowski RA, Thornton JM, Singh M, Funkhouser TA. Predicting protein ligand binding sites by combining evolutionary sequence conservation and 3D structure. PLoS Comput Biol. 2009;5:e1000585. doi: 10.1371/journal.pcbi.1000585. [DOI] [PMC free article] [PubMed] [Google Scholar]
- Chen R, Weng Z. Docking unbound proteins using shape complementarity, desolvation, and electrostatics. Proteins. 2002;47:281–294. doi: 10.1002/prot.10092. [DOI] [PubMed] [Google Scholar]
- Dutta S, M Berman H, F Bluhm W. Using the tools and resources of the RCSB protein data bank. Curr Protoc Bioinformatics. 2007;20(1.9):1.9.1–1.9.24. doi: 10.1002/0471250953.bi0109s20. [DOI] [PubMed] [Google Scholar]
- Goodsell DS. Representing structural information with RasMol. Curr Protoc Bioinformatics. 2005;11(5.4):5.4.1–5.4.23. doi: 10.1002/0471250953.bi0504s11. [DOI] [PubMed] [Google Scholar]
- Guerler A, Govindarajoo B, Zhang Y. Mapping monomeric threading to protein-protein structure prediction. J Chem Inf Model. 2013;53:717–725. doi: 10.1021/ci300579r. [DOI] [PMC free article] [PubMed] [Google Scholar]
- Haas J, Roth S, Arnold K, Kiefer F, Schmidt T, Bordoli L, Schwede T. The protein model portal-a comprehensive resource for protein structure and model information. Database (Oxford) 2013;2013:bat031. doi: 10.1093/database/bat031. [DOI] [PMC free article] [PubMed] [Google Scholar]
- Habchi J, Tompa P, Longhi S, Uversky VN. Introducing protein intrinsic disorder. Chem Rev. 2014;114:6561–6588. doi: 10.1021/cr400514h. [DOI] [PubMed] [Google Scholar]
- Huang YJ, Mao B, Aramini JM, Montelione GT. Assessment of template-based protein structure predictions in CASP10. Proteins. 2014;82:43–56. doi: 10.1002/prot.24488. [DOI] [PMC free article] [PubMed] [Google Scholar]
- Jaroszewski L, Rychlewski L, Li Z, Li W, Godzik A. FFAS03: A server for profile-profile sequence alignments. Nucleic Acids Res. 2005;33:W284–W288. doi: 10.1093/nar/gki418. [DOI] [PMC free article] [PubMed] [Google Scholar]
- Källberg M, Wang H, Wang S, Peng J, Wang Z, Lu H, Xu J. Template-based protein structure modeling using the RaptorX web server. Nat Protoc. 2012;7:1511–1522. doi: 10.1038/nprot.2012.085. [DOI] [PMC free article] [PubMed] [Google Scholar]
- Kelley LA, Mezulis S, Yates CM, Wass MN, Sternberg MJ. The Phyre2 web portal for protein modeling, prediction and analysis. Nat Protoc. 2015;10:845–858. doi: 10.1038/nprot.2015.053. [DOI] [PMC free article] [PubMed] [Google Scholar]
- Kim DE, Chivian D, Baker D. Protein structure prediction and analysis using the Robetta server. Nucleic Acids Res. 2004;32:W526–531. doi: 10.1093/nar/gkh468. [DOI] [PMC free article] [PubMed] [Google Scholar]
- Kryshtafovych A, Fidelis K, Moult J. CASP10 results compared to those of previous CASP experiments. Proteins. 2014;82:164–174. doi: 10.1002/prot.24448. [DOI] [PMC free article] [PubMed] [Google Scholar]
- Mills L. Common file formats. Curr Protoc Bioinformatics. 2014;1(1B):A.1B.1–A.1B.18. doi: 10.1002/0471250953.bia01bs45. [DOI] [PubMed] [Google Scholar]
- Moult J. A decade of CASP: Progress, bottlenecks and prognosis in protein structure prediction. Curr Opin Struct Biol. 2005;15:285–289. doi: 10.1016/j.sbi.2005.05.011. [DOI] [PubMed] [Google Scholar]
- Moult J, Fidelis K, Kryshtafovych A, Schwede T, Tramontano A. Critical assessment of methods of protein structure prediction (CASP)-round x. Proteins. 2014;82:1–6. doi: 10.1002/prot.24452. [DOI] [PMC free article] [PubMed] [Google Scholar]
- Mukherjee S, Zhang Y. Protein-protein complex structure predictions by multimeric threading and template recombination. Structure. 2011;19:955–966. doi: 10.1016/j.str.2011.04.006. [DOI] [PMC free article] [PubMed] [Google Scholar]
- Roy A, Zhang Y. Recognizing protein-ligand binding sites by global structural alignment and local geometry refinement. Structure. 2012;20:987–997. doi: 10.1016/j.str.2012.03.009. [DOI] [PMC free article] [PubMed] [Google Scholar]
- Roy A, Kucukural A, Zhang Y. I-TASSER: A unified platform for automated protein structure and function prediction. Nat Protoc. 2010;5:725–738. doi: 10.1038/nprot.2010.5. [DOI] [PMC free article] [PubMed] [Google Scholar]
- Roy A, Yang J, Zhang Y. CO-FACTOR: An accurate comparative algorithm for structure-based protein function annotation. Nucleic Acids Res. 2012;40:W471–477. doi: 10.1093/nar/gks372. [DOI] [PMC free article] [PubMed] [Google Scholar]
- Sali A, Blundell TL. Comparative protein modelling by satisfaction of spatial restraints. J Mol Biol. 1993;234:779–815. doi: 10.1006/jmbi.1993.1626. [DOI] [PubMed] [Google Scholar]
- Schmidt T, Haas J, Cassarino TG, Schwede T. Assessment of ligand-binding residue predictions in CASP9. Proteins. 2011;79:126–136. doi: 10.1002/prot.23174. [DOI] [PMC free article] [PubMed] [Google Scholar]
- Soding J, Biegert A, Lupas AN. The HHpred interactive server for protein homology detection and structure prediction. Nucleic Acids Res. 2005;33:W244–248. doi: 10.1093/nar/gki408. [DOI] [PMC free article] [PubMed] [Google Scholar]
- Szilagyi A, Zhang Y. Template-based structure prediction of protein-protein interactions. Curr Opin Struc Biol. 2014;24:10–23. doi: 10.1016/j.sbi.2013.11.005. [DOI] [PMC free article] [PubMed] [Google Scholar]
- Tovchigrechko A, Vakser IA. Development and testing of an automated approach to protein docking. Proteins. 2005;60:296–301. doi: 10.1002/prot.20573. [DOI] [PubMed] [Google Scholar]
- Wu S, Zhang Y. LOMETS: A local meta-threading-server for protein structure prediction. Nucl Acids Res. 2007;35:3375–3382. doi: 10.1093/nar/gkm251. [DOI] [PMC free article] [PubMed] [Google Scholar]
- Wu S, Zhang Y. MUSTER: Improving protein sequence profile-profile alignments by using multiple sources of structure information. Proteins. 2008;72:547–556. doi: 10.1002/prot.21945. [DOI] [PMC free article] [PubMed] [Google Scholar]
- Wu S, Skolnick J, Zhang Y. Ab initio modeling of small proteins by iterative TASSER simulations. BMC Biol. 2007;5:17. doi: 10.1186/1741-7007-5-17. [DOI] [PMC free article] [PubMed] [Google Scholar]
- Xu J, Zhang Y. How significant is a protein structure similarity with TM-score =0.5? Bioinformatics. 2010;26:889–895. doi: 10.1093/bioinformatics/btq066. [DOI] [PMC free article] [PubMed] [Google Scholar]
- Xu D, Zhang Y. Improving the physical realism and structural accuracy of protein models by a two-step atomic-level energy minimization. Biophys J. 2011;101:2525–2534. doi: 10.1016/j.bpj.2011.10.024. [DOI] [PMC free article] [PubMed] [Google Scholar]
- Xu D, Zhang Y. Ab initio protein structure assembly using continuous structure fragments and optimized knowledge-based force field. Proteins. 2012;80:1715–1735. doi: 10.1002/prot.24105. [DOI] [PMC free article] [PubMed] [Google Scholar]
- Xu D, Zhang J, Roy A, Zhang Y. Automated protein structure modeling in CASP9 by I-TASSER pipeline combined with QUARK-based ab initio folding and FG-MD-based structure refinement. Proteins. 2011;79:147–160. doi: 10.1002/prot.23111. [DOI] [PMC free article] [PubMed] [Google Scholar]
- Xue Z, Xu D, Wang Y, Zhang Y. ThreaDom: Extracting protein domain boundary information from multiple threading alignments. Bioinformatics. 2013;29:i247–i256. doi: 10.1093/bioinformatics/btt209. [DOI] [PMC free article] [PubMed] [Google Scholar]
- Yang J, Zhang Y. I-TASSER server: New development for protein structure and function predictions. Nucleic Acids Res. 2015;43:W174–181. doi: 10.1093/nar/gkv342. [DOI] [PMC free article] [PubMed] [Google Scholar]
- Yang J, Roy A, Zhang Y. BioLiP: A semi-manually curated database for biologically relevant ligand-protein interactions. Nucleic Acids Res. 2013a;41:D1096–1103. doi: 10.1093/nar/gks966. [DOI] [PMC free article] [PubMed] [Google Scholar]
- Yang J, Roy A, Zhang Y. Protein-ligand binding site recognition using complementary binding-specific substructure comparison and sequence profile alignment. Bioinformatics. 2013b;29:2588–2595. doi: 10.1093/bioinformatics/btt447. [DOI] [PMC free article] [PubMed] [Google Scholar]
- Yang J, Yan R, Roy A, Xu D, Poisson J, Zhang Y. The I-TASSER Suite: Protein structure and function prediction. Nat Meth. 2015;12:7–8. doi: 10.1038/nmeth.3213. [DOI] [PMC free article] [PubMed] [Google Scholar]
- Zhang Y. Template-based modeling and free modeling by I-TASSER in CASP7. Proteins. 2007;69:108–117. doi: 10.1002/prot.21702. [DOI] [PubMed] [Google Scholar]
- Zhang Y. I-TASSER server for protein 3D structure prediction. BMC Bioinformatics. 2008;9:40. doi: 10.1186/1471-2105-9-40. [DOI] [PMC free article] [PubMed] [Google Scholar]
- Zhang Y. I-TASSER: Fully automated protein structure prediction in CASP8. Proteins. 2009;77:100–113. doi: 10.1002/prot.22588. [DOI] [PMC free article] [PubMed] [Google Scholar]
- Zhang Y. Interplay of I-TASSER and QUARK for template-based and ab initio protein structure prediction in CASP10. Proteins. 2014;82:175–187. doi: 10.1002/prot.24341. [DOI] [PMC free article] [PubMed] [Google Scholar]
- Zhang Y, Skolnick J. Automated structure prediction of weakly homologous proteins on a genomic scale. Proc Natl Acad Sci USA. 2004a;101:7594–7599. doi: 10.1073/pnas.0305695101. [DOI] [PMC free article] [PubMed] [Google Scholar]
- Zhang Y, Skolnick J. SPICKER: A clustering approach to identify near-native protein folds. J Comput Chem. 2004b;25:865–871. doi: 10.1002/jcc.20011. [DOI] [PubMed] [Google Scholar]
- Zhang Y, Skolnick J. TM-align: A protein structure alignment algorithm based on the TM-score. Nucleic Acids Res. 2005;33:2302–2309. doi: 10.1093/nar/gki524. [DOI] [PMC free article] [PubMed] [Google Scholar]
- Zhang Y, Kolinski A, Skolnick J. TOUCHSTONE II: A new approach to ab initio protein structure prediction. Biophys J. 2003;85:1145–1164. doi: 10.1016/S0006-3495(03)74551-2. [DOI] [PMC free article] [PubMed] [Google Scholar]
- Zhang J, Liang Y, Zhang Y. Atomic-level protein structure refinement using fragment-guided molecular dynamics conformation sampling. Structure. 2011;19:1784–1795. doi: 10.1016/j.str.2011.09.022. [DOI] [PMC free article] [PubMed] [Google Scholar]
- Zhang J, Yang J, Jang R, Zhang Y. GPCR-I-TASSER: A hybrid approach to G protein-coupled receptor structure modeling and the application to the human genome. Structure. 2015;23:1538–1549. doi: 10.1016/j.str.2015.06.007. submitted. [DOI] [PMC free article] [PubMed] [Google Scholar]
- Zhou HY, Skolnick J. Ab initio protein structure prediction using Chunk-TASSER. Biophys J. 2007;93:1510–1518. doi: 10.1529/biophysj.107.109959. [DOI] [PMC free article] [PubMed] [Google Scholar]