

Abstract
Circadian rhythms regulate bodily functions within 24 h and long-term disruptions in these rhythms can cause various diseases. Recently, the peripheral auditory organ, the cochlea, has been shown to contain a self-sustained circadian clock that regulates differential sensitivity to noise exposure throughout the day. Animals exposed to noise during the night are more vulnerable than when exposed during the day. However, whether other structures throughout the auditory pathway also possess a circadian clock remains unknown. Here, we focus on the inferior colliculus (IC), which plays an important role in noise-induced pathologies such as tinnitus, hyperacusis, and audiogenic seizures. Using PER2::LUC transgenic mice and real-time bioluminescence recordings, we revealed circadian oscillations of Period 2 protein in IC explants for up to 1 week. Clock genes (Cry1, Bmal1, Per1, Per2, Rev-erbα, and Dbp) displayed circadian molecular oscillations in the IC. Averaged expression levels of early-induced genes and clock genes during 24 h revealed differential responses to day or night noise exposure. Rev-erbα and Dbp genes were affected only by day noise exposure, whereas Per1 and Per2 were affected only by night noise exposure. However, the expression of Bdnf was affected by both day and night noise exposure, suggesting that plastic changes are unlikely to be involved in the differences in day or night noise sensitivity in the IC. These novel findings highlight the importance of circadian responses in the IC and emphasize the importance of circadian mechanisms for understanding central auditory function and disorders.
SIGNIFICANCE STATEMENT Recent findings identified the presence of a circadian clock in the inner ear. Here, we present novel findings that neurons in the inferior colliculus (IC), a central auditory relay structure involved in sound processing, express a circadian clock as evidenced at both the mRNA and protein levels. Using a reporter mouse that expresses a luciferase protein coupled to the core clock protein PERIOD2 (PER2::LUC), we could observe spontaneous circadian oscillations in culture. Furthermore, we reveal that the mRNA profile of clock-related genes in the IC is altered differentially by day or night noise exposure. The identification of a clock in the IC is relevant for understanding the mechanisms underlying dysfunctions of the IC such as tinnitus, hyperacusis, or audiogenic seizures.
Keywords: circadian rhythm, clock genes, inferior colliculus, noise exposure
Introduction
Circadian rhythms regulate physiological functions such as behavior, food intake, energy metabolism, sleep, reproduction, immune responses, and hearing (Dibner et al., 2010; Meltser et al., 2014). The 24 h light/dark cycle is a major external timing cue that entrains the master clock of the body, the suprachiasmatic nucleus (SCN) (Bass and Takahashi, 2010). An important function of the SCN is to synchronize other clocks in the brain and peripheral tissues (Dibner et al., 2010). In individual cells, there is a rhythmic expression of core clock genes having a 24 h period that is generated by transcriptional–translational feedback loops (Partch et al., 2014). In turn, synchronization of these individual oscillators results in the coordinated function of the organ at specific times of the day (Albrecht, 2012). The core feedback loop that controls the central and peripheral clockwork circuitry consists of four transcriptional repressor-encoding genes (Per1, Per2, Cry1, and Cry2) that are regulated by the BMAL1-CLOCK complex. This complex is then inhibited by the negative PER and CRY regulators, thereby suppressing their own transcription. A secondary loop incorporates REV-ERBs, which inhibit Bmal1 transcription in a circadian manner. Together, these self-regulated feedback loops yield a 24 h cycle. These core clock elements are necessary for the generation and maintenance of circadian rhythms and their disruption leads to a number of metabolic and physiological disorders in living organisms (Son et al., 2011).
Recently, the function of the peripheral auditory organ was shown to be regulated by circadian mechanisms (Meltser et al., 2014). In that study, the adult mouse cochlea was found to possess a self-sustained circadian clock that alters cochlear sensitivity to noise at different times of the day. Noise exposure during the active phase (night) caused greater hearing loss compared with exposure during the inactive phase (day). Whether central auditory structures are regulated by circadian rhythms and differentially affected by day or night noise exposure needs to be determined. The inferior colliculus (IC), which is located in the midbrain, is an interesting candidate for evaluating the presence of a circadian clock because it plays an important role in auditory function. Dysfunction in the IC is closely related to a number of pathophysiological conditions such as noise-induced hearing loss (NIHL), age-related hearing loss, tinnitus, hyperacusis, and audiogenic seizures. Relevant to the context of NIHL, many studies have shown that hyperactivity occurs in IC after excessive noise exposure (Salvi et al., 1990; Wang et al., 2002; Berger et al., 2014; Berger and Coomber, 2015).
The IC is the initiation site for audiogenic seizures in rat models. Direct stimulation of the IC can increase susceptibility to noise in the genetically epilepsy-prone rat-9 (GEPR-9) (Faingold et al., 1992). Interestingly, greater susceptibility to audiogenic seizures is found in mice lacking three circadian genes from the PAR bZip (proline and acidic amino acid-rich basic leucine zipper) family of basic region leucine zipper proteins, namely Dbp (albumin site D-binding protein), Hlf (Hepatic leukemia factor), and Tef (thyrotroph embryonic factor) (Gachon et al., 2004). Audiogenic seizures induced by sound stimulation at night result in an increased number of mice showing convulsions and death compared with day stimulation (Halberg et al., 1958). Collectively, these findings suggest that the IC is regulated by a circadian clock, which could alter the sensitivity of the IC to auditory signals at different times of the day.
Here, we sought to evaluate the presence of circadian regulation in the IC and its response to noise exposure delivered either during the day or the night. We reveal that the IC harbors a circadian clock and a network of circadian genes that are modulated by noise exposure. The present study suggests a circadian contribution of the IC in the day/night sensitivity to noise exposure.
Materials and Methods
Animals.
All experimental procedures on animals were performed in accordance with the guidelines and regulations set forth by Karolinska Institutet and Stockholm's Norra Djurförsöksetiska Nämnd. Recordings of circadian oscillations of the PER2 protein were performed using tissues obtained from knock-in PERIOD2::LUCIFERASE (PER2::LUC) transgenic mice with a C57/B6 background (Yoo et al., 2004). CBA/CaJ male mice aged between 2 and 4 months were used for audiological, morphological, and molecular experiments. Animals had ad libitum access water and to food (Lactamin R34; Lantmännen). Temperature was maintained between 19°C and 21°C and lights were on at 6:00 A.M. and off at 6:00 P.M. Zeitgeber time (ZT) 0 is here defined as lights on, corresponding to 6:00 A.M. Handling at ZT 13–16 (darkness) was performed using red light.
Organotypic cultures.
Isolated ICs from PER2::LUC mice (6–8 weeks of age) were cultured as described previously (Yamazaki et al., 2000; Johansson et al., 2011; Savelyev et al., 2011). The whole IC from both sides was dissected from male and female mouse brains and placed on a membrane (Millipore, PICMORG50). Whole ICs were kept in culture for a minimum of 4 d. In other experiments, the ICs were sectioned from brains (only from males) in cold HBSS using a vibratome and coronal sections of the IC were obtained with a thickness of 250 μm. Sections were cultured on a membrane and kept for a minimum of 3 d. Real-time luciferase reporter technology was used as described previously (Yamazaki et al., 2000; Savelyev et al., 2011). PER2::LUC rhythms (period, amplitude, and phase) were analyzed using Origin software 8.1 SR1 (Microcal Software). Data from each recording trace was first normalized by subtracting the 24 h baseline drift from the raw data. The amplitude was calculated as the difference between highest (peak) and lowest (trough) photon count within one cycle. The calculation was performed from trough-to-peak and from the peak-to-trough, thus giving two values (half-cycles) within one cycle. For each amplitude data point, 3 half-cycles (1.5 cycles) were used for amplitude analyses. The very first peak after culture start was not used. Phase was determined as maximum (peak) luminescence between 24 and 48 h (peak between day 1 and 2) after the start of the PER2::LUC recording of the tissue. The average peak time of each treatment group (day noise, night noise) was calculated and compared statistically with the respective sham group (day sham, night sham). The period of one complete cycle was defined as the time between two consecutive peaks (i.e., the highest photon count within one cycle) and five consecutive peaks were used for averaging periods. Samples with oscillations that decayed too fast and did not allow quantification of five consecutive peaks were excluded from the analysis. IC sections were treated with 16 μm forskolin (F6886, diluted in DMSO; Sigma-Aldrich) used as a synchronizing agent at ZT 3. Increased amplitude was calculated from the amplitude difference between 1.5 cycles before forskolin treatment and 1.5 cycles after treatment.
Noise exposure and auditory brainstem response (ABR).
Awake CBA and PER2::LUC mice were exposed to a free-field band-limited noise at 6–12 kHz at intensity of 100 dB SPL for 1 h either at 9:00 A.M. (ZT 3) or at 9:00 P.M. (ZT 15) similar to a previously described noise trauma paradigm (Meltser et al., 2010). The auditory threshold shifts at the 6, 12, 16, and 24 kHz frequencies deriving from these day and night noise traumas have been assessed by ABRs (Meltser et al., 2014).
Locomotor activity during noise exposure.
To assess the locomotor activity during noise exposure, awake CBA mice (n = 3 and 4 at ZT 3 and ZT 9, respectively) were individually monitored in a chamber from the Comprehensive Laboratory Animal Monitoring System (CLAMS; Columbus Instruments) during noise exposure (100 dB, 6–12 kHz narrow band white noise for 1 h). The loud speaker was placed immediately above the chamber and each chamber (11.1 × 21.6 × 13.7 cm) was equipped with infrared beam activity sensors. Animal movements in the horizontal (X and Y planes) and the vertical (Z plane) directions break the infrared beams, allowing for locomotor activity to be quantified. The sum of any beam breakage in the horizontal or vertical direction was recorded as total activity counts (XTOT, YTOT, or ZTOT, respectively).
Immunocytochemistry.
For immunostaining of PER2 and c-Fos, animals underwent transcardiac perfusion with 4% paraformaldehyde and brains were cryosectioned at 14 μm thickness. Sections from animals (n = 3–4 per condition) were immunostained with rabbit antibodies to PER2 (1:100; PER21-A; Alpha Diagnostic) and rabbit antibodies to c-Fos (1:250; Cell Signaling Technology). After rinsing in PBS containing 0.2% Triton X-100, sections were incubated with biotinylated goat anti-rabbit antibodies (Vector Laboratories) and the avidin/biotin system (Vector Laboratories) and visualized using 3, 3′-diaminobenzidine solution. Negative controls were performed by omitting the primary antibody, yielding no staining. Images were obtained using DP Controller software (Olympus). The number of c-Fos-immunopositive nuclei in the central nucleus of IC (CIC) was counted automatically using Image-Pro Plus 6.2 software (Media Cybernetics). For the quantification of c-Fos, the central nucleus was analyzed in the region between −5.02 mm and −5.20 mm, which is located caudally from the bregma along the rostrocaudal axis (Paxinos and Franklin, 2007). For the qualitative evaluation of PER2, the region between −4.86 mm and −5.34 mm was evaluated. Cells >10 μm were counted. Counterstaining with hematoxylin QS (H-3404; Vector Laboratories) was performed to identify the subdivisions of the IC. These assessments were performed in a blinded manner by two researchers. When immunohistochemistry was performed, samples from all conditions were processed at the same time.
Quantitative evaluation of mRNA transcripts.
NanoString nCounter measures of mRNA transcript abundance has been validated against SybrGreen qRT-PCR assays in previous work on bacteria (r = 0.98–0.99; Beaume et al., 2011) and in the cochlea (r = 0.9826 for Per2 transcripts around the clock; Vikhe Patil et al., 2015). CBA male mice were kept in darkness for 3 consecutive days before exposure to either silence or sound (100 dB, 6–12 kHz narrow band white noise for 1 h). Animals were decapitated under isoflurane anesthesia and ICs were collected. The samples collected here originate from the same animals for which RNA transcript profiles from the cochlea have been described previously (Meltser et al., 2014). Total RNA was extracted from the tissues using the Direct-zol RNA MiniPrep kit from ZymoResearch according to the manufacturer's protocol and was immediately followed by DNase I treatment (Invitrogen). RNA integrity was assessed using RNA 6000 nanochips with an Agilent 2100 bioanalyzer and quantity was evaluated with Nanodrop as described previously (Vikhe Patil et al., 2015). NanoString nCounter assays were performed with 100 ng of total RNA from adult IC collected every 4 h around the clock and processed according to published procedures (Geiss et al., 2008). Probes for the analysis of 25 genes (Table 1) were synthesized by Nanostring Technologies. After probe hybridizations and Nanostring nCounter digital reading, counts for each RNA species were extracted, analyzed using a homemade Excel macro, and then expressed as counts (molecules of mRNA/sample; Beaume et al., 2011). Barcodes were counted for 1150 fields of view per sample. Background correction was done by subtracting the mean ±2 SDs of the negative controls for each sample. Values <1 were fixed to 1. The nCounter CodeSet contained two types of built-in controls: positive controls (spiked RNA at various concentrations to assess the overall assay performance) and negative controls (alien probes for background calculation). Data handling and analysis was performed as described: background correction consisted of the subtraction of the negative control average plus 2 SDs from the original counts. To select adequate normalization genes from a series of candidates included in the CodeSet, their relative stability was evaluated using the geNorm method (Vandesompele et al., 2002). For the final normalization of the sample values, the geometric mean of the counts obtained for the selected normalization genes was calculated and used as normalization factor. Fold changes were calculated from the quotient of means of these normalized quantities and reported as ± SEM.
Table 1.
Target sequences for probes used in the NanoString analysis
| Gene name | Accession no. | Target sequence |
|---|---|---|
| Per1 | NM_011065.4 | CAGCTAGACTCCATTTTGGGGCCGCTTACAGCAGTCTAATGAGAGGCTTCCTTTCGACCATGTTGGGGTTCTTATAACTCAAGATACAGCTGGACCAACC |
| Per2 | NM_011066.3 | TGTAAATAAGCTCTCAGAGTTTGTGCGATGATGATTCGTGAGCCTTGCCGGACAAGAGGTTTGTTCATGCGCAAACCAAACGTACCTTCACCCAGTGCAA |
| Cry1 | NM_007771.3 | CGTGGAAGTCATCGTGCGCATTTCACATACACTGTATGACCTGGACAAGATCATAGAACTCAATGGCGGACAGCCACCTCTAACATATAAAAGGTTTCAG |
| Clock | NM_007715.5 | GTGTTGGTAGCTTTAGTGGGTCTGTGCCTGCATCAAATATTACAGAGGGCACACCACTGCCAGGGGTTTGCTTAGAATGCCATGAAGATAGTCCAGTAGT |
| Bmal1 | NM_007489.3 | CGGGTGAAATCTATGGAGTACGTTTCTCGACACGCAATAGATGGGAAATTTGTTTTTGTAGATCAGAGGGCGACAGCTATTTTGGCGTATCTACCACAGG |
| Rev-erbβ (Nr1d2) | NM_011584.3 | ATTGCCTACATCAGTTCCTCTAGCTCTGCCTCCAGCCCTGCCTCTTGTCACAGTGAGGGTTCTGAGAATAGCTTCCAGTCCTCGTCCTCGTCTGTTCCAT |
| Rev-erbα (Nr1d1) | NM_145434.2 | GCACACGTCTCTCTTTGCGTCCTGGTGCCTCATTTCTCCATCACCTACTTACTTCCTGGTTGCAGCTTCTCTTCCTTTGGGACTTTTGCACCCGGAGCTC |
| GAP-43 | NM_008083.2 | TACCACCATGCTGTGCTGTATGAGAAGAACCAAACAGGTTGAAAAGAATGATGAGGACCAAAAGATTGAACAAGATGGTGTCAAGCCGGAAGATAAGGCT |
| Bdnf-variant 1 | NM_007540.4 | CTTCTGTAGTCGCCAAGGTGGATGAGAGTTGAAGCTTTGCGGATATTGCGAAGGGTTATTAGATTCATAAGTCACACCAAGTGGTGGGCGATCCACTGAG |
| TrkB (Ntrk2) | NM_001025074.1 | AAGATCAAGATTCTGTGAACCTCACTGTGCATTTTGCGCCAACTATCACGTTTCTCGAGTCTCCAACCTCAGATCACCACTGGTGCATTCCATTCACTGT |
| Dbp | NM_016974.3 | AGGTGCTAATGACCTTTGAACCTGATCCCGCTGATCTCGCCCTGTCAAGCATTCCAGGCCATGAGACTTTTGACCCTCGGAGACACCGCTTCTCAGAGGA |
| Tef | NM_017376.2 | CCCTTTGGCCTTACATGTGTGTGTGTGCCTGTGCGAGTGTGTCCCTGCTGGTGGGCCGGAGTGATGTGTTATGGAGGGAAGTTGGGAATGTATCCTTTTC |
| Hlf | NM_172563.3 | TTCCACCAACCCCAGATAAGTAAGTACCATTCCTTATAGAACACAGAGTGTGTTTTGCACTGTCTGTACCTAAAGCAATAATCCTAGTGTACGCTAGAGC |
| Gria2 (AMPA2R) | NM_001039195.1 | GACCTCAAAATGCAGAGGATCTAATTTGCTGAGGAAAACGGTCAAAGAAGGAAAAGGAGGAAAGGGAAACGAGGGGATATTTTGTGGATGCTCTACTTTT |
| GABRg2 (GABA-AR) | NM_177408.5 | TTAGAACAAGAGCTGTTACACTGAGCAAGATACCTTTGAGCAACAGCAATGAAAACAGTGGAAGCTGGGAGGGTTTAAAGTGGCATTATCAGTCTTTGAC |
| cFos | NM_010234.2 | AGCTGGTGCATTACAGAGAGGAGAAACACGTCTTCCCTCGAAGGTTCCCGTCGACCTAGGGAGGACCTTACCTGTTCGTGAAACACACCAGGCTGTGGGC |
| Jun-B | NM_008416.1 | AACAGCCTTTCTATCACGACGACTCTTACGCAGCGGCGGGATACGGTCGGAGCCCTGGCAGCCTGTCTCTACACGACTACAAACTCCTGAAACCCACCTT |
| ERG-3 (Kcnh7) | NM_133207.2 | CACAGGAAGACCCGGATGTGGTAGTTATTGATTCTTCTAAACACAGCGATGACTCTGTGGCCATGAAGCACTTTAAGTCTCCCACGAAAGAAAGTTGCAG |
| Zif268 (Egr1) | NM_007913.5 | CGGCAGCAGCGCCTTCAATCCTCAAGGGGAGCCGAGCGAACAACCCTATGAGCACCTGACCACAGAGTCCTTTTCTGACATCGCTCTGAATAATGAGAAG |
| Housekeeping genes | ||
| Tubb | NM_009451.3 | CCCCTCAACACATGTACACACACACACACACTCCACCTTCTTAGATCTTGAAAATCCTTTCCTTTATGCCCTGTCCCTTCCCCAGCACTCCTGAACCATT |
| Trf1R | NM_011638.3 | CTGAACCAGTTCAAAACAGATATCAGGGATATGGGTCTAAGTCTACAGTGGCTGTATTCCGCTCGTGGAGACTACTTCCGTGCTACTTCTAGACTAACAA |
| HPRT | NM_013556.2 | TGCTGAGGCGGCGAGGGAGAGCGTTGGGCTTACCTCACTGCTTTCCGGAGCGGTAGCACCTCCTCCGCCGGCTTCCTCCTCAGACCGCTTTTTGCCGCGA |
| CyclophilinE (Ppie) | NM_019489.5 | AGTTCTTCCTGACCTGTGATAAGACAGATTGGCTGGACGGCAAGCATGTGGTATTTGGGGAGGTCACGGAAGGCCTGGATGTCTTGCGGCAGATCGAGGC |
| Gusb | NM_010368.1 | AATACGTGGTCGGAGAGCTCATCTGGAATTTCGCCGACTTCATGACGAACCAGTCACCGCTGAGAGTAATCGGAAACAAGAAGGGGATCTTCACTCGCCA |
| Eef1a1 | NM_010106.2 | TTCCCGAGGGTGGGGGAGAACGGTATATAAGTGCGGCAGTCGCCTTGGACGTTCTTTTTCGCAACGGGTTTGCCGTCAGAACGCAGGTGTTGTGAAAACC |
Data analysis and statistics.
Data are presented as a mean ± SEM. Statistical analysis of PER2::LUC rhythms and the NanoString data was performed with GraphPad Prism 5.04 software. For the analysis of the differential effect of day or night noise exposure on individual gene expression levels (see Fig. 4), an averaged value was obtained for each condition (control, day noise, and night noise) from the six time points (from ZT 0 to ZT 20). Each value was normalized to the ZT 0 value of their respective condition, which was set to 100%. The statistics for these averaged values were obtained by using one-way ANOVA with Tukey's multiple-comparisons post hoc tests. Unpaired Student's t test was used for all other data analysis.
Figure 4.

Transcriptional profile of plasticity and clock genes from ICs collected around the clock in response to day or night noise exposure. Temporal expression of plasticity and clock mRNAs in the IC from non-exposed animals (white circles) or animals noise exposed at ZT 3 (red circles) or ZT 15 (blue circles). The vertical axis shows normalized mean values ± SEM (n = 3–4). Expression levels are represented as a percentage change relative to ZT 0, which was set at 100%. The horizontal axis shows the sampling ZTs across 24 h, after which the animals were killed. The shaded area illustrates the dark phase of the day from ZT 12 to ZT 0. The time at which noise exposure was delivered is illustrated by the red (day) or blue (night) squares on the timescale.
Circadian rhythmicity in individual gene expression profiles was detected using a harmonic regression analysis (CircWave 1.4 software generated by Dr. Roelof Hut; www.euclock.org). The program produces a Fourier curve that describes the data by adding as many harmonics to the wave fit as the data allow. The program uses F testing for each added harmonic, like stepwise multiple regressions. The calculation of the waveform is based upon forward linear harmonic regression. A sinusoidal wave is fitted to the data and its significance is tested against a fitted horizontal line through the overall average. In other words, if the expression pattern follows a sinusoidal curve, it is considered circadian. The significance level (α) for the F test was set to 0.05.
Results
Circadian oscillation in the organotypic culture of IC
To assess the presence of biorhythms in the IC, we used a reporter mouse that expresses a luciferase protein fused to PER2 (Yoo et al., 2004). Using organotypic cultures of the whole ICs, we found robust oscillations at P4, P16 (onset of hearing), and adult (6–8 weeks) ICs (Fig. 1A–C). Almost all early postnatal (P4) ICs oscillated, however, the proportion of oscillating ICs decreased to 50% at P16 and further to 30% in adulthood (Table 2). We initially attributed this decreased success rate to the large volume of the adult IC making the penetration of the medium less efficient and therefore lowering survival rate. We therefore performed cultures of sectioned IC in several orientations (coronal, sagittal, and horizontal) and various thicknesses (200 and 250 μm). Coronal sections of 250 μm required less preparation time than the other orientations and showed an acceptable proportion of successful oscillations. Similar to whole IC cultures (Table 2), we obtained 30% of ICs with rhythmicity (Table 3). These nonoscillating ICs were controlled for gender, age, experimenter, and day of the week when they were collected and we could not find any obvious explanations for these failures. As an example, no significant gender difference in amplitude or phase of the oscillating sectioned ICs were found (amplitude: p = 0.1752; phase: p = 0.2449; n = 5–9). Forskolin, a well established synchronizing agent, increased the amplitude of PER2::LUC oscillations by 1.7-fold (Fig. 1D, Table 3), showing that the dampening of amplitude was not due to the loss of viability of the IC, but rather was likely due to desynchronization of the individual neurons. In other samples that were not oscillating, forskolin was not always able to kick-start the oscillations (data not shown).
Figure 1.

Circadian oscillations in isolated ICs at different ages. A–C, Representative recordings of bioluminescence from whole IC at different ages (P4, P16, and adult) maintained in culture for 4 d. D, Representative recording of bioluminescence from IC sections maintained in culture for 18 d. On day 9, the sections were treated with 16 μm forskolin (arrow), resulting in an increased amplitude of bioluminescence.
Table 2.
Number and percentage of oscillating whole ICs as measured by PER2::LUC bioluminescence
| Age | No. of oscillating ICs | Rhythmicity (%) |
|---|---|---|
| PN4 | 6 (6) | 100 |
| PN16 | 2 (4) | 50 |
| Adult (6–8 wk) | 6 (20) | 30 |
Data from organotypic cultures of whole ICs are presented according to age. The total number of samples recorded is shown in parentheses.
PN, Postnatal day.
Table 3.
Number and percentage of oscillating ICs sections measured by PER2::LUC bioluminescence
| Culture condition | No. of oscillating ICs | Rhythmicity (%) | Amplitude (photons/min) | Amplitude change (%) | Peak phase (h) |
|---|---|---|---|---|---|
| Untreated | 13 (43) | 30 | 2247 ± 718.7 | — | 25.6 ± 0.4 |
| Forskolin | 11 (11) | 100 | 632 ± 100.5 | 174 ± 50.7 | 28.6 ± 2.4 |
Total numbers of samples are shown in parentheses. Amplitude was calculated from the initial two cycles. Means (± SEM) are shown. The animals were 6–8 weeks old.
The regional expression pattern of the core clock protein PER2 from rostral to caudal IC was homogeneous in adult CBA mice (Fig. 2A–D). In addition, PER2 expression according to subdivisions of the IC such as CIC (ventromedial), dorsal cortex of IC, and external cortex of IC (dorsolateral) along the rostrocaudal axis did not differ at ZT 11, which corresponds to the time of peak expression. These findings demonstrate that the IC harbors a circadian clock that persists to oscillate in ex vivo conditions.
Figure 2.

PER2 expression pattern in the IC. A–D, Coronal sections from a control animal sampled at ZT 11 showing PER2 immunoreactivity throughout the IC. The sections are from the rostral (A) to the caudal (D) part of the IC. Corresponding anteroposterior stereotaxic coordinates relative to the bregma are indicated in millimeters. The subdivisions of the different regions of the IC are outlined with the dashed lines (A–D). The boxes in each subdivision indicate the region of interest [dorsal cortex of IC (DCIC), external cortex of IC (ECIC), and CIC] and are magnified in the inserts to the right. The asterisk and daggers indicate the aqueduct and cerebellum, respectively. Scale bars, 200 μm.
Circadian expression of molecular-clock-related genes in the IC
Normalized mRNA transcript profiles from ICs collected every fourth hour around the clock revealed circadian expression pattern (according to CircWave version 1.4) for several circadian-related genes (Fig. 3). Bmal1 displayed its known antiphase circadian expression (F test, p = 0.0286) relative to Per genes, with trough expression at ZT 12. Cry1 (F test, p = 0.0157), Per1 (F test, p = 0.0295), Per2 (F test, p = 0.0269), Rev-erbα (F test, p = 0.0347), and Dbp (F test, p = 0.0047) all showed peak amplitude ranging from ZT 8 (Rev-erbα) to ZT 20 (Cry1). The two other PAR bZip factors (i.e., Hlf, Tef) did not show rhythmic expression. These findings corroborate the notion that the IC expresses core clock and clock-controlled genes.
Figure 3.
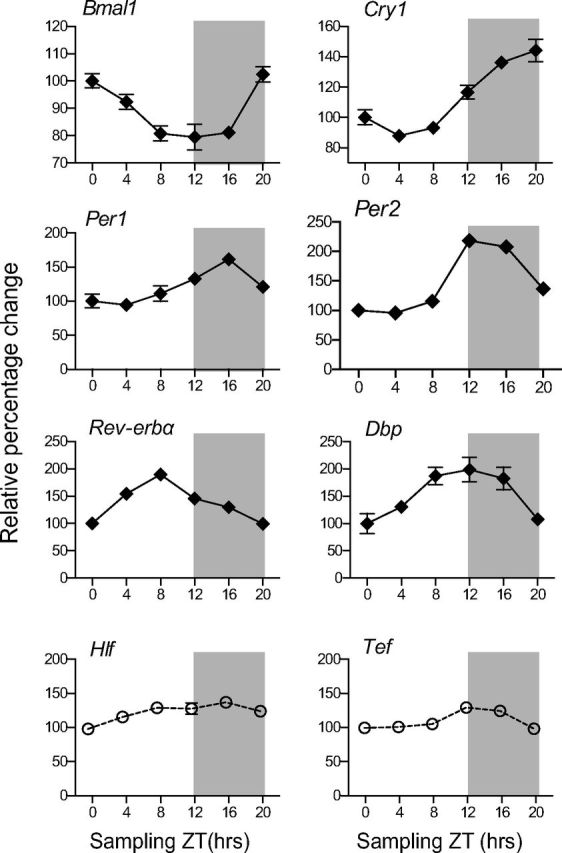
Transcriptional profiles of clock genes from ICs collected around the clock. Temporal expression of clock mRNAs in the IC assessed with the NanoString nCounter. The vertical axis shows normalized mean values ± SEM (n = 3–4). The horizontal axis shows the sampling ZTs across 24 h, after which the animals were killed and samples collected. The shaded area illustrates the dark phase of the day from ZT 12 to ZT 0. All conditions were plotted as relative percentage change using ZT 0 as baseline value. Genes that did not oscillate (Hlf and Tef) according to CircWave are represented by open circles.
Transcriptional changes in the IC after day and night noise exposure
Our previous work in the IC demonstrated that the early effects of day noise exposure, which caused a permanent threshold shift, led to the transient activation of brain-derived neurotrophic factor (BDNF) (Meltser et al., 2010). Another study showed that increased expression of BDNF was observed in the IC, but was downregulated in the primary auditory cortex (Tan et al., 2007). These reports suggest that these molecular changes in the central auditory system can be attributed to altered synaptic plasticity. Furthermore, our recent study in the cochlea demonstrated differential Bdnf responses after day and night noise trauma (Meltser et al., 2014). We therefore addressed how Bdnf and other early-induced genes and clock genes are altered in the IC after day or night noise exposure.
Early-induced genes
We assessed the changes in transcript levels from Bdnf, c-Fos, Jun-B, Zif268, Erg3, GABA-Rg2, TrkB, and GAP-43 every fourth hour around the clock after day or night noise exposure (Fig. 4). To illustrate the overall changes on expression levels in both early-induced genes and clock genes, Table 4 shows the statistical analysis performed on the average relative gene expression levels during 24 h obtained from the data presented in Figure 4. This noise exposure (100 dB SPL, 1 h, 6–12 kHz) causes a temporary damage when applied during the day, whereas it causes a permanent damage when applied during the night (Meltser et al., 2014). Night noise exposure caused a greater increase in transcript levels of c-Fos, Jun-B, and Zif268 compared with day noise exposure (Fig. 4, Table 4). Conversely, GAP-43 showed greater enhancement after day noise than after night noise. Day noise exposure downregulated two plasticity genes, Erg3 and GABA-Rg2, which were not affected by night noise exposure. Three early-induced genes, c-Fos, Jun-b, and Zif268, showed greater responses to night noise exposure, whereas Bdnf had equal changes after day or night noise. Erg3, GABA-Rg2, TrkB, and GAP-43 were not altered after night noise (Table 4).
Table 4.
Averaged gene expression levels in the IC during 24 h showing the differential effects of day or night noise exposure compared with control
| Control | Day noise | p-value | Night noise | p-value | |
|---|---|---|---|---|---|
| Early-induced genes | |||||
| Bdnf1 | 78.3 ± 17.4 | 484.1 ± 116.6 | 0.013* | 479.1 ± 122 | 0.013* |
| cFOS | 103.8 ± 6.7 | 253.6 ± 65.7 | 0.442 | 438.4 ± 132.6 | 0.020* |
| JunB | 109.3 ± 3.8 | 128.7 ± 13.2 | 0.641 | 166 ± 22.1 | 0.025* |
| Zif268 | 110.3 ± 5 | 143.4 ± 19.9 | 0.641 | 205.8 ± 39.5 | 0.028* |
| Erg3 | 116.3 ± 3.5 | 96.9 ± 2.4 | <0.0001*** | 109 ± 2.5 | 0.167 |
| GabaRg | 107 ± 1.7 | 96.6 ± 1.1 | <0.0001*** | 105.4 ± 1.1 | 0.679 |
| TrkB | 104.6 ± 2.2 | 98.2 ± 1.7 | 0.097 | 100.1 ± 2.4 | 0.304 |
| Gap 43 | 102.7 ± 1.7 | 113.2 ± 3.1 | 0.008** | 100.5 ± 2.1 | 0.784 |
| Clock genes | |||||
| Per1 | 120.1 ± 5.4 | 121.4 ± 5.5 | 0.995 | 177.7 ± 13.5 | <0.0001*** |
| Per2 | 145.5 ± 10.5 | 129.3 ± 6.3 | 0.702 | 204.3 ± 21 | 0.012* |
| Rev-erbα | 136.5 ± 6.9 | 95.6 ± 2.7 | <0.0001*** | 122 ± 7.3 | 0.211 |
| Rev-erbβ | 134.2 ± 4.7 | 92.4 ± 2.9 | <0.0001*** | 125.7 ± 4.4 | 0.309 |
| Dbp | 151.3 ± 8.9 | 105.1 ± 3.7 | 0.002** | 161.4 ± 12.5 | 0.717 |
| Hlf | 123.8 ± 3.3 | 88.4 ± 3.5 | <0.0001*** | 116 ± 4.7 | 0.334 |
| Tef | 110.2 ± 3 | 95.4 ± 2.9 | 0.006** | 116.8 ± 3.9 | 0.333 |
| Bmal | 89.4 ± 2.3 | 82.4 ± 2.8 | 0.223 | 82.8 ± 3.6 | 0.248 |
Averaged percentage change in transcript levels of early-induced and clock genes during 24 h for control, day noise, and night noise groups is shown. The values presented here were obtained through the averaging of the six time points during 24 h for each condition that are presented in Figure 4. Note that these values represent a percentage change relative to ZT 0, which was normalized to 100%. Results are mean ± SEM.
*p <0.05,
**p <0.01,
***p <0.001; p-values were obtained using one-way ANOVA with Tukey's multiple comparison post-hoc test versus control values. Statistically significant values are shown in bold.
Clock genes
Noise exposure at night increased the amplitude of Per1 and Per2 transcript levels to a greater extent than during the day (Fig. 4, Table 4). In contrast, the expression level of some genes was only affected after day noise exposure. Average levels of Dbp, Hlf, Tef, Rev-erbα, and Rev-erbβ were decreased only after day exposure. Bmal was unaffected by either day or night noise exposure. The alterations in the transcript profiles of some circadian genes could lead to altered homeostasis in the IC with subsequent consequences on auditory function after acoustic insults.
Changes in circadian PER2::LUC expression after day and night noise exposure
To determine the effects of day or night noise exposure on the IC with a greater resolution and on a larger timescale, bioluminescence was recorded from ICs obtained from PER2::LUC mice that were killed immediately after noise exposure at ZT 3 and ZT 15 (Fig. 5A). Consistent with the changes in Per2 mRNA expression (Fig. 4), we found that night, but not day, noise exposure significantly increased the amplitude compared with the sham condition (p = 0.016; n = 5–6; Fig. 5B). The phase was not altered after day or night noise exposure (Fig. 5C). The period of PER2::LUC oscillations increased after night, but not day, noise exposure (p = 0.008, n = 3–5; Fig. 5D). These results support the notion that the molecular clock of the IC is affected differentially by the time at which the animals are exposed to noise.
Figure 5.
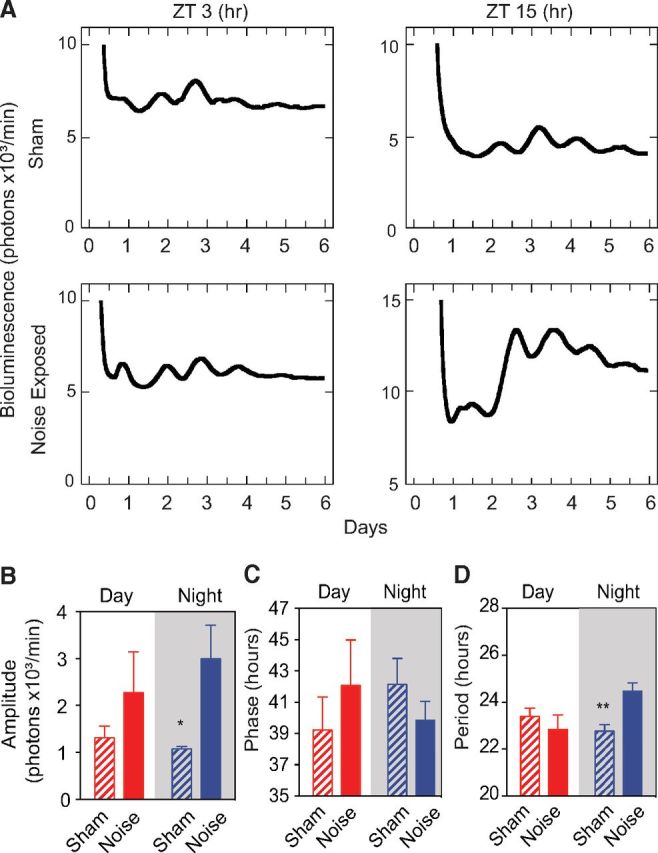
Effect of day or night noise exposure on PER2::LUC rhythms in the IC. A, Representative bioluminescence recordings of PER2::LUC expression from whole ICs isolated from sham and immediate-post-noise-exposed animals at ZT 3 (day) or ZT 15 (night). Quantification of amplitude (B), phase (C), and period (D) from PER2::LUC ICs are shown from mice exposed to either day or night noise. Results are mean values ± SEM (n = 3–6 samples obtained from 4–5 animals). *p < 0.05, **p < 0.01, unpaired Student's t test.
Neuronal activation in the IC after day and night noise exposure
Among the four early-induced genes that we found having immediate transcriptional changes after day or night noise exposure, c-Fos displayed the most prominent changes. We thus sought to confirm these changes at the protein level using immunohistochemistry. The changes of c-Fos expression were examined in the sections from the caudal part of IC (−5.02 mm to −5.20 mm from the bregma) immediately after noise exposure or sham condition at ZT 1 or ZT 13 (Fig. 6A,D). c-Fos expression was significantly increased in both day- and night-noise-exposed animals compared with unexposed sham animals. In addition, the ventromedial part of the IC showed approximately twice the number of positive neurons as the dorsolateral part of both day- (p = 0.039) and night- (p = 0.046) noise-exposed ICs. Regardless of the subdivision of the IC, no difference was found in the number of c-Fos-positive cells between day- and night-noise-exposed animals (Fig. 6C,F). These findings confirm that day and night noise exposure increase neural activity in both regions of the IC equally.
Figure 6.

Expression of c-Fos in the ventromedial and dorsolateral portions of the IC. A, D, Increased number of positively stained neurons shown immediately after noise exposure (ZT 1 or ZT 13) compared with sham. Sections were taken from a caudal part of the IC between −5.02 mm and −5.20 mm, which is located caudally from the bregma along the rostrocaudal axis. These areas contain the ventromedial and dorsolateral regions of the IC. Images are representative micrographs from three independent experiments. Scale bar, 100 μm. Schematic illustrations of the brainstem, including the IC, are marked with a gray square in the ventromedial (B) or dorsolateral (E) area and represent the region used for quantification. The size of the gray square is proportionately related to the size of the micrographs. Quantification of c-Fos immunoreactivity shows increased immunopositive neurons in ventromedial (C) and dorsolateral (F) regions after day or night noise exposure. Data are shown as mean ± SEM. The numbers of sham mice and noise-exposed mice in each time point are n = 3 and n = 4, respectively. *p < 0.05, **p < 0.01, ***p < 0.001, unpaired Student's t test.
Locomotor activity during day or night noise exposure
Because the mouse is a nocturnal animal, differences in noise sensitivity could be due to different activity levels as well as posture changes during the active or inactive states, leading to differences in the level of sound at the ears. We tested this by measuring locomotor activity during day or night noise exposure and did not find any differences. The average counts per minute for locomotor activity in the X, Y, and Z planes at ZT 3 and ZT 15 were as follows: 66.8 ± 12.4 and 89.5 ± 8.5 in Xtot (p = 0.097), 33.4 ± 9.3 and 41.9 ± 1.8 in Ytot (p = 0.330), and 19.1 ± 10.3 and 18.0 ± 6.6 in Ztot (p = 0.955). Our visual observations of behavioral activity confirm that there were no differences in the way that the animals behaved during day or night noise exposure. In support of this, when ABR thresholds were measured 24 h after noise trauma, the day and night groups showed equal amounts of hearing loss (Meltser et al., 2014). Similar observations were obtained by measuring wave I amplitudes of the 24 h postnoise ABRs at different intensities for 24 kHz (day noise vs night noise p = 0.0815, two-way ANOVA; n = 4–12). These behavioral findings show that locomotor activity, posture, and head orientation are not different during day and night noise exposure and demonstrate that effective sound exposure variation between day and night is negligible.
Discussion
The presence of a circadian clock in the IC was demonstrated using the PER2::LUC mouse. Core clock genes and clock-controlled genes have also been identified by transcriptional analyses and alterations in mRNA oscillations have been found after noise exposure. Day noise exposure, in contrast to night noise exposure, attenuated the average gene expression of some circadian genes (Rev-erbα, Rev-erbβ, Dbp, Hlf, and Tef). The consequences of such changes remain to be assessed, but it will likely affect IC function because core clock genes are tightly integrated to other pathways involved in plasticity and hormonal responses. This was illustrated by a previous study showing that functional deficits in the hippocampus are observed in Bmal1−/− mice that display loss of memory and reduction in LTP (Wardlaw et al., 2014). Moreover, neuronal survival is controlled by Bmal1 and its loss of function leads to neurodegeneration via altered ROS defense (Musiek et al., 2013). Further evidence illustrating the connection between neuronal function and disruptions in clock genes is found in mice deficient for Per1 that display hippocampal-dependent learning deficits (Jilg et al., 2010). Overall, alterations in the molecular clock affect neuronal connectivity and survival. The experiments described here show acute changes in the IC that are unlikely to result in alterations as severe as those observed in the above-mentioned mutants. Nevertheless, the noise exposure used in this study triggered differential effects when delivered in the day or the night, suggesting that chronic exposure to noise at different times of the day could have long-term deleterious effects.
The effects of night noise on the IC may have both independent and dependent relations to the cochlea. For example, Bdnf responses were similar in the IC after day and night noise exposure (15-fold-increase; Fig. 4), whereas in the cochlea, it was only induced after day noise exposure (35-fold-increase; Meltser et al., 2014). These findings indicate that neurotrophic signaling responds differentially in the cochlea compared with the IC. When analyzing circadian responses to night noise, the IC showed an inversed circadian response compared with the cochlea. For example, the amplitude response of Per1 and Per2 mRNA transcripts levels was greater after night noise exposure, whereas it was suppressed in the cochlea. These findings were also reinforced by the ex vivo results showing the greater amplitude of PER2::LUC rhythms after night noise, which is in contrast to the cochlea (Meltser et al., 2014). Conversely, night noise exposure suppressed Rev-erbα circadian profile in the cochlea, whereas it was not affected in the IC. Another difference was in the expression of Bmal1, the amplitude of which was greatly modulated by noise in the cochlea, but not in the IC. The inversed circadian response of the IC to night noise exposure could have been caused by compensatory mechanisms, making it difficult to determine whether the IC is independent of or dependent on the cochlea. Interestingly, hyperactivity in the IC and suppressed auditory nerve responses after noise trauma were found in several studies (Salvi et al., 2000; Niu et al., 2013), reinforcing the notion that central and peripheral structures respond differentially to noise exposure. Together, the electrophysiological responses (Salvi et al., 2000; Niu et al., 2013) and our mRNA data suggest that peripheral and central structures do not respond in parallel to noise exposure.
Day noise exposure might be more disruptive than night noise exposure in the IC. Comparisons of averaged relative gene expression values corroborate this hypothesis because five of eight clock genes were affected only by day noise exposure. Early-induced genes were affected by both day and night noise exposure. Interestingly, Bdnf mRNA transcript levels in the IC showed a similar increase after both day and night noise exposure, whereas the Bdnf response was greater only after day noise exposure in the cochlea. This increase in Bdnf mRNA in the IC could contribute to increased plasticity and neuroprotection against cell death known to be happening in the IC after noise trauma (Coordes et al., 2012). These findings suggest that plastic responses to noise would not be altered differentially at different times of the day in the IC. Moreover, these findings highlight differences in neurotrophic responses to noise in the cochlea and the IC. We found that Bdnf expression shows a circadian pattern in the cochlea, but not the IC, according to statistical tests using CircWave (data not shown). In the cochlea, Bdnf expression peaks at night and is low in the day, allowing for a greater dynamic range to trigger its expression in response to day noise. In contrast, in the IC, the expression is low throughout a 24 h cycle, which may underline the ability of the IC to induce Bdnf expression in response to both day and night noise.
Dysfunction in the neurotransmitter release in the IC is known to contribute to auditory seizures (Faingold et al., 1991; Li et al., 1999). Mice lacking the three PAR bZip proteins (Dbp, Hlf, and Tef) are vulnerable to sound-induced and spontaneous epilepsies via a pyridoxal kinase (Pdxk)-dependent decrease in serotonin and dopamine (Gachon et al., 2004). Day noise exposure decreased the expression of Dbp and Hlf in the IC, making them interesting candidates for circadian-regulated audiogenic seizures. In fact, it was found that mice are more vulnerable to noise-induced seizures when delivered in the night compared with the day, with a significant increase in the number of convulsions and death rates (Halberg et al., 1955). Furthermore, some neurons showed an increased susceptibility to neuronal damage at the beginning of active phase (Karmarkar and Tischkau, 2013). If this temporal variation does exist, it is possible that IC-related auditory pathologies such as tinnitus, hyperacusis, and audiogenic seizures may be dependent upon circadian mechanisms.
We observed in ICs isolated from adult mice that not all preparations showed clear oscillations compared with early postnatal ICs. The reasons for this variability between oscillating and nonoscillating preparations are unknown, so we performed a series of experiments to understand this phenomenon (e.g., whole IC vs sectioned IC, orientation of the sections, thickness of the section). These nonoscillating ICs were controlled for gender, age, experimenter, and day of isolation and we could find no grounds for these failures based on these factors. The C57BL/6J mouse strain develops a progressive hearing loss at an early age starting from ∼14 weeks (Ohlemiller et al., 2000; Ison et al., 2007). Because all of our adult ex vivo studies were performed on 6- to 8-week-old mice, age-related hearing loss does not seem to be an underlying cause for the lack of oscillations in the IC. In our previous study, cochlear samples were analyzed at the same age and all preparations oscillated (Meltser et al., 2014), highlighting the fact that the IC is perhaps more sensitive in culture conditions than the cochlea. Although the culturing conditions used in this study are the ones typically used for the SCN and other brain regions (Savelyev et al., 2011), it is possible that they might not optimal for the adult IC (Hafidi et al., 1995; Cho et al., 2007). We initially saw this decrease in successfully oscillating ICs from whole organ cultures, which led to a second series of experiments in which we sectioned the IC. The reasoning behind this was that the increased thickness of tissue could preempt the proper of delivery of luciferin and/or nutrients to the IC, leading to a lower bioluminescent signal. However, these experiments on sectioned IC did not increase the overall number of successful oscillating ICs in the adult. Therefore, it could also be postulated that the IC from adult animals is more vulnerable than other brain regions to being put into culture. It has been shown that the IC requires a high blood and glucose supply compared with other brain regions, which may make it more difficult to maintain in culture (Landau et al., 1955; Sokoloff et al., 1977). Despite these limitations, when a particular preparation showed oscillations, the rhythms could be maintained for up to 7 d without synchronizing agents or 18 d with synchronizing agent treatment. A third explanation is that the adult IC contains a lower number of rhythmic cells compared with early postnatal tissue or that their synchronicity could be lost when in culture. This latter explanation could be likely because the addition of forskolin, a synchronizing agent, kicked off PER2::LUC rhythms in some preparations, suggesting that the IC may become rapidly desynchronized in culture.
In conclusion, we show that the IC contains circadian oscillations evident at both the mRNA and protein level. These clock gene rhythms are affected differentially by day and night noise exposure and could play a role in the regulation of homeostasis within the IC and throughout the auditory pathway.
Footnotes
This work was supported by the AFA Insurance Company (Project and Postdoctoral Grant to I.M.), the Swedish Medical Research Council (Grant K2014-99X-22478-01-3 to B.C.), National Institute on Deafness and Other Communication Disorders–National Institutes of Health (Grant R21DC013172 to B.C.), the National Research Foundation of Korea funded by the Ministry of Education of the Korean Government (Grant 2014R1A6A3A03058661 to J.P.), the Knut and Alice Wallenberg Foundation (Grant KAW2008.0149 to B.C.), the Karolinska Institutet (B.C., C.R.C.), Tysta Skolan (B.C., J.P., G.L.), Hörselforskningsfonden (B.C., G.L.), Lars Hiertas Minne (C.R.C.), Magnus Bergvalls (C.R.C.), and the Wenner Gren Foundation (C.R.C.). The funders had no role in the study design, data collection, and analysis; decision to publish; or preparation of the manuscript. We thank Min-jung Kim for help with figures.
The authors declare no competing financial interests.
References
- Albrecht U. Timing to perfection: the biology of central and peripheral circadian clocks. Neuron. 2012;74:246–260. doi: 10.1016/j.neuron.2012.04.006. [DOI] [PubMed] [Google Scholar]
- Bass J, Takahashi JS. Circadian integration of metabolism and energetics. Science. 2010;330:1349–1354. doi: 10.1126/science.1195027. [DOI] [PMC free article] [PubMed] [Google Scholar]
- Beaume M, Hernandez D, Docquier M, Delucinge-Vivier C, Descombes P, François P. Orientation and expression of methicillin-resistant Staphylococcus aureus small RNAs by direct multiplexed measurements using the nCounter of NanoString technology. J Microbiol Methods. 2011;84:327–334. doi: 10.1016/j.mimet.2010.12.025. [DOI] [PubMed] [Google Scholar]
- Berger JI, Coomber B. Tinnitus-related changes in the inferior colliculus. Front Neurol. 2015;6:61. doi: 10.3389/fneur.2015.00061. [DOI] [PMC free article] [PubMed] [Google Scholar]
- Berger JI, Coomber B, Wells TT, Wallace MN, Palmer AR. Changes in the response properties of inferior colliculus neurons relating to tinnitus. Front Neurol. 2014;5:203. doi: 10.3389/fneur.2014.00203. [DOI] [PMC free article] [PubMed] [Google Scholar]
- Cho S, Wood A, Bowlby MR. Brain slices as models for neurodegenerative disease and screening platforms to identify novel therapeutics. Curr Neuropharmacol. 2007;5:19–33. doi: 10.2174/157015907780077105. [DOI] [PMC free article] [PubMed] [Google Scholar]
- Coordes A, Gröschel M, Ernst A, Basta D. Apoptotic cascades in the central auditory pathway after noise exposure. J Neurotrauma. 2012;29:1249–1254. doi: 10.1089/neu.2011.1769. [DOI] [PubMed] [Google Scholar]
- Dibner C, Schibler U, Albrecht U. The mammalian circadian timing system: organization and coordination of central and peripheral clocks. Annu Rev Physiol. 2010;72:517–549. doi: 10.1146/annurev-physiol-021909-135821. [DOI] [PubMed] [Google Scholar]
- Faingold CL, Boersma Anderson CA, Caspary DM. Involvement of GABA in acoustically-evoked inhibition in inferior colliculus neurons. Hear Res. 1991;52:201–216. doi: 10.1016/0378-5955(91)90200-S. [DOI] [PubMed] [Google Scholar]
- Faingold CL, Naritoku DK, Copley CA, Randall ME, Riaz A, Anderson CA, Arnerić SP. Glutamate in the inferior colliculus plays a critical role in audiogenic seizure initiation. Epilepsy Res. 1992;13:95–105. doi: 10.1016/0920-1211(92)90064-Z. [DOI] [PubMed] [Google Scholar]
- Gachon F, Fonjallaz P, Damiola F, Gos P, Kodama T, Zakany J, Duboule D, Petit B, Tafti M, Schibler U. The loss of circadian PAR bZip transcription factors results in epilepsy. Genes Dev. 2004;18:1397–1412. doi: 10.1101/gad.301404. [DOI] [PMC free article] [PubMed] [Google Scholar]
- Geiss GK, Bumgarner RE, Birditt B, Dahl T, Dowidar N, Dunaway DL, Fell HP, Ferree S, George RD, Grogan T, James JJ, Maysuria M, Mitton JD, Oliveri P, Osborn JL, Peng T, Ratcliffe AL, Webster PJ, Davidson EH, Hood L, et al. Direct multiplexed measurement of gene expression with color-coded probe pairs. Nat Biotechnol. 2008;26:317–325. doi: 10.1038/nbt1385. [DOI] [PubMed] [Google Scholar]
- Hafidi A, Sanes DH, Hillman DE. Regeneration of the auditory midbrain intercommissural projection in organotypic culture. J Neurosci. 1995;15:1298–1307. doi: 10.1523/JNEUROSCI.15-02-01298.1995. [DOI] [PMC free article] [PubMed] [Google Scholar]
- Halberg F, Bittner JJ, Gully RJ, Albrecht PG, Brackney EL. 24-Hour periodicity and audiogenic convulsions in I mice of various ages. Proc Soc Exp Biol Med. 1955;88:169–173. doi: 10.3181/00379727-88-21526. [DOI] [PubMed] [Google Scholar]
- Halberg F, Jacobsen E, Wadsworth G, Bittner JJ. Audiogenic abnormality spectra, twenty-four hour periodicity, and lighting. Science. 1958;128:657–658. doi: 10.1126/science.128.3325.657. [DOI] [PubMed] [Google Scholar]
- Ison JR, Allen PD, O'Neill WE. Age-related hearing loss in C57BL/6J mice has both frequency-specific and non-frequency-specific components that produce a hyperacusis-like exaggeration of the acoustic startle reflex. J Assoc Res Otolaryngol. 2007;8:539–550. doi: 10.1007/s10162-007-0098-3. [DOI] [PMC free article] [PubMed] [Google Scholar]
- Jilg A, Lesny S, Peruzki N, Schwegler H, Selbach O, Dehghani F, Stehle JH. Temporal dynamics of mouse hippocampal clock gene expression support memory processing. Hippocampus. 2010;20:377–388. doi: 10.1002/hipo.20637. [DOI] [PubMed] [Google Scholar]
- Johansson AS, Brask J, Owe-Larsson B, Hetta J, Lundkvist GB. Valproic acid phase shifts the rhythmic expression of Period2::Luciferase. J Biol Rhythms. 2011;26:541–551. doi: 10.1177/0748730411419775. [DOI] [PubMed] [Google Scholar]
- Karmarkar SW, Tischkau SA. Influences of the circadian clock on neuronal susceptibility to excitotoxicity. Front Physiol. 2013;4:313. doi: 10.3389/fphys.2013.00313. [DOI] [PMC free article] [PubMed] [Google Scholar]
- Landau WM, Freygang WH, Jr, Roland LP, Sokoloff L, Kety SS. The local circulation of the living brain: values in the unanesthetized and anesthetized cat. Trans Am Neurol Assoc. 1955:125–129. 80thMeeting. [PubMed] [Google Scholar]
- Li Y, Evans MS, Faingold CL. Synaptic response patterns of neurons in the cortex of rat inferior colliculus. Hear Res. 1999;137:15–28. doi: 10.1016/S0378-5955(99)00129-X. [DOI] [PubMed] [Google Scholar]
- Meltser I, Tahera Y, Canlon B. Differential activation of mitogen-activated protein kinases and brain-derived neurotrophic factor after temporary or permanent damage to a sensory system. Neuroscience. 2010;165:1439–1446. doi: 10.1016/j.neuroscience.2009.11.025. [DOI] [PubMed] [Google Scholar]
- Meltser I, Cederroth CR, Basinou V, Savelyev S, Lundkvist GS, Canlon B. TrkB-mediated protection against circadian sensitivity to noise trauma in the murine cochlea. Curr Biol. 2014;24:658–663. doi: 10.1016/j.cub.2014.01.047. [DOI] [PMC free article] [PubMed] [Google Scholar]
- Musiek ES, Lim MM, Yang G, Bauer AQ, Qi L, Lee Y, Roh JH, Ortiz-Gonzalez X, Dearborn JT, Culver JP, Herzog ED, Hogenesch JB, Wozniak DF, Dikranian K, Giasson BI, Weaver DR, Holtzman DM, Fitzgerald GA. Circadian clock proteins regulate neuronal redox homeostasis and neurodegeneration. J Clin Invest. 2013;123:5389–5400. doi: 10.1172/JCI70317. [DOI] [PMC free article] [PubMed] [Google Scholar]
- Niu Y, Kumaraguru A, Wang R, Sun W. Hyperexcitability of inferior colliculus neurons caused by acute noise exposure. J Neurosci Res. 2013;91:292–299. doi: 10.1002/jnr.23152. [DOI] [PubMed] [Google Scholar]
- Ohlemiller KK, Wright JS, Heidbreder AF. Vulnerability to noise-induced hearing loss in ‘middle-aged’ and young adult mice: a dose-response approach in CBA, C57BL, and BALB inbred strains. Hear Res. 2000;149:239–247. doi: 10.1016/S0378-5955(00)00191-X. [DOI] [PubMed] [Google Scholar]
- Partch CL, Green CB, Takahashi JS. Molecular architecture of the mammalian circadian clock. Trends Cell Biol. 2014;24:90–99. doi: 10.1016/j.tcb.2013.07.002. [DOI] [PMC free article] [PubMed] [Google Scholar]
- Paxinos G, Franklin K. The mouse brain in stereotaxic coordinates. Ed 3. San Diego: Academic; 2007. [Google Scholar]
- Salvi RJ, Saunders SS, Gratton MA, Arehole S, Powers N. Enhanced evoked response amplitudes in the inferior colliculus of the chinchilla following acoustic trauma. Hear Res. 1990;50:245–257. doi: 10.1016/0378-5955(90)90049-U. [DOI] [PubMed] [Google Scholar]
- Salvi RJ, Wang J, Ding D. Auditory plasticity and hyperactivity following cochlear damage. Hear Res. 2000;147:261–274. doi: 10.1016/S0378-5955(00)00136-2. [DOI] [PubMed] [Google Scholar]
- Savelyev SA, Larsson KC, Johansson AS, Lundkvist GB. Slice preparation, organotypic tissue culturing and luciferase recording of clock gene activity in the suprachiasmatic nucleus. J Vis Exp. 2011;48:2439. doi: 10.3791/2439. pii. [DOI] [PMC free article] [PubMed] [Google Scholar]
- Sokoloff L, Reivich M, Kennedy C, Des Rosiers MH, Patlak CS, Pettigrew KD, Sakurada O, Shinohara M. The [14C]deoxyglucose method for the measurement of local cerebral glucose utilization: theory, procedure, and normal values in the conscious and anesthetized albino rat. J Neurochem. 1977;28:897–916. doi: 10.1111/j.1471-4159.1977.tb10649.x. [DOI] [PubMed] [Google Scholar]
- Son GH, Chung S, Kim K. The adrenal peripheral clock: glucocorticoid and the circadian timing system. Front Neuroendocrinol. 2011;32:451–465. doi: 10.1016/j.yfrne.2011.07.003. [DOI] [PubMed] [Google Scholar]
- Tan J, Rüttiger L, Panford-Walsh R, Singer W, Schulze H, Kilian SB, Hadjab S, Zimmermann U, Köpschall I, Rohbock K, Knipper M. Tinnitus behavior and hearing function correlate with the reciprocal expression patterns of BDNF and Arg3.1/arc in auditory neurons following acoustic trauma. Neuroscience. 2007;145:715–726. doi: 10.1016/j.neuroscience.2006.11.067. [DOI] [PubMed] [Google Scholar]
- Vandesompele J, De Preter K, Pattyn F, Poppe B, Van Roy N, De Paepe A, Speleman F. Accurate normalization of real-time quantitative RT-PCR data by geometric averaging of multiple internal control genes. Genome Biol. 2002;3 doi: 10.1186/gb-2002-3-7-research0034. RESEARCH0034. [DOI] [PMC free article] [PubMed] [Google Scholar]
- Vikhe Patil K, Canlon B, Cederroth CR. High quality RNA extraction of the mammalian cochlea for qRT-PCR and transcriptome analyses. Hear Res. 2015;325:42–48. doi: 10.1016/j.heares.2015.03.008. [DOI] [PubMed] [Google Scholar]
- Wang J, Ding D, Salvi RJ. Functional reorganization in chinchilla inferior colliculus associated with chronic and acute cochlear damage. Hear Res. 2002;168:238–249. doi: 10.1016/S0378-5955(02)00360-X. [DOI] [PubMed] [Google Scholar]
- Wardlaw SM, Phan TX, Saraf A, Chen X, Storm DR. Genetic disruption of the core circadian clock impairs hippocampus-dependent memory. Learn Mem. 2014;21:417–423. doi: 10.1101/lm.035451.114. [DOI] [PMC free article] [PubMed] [Google Scholar]
- Yamazaki S, Numano R, Abe M, Hida A, Takahashi R, Ueda M, Block GD, Sakaki Y, Menaker M, Tei H. Resetting central and peripheral circadian oscillators in transgenic rats. Science. 2000;288:682–685. doi: 10.1126/science.288.5466.682. [DOI] [PubMed] [Google Scholar]
- Yoo SH, Yamazaki S, Lowrey PL, Shimomura K, Ko CH, Buhr ED, Siepka SM, Hong HK, Oh WJ, Yoo OJ, Menaker M, Takahashi JS. PERIOD2::LUCIFERASE real-time reporting of circadian dynamics reveals persistent circadian oscillations in mouse peripheral tissues. Proc Natl Acad Sci U S A. 2004;101:5339–5346. doi: 10.1073/pnas.0308709101. [DOI] [PMC free article] [PubMed] [Google Scholar]