

Abstract
In the basal ganglia, focused rhythmicity is an important feature of network activity at certain stages of motor processing. In disease, however, the basal ganglia develop amplified rhythmicity. Here, we demonstrate how the cellular architecture and network dynamics of an inhibitory loop in the basal ganglia yield exaggerated synchrony and locking to β oscillations, specifically in the dopamine-depleted state. A key component of this loop is the pallidostriatal pathway, a well-characterized anatomical projection whose function has long remained obscure. We present a synaptic characterization of this pathway in mice and incorporate these data into a computational model that we use to investigate its influence over striatal activity under simulated healthy and dopamine-depleted conditions. Our model predicts that the pallidostriatal pathway influences striatal output preferentially during periods of synchronized activity within GPe. We show that, under dopamine-depleted conditions, this effect becomes a key component of a positive feedback loop between the GPe and striatum that promotes synchronization and rhythmicity. Our results generate novel predictions about the role of the pallidostriatal pathway in shaping basal ganglia activity in health and disease.
SIGNIFICANCE STATEMENT This work demonstrates that functional connections from the globus pallidus externa (GPe) to striatum are substantially stronger onto fast-spiking interneurons (FSIs) than onto medium spiny neurons. Our circuit model suggests that when GPe spikes are synchronous, this pallidostriatal pathway causes synchronous FSI activity pauses, which allow a transient window of disinhibition for medium spiny neurons. In simulated dopamine-depletion, this GPe-FSI activity is necessary for the emergence of strong synchronization and the amplification and propagation of β oscillations, which are a hallmark of parkinsonian circuit dysfunction. These results suggest that GPe may play a central role in propagating abnormal circuit activity to striatum, which in turn projects to downstream basal ganglia structures. These findings warrant further exploration of GPe as a target for interventions for Parkinson's disease.
Keywords: FSI, GPe, computational model, oscillations, Parkinson's, synchrony
Introduction
A hallmark of basal ganglia dysfunction in Parkinson's disease (PD) is the amplification of synchronous, rhythmic activity, particularly in the β frequency range (13–30 Hz) (Bergman et al., 1998; Bevan et al., 2002; Hutchison et al., 2004; Gatev et al., 2006). Although some clinical data and results from animal models suggest that β oscillations are not causal to motor symptoms (Leblois et al., 2007; Mallet et al., 2008b; Degos et al., 2009), their reduction is correlated with symptomatic improvement (Kuhn et al., 2006; Hammond et al., 2007; Kuhn et al., 2009; Little et al., 2012); therefore, understanding how β oscillations originate, propagate, and can be mitigated could be of potential therapeutic value. While the mechanistic origins of β oscillations remain unknown, a number of models have been proposed, many of which involve the globus pallidus externa (GPe) (Terman et al., 2002; Kita, 2007; Mallet et al., 2008a; Holgado et al., 2010; Kumar et al., 2011; Pavlides et al., 2015).
Under dopamine-depleted (DD) conditions, GPe neurons fire synchronously and rhythmically (Nini et al., 1995; Raz et al., 2000; Goldberg et al., 2004; Heimer et al., 2006; Mallet et al., 2008a), and GPe deep brain stimulation disrupts pathological β oscillations and improves movement in PD patients (Vitek et al., 2004, 2012). Although GPe's contributions to β oscillations have generally been attributed to its reciprocal connections with the subthalamic nucleus (STN) (Plenz et al., 1999; Brown et al., 2001; Magill et al., 2001; Mallet et al., 2008a; Tachibana et al., 2011), feedback projections from GPe to striatum (pallidostriatal) might also be involved.
Some anatomical data suggest that pallidostriatal projections are enriched onto GABAergic interneurons in striatum (Bevan et al., 1998; Mastro et al., 2014), which widely influence striatal output. Data from intracellular recordings of medium spiny neurons (MSNs) firing in vivo suggest that individual action potentials are evoked by disinhibition, the transient drop in powerful synaptic inhibition from fast-spiking interneurons (FSIs) (Wilson, 2009). Pauses in FSI spiking might arise through several pathways, but the pallidostriatal pathway represents an intriguing candidate because it may modulate FSIs independently of MSNs, unlike excitatory inputs, which target both cell populations (Wilson, 2009). This function of the pallidostriatal pathway is speculative, but opposing GPe and FSI activity in rats performing a delayed choice task (Gage et al., 2010) suggests a role for the pallidostriatal pathway during certain phases of behavioral selection.
We hypothesize that, under DD conditions, the influence of the pallidostriatal pathway on FSIs becomes a critical component of a positive feedback loop, also involving enhancement of connectivity from FSI to indirect-pathway MSNs (iMSNs) (Gittis et al., 2011), which can generate or amplify pathological synchrony and rhythmicity. To test this idea, we recorded the synaptic strength of pallidostriatal projections onto FSIs and MSNs in the striatum of acute slices from control and DD mice and then used these data in the construction of a conductance-based computational model of the pallidostriatal loop. Although anatomical studies have described a subset of GPe neurons that project to both FSIs and MSNs (Sato et al., 2000; Mallet et al., 2012; Abdi et al., 2015; Dodson et al., 2015; Fujiyama et al., 2015; Hernández et al., 2015), our synaptic data reveal that GPe projections onto MSNs are weak relative to their projections onto FSIs, suggesting a predominantly GPe-FSI-MSN architecture for the functional pallidostriatal circuit. In our model of this circuit, GPe-FSI projections significantly impact the temporal organization of striatal activity, including pauses in FSI spiking, in a way that is essential for the emergence or amplification of β oscillations under network conditions simulating the DD state. These results suggest a novel circuit mechanism through which the pallidostriatal pathway shapes basal ganglia activity and promotes pathological rhythmicity in disease.
Materials and Methods
Animal surgery and viral injections.
Injections of adeno-associated virus 2 (AAV2), human synapsin-1 gene promoter (hSyn), channelrhodopsin 2 (ChR2)-EYFP, or -mCherry (University of North Carolina Vector Core Facility) were made into the GPe of 4- to 5-week-old mice of either sex. To facilitate targeted recordings of interneurons, Lhx6-GFP mice or PV-Cre mice (injected in striatum with cre-dependent AAV5- EYFP or mCherry) were used. Anesthesia was induced using 50 mg/ml ketamine and 15 mg/ml xylazine and maintained throughout surgery using 2% isoflurane. Mice were placed in a stereotaxic frame (David Kopf Instruments), the scalp was opened, and bilateral holes over GPe were drilled in the skull (0.17 mm anterior, 2.12 mm lateral from bregma); 200 nl of virus was injected with a Nanoject (Drummond Scientific) through a pulled glass pipette (30 μm tip diameter; 3.75 mm from the surface of the brain). Mice were unilaterally DD via injection of 1 μl of 6-OHDA into the medial forebrain bundle (relative to bregma, −0.5 mm anterior and 1.1 mm lateral, 5.1 mm from the surface of the brain). Animals were housed for at least 2 weeks after injection for recovery and viral expression before recordings were conducted.
Electrophysiological recordings.
Parasagittal sections (300 μm thickness) containing the striatum and GPe were prepared from brains of 6- to 8-week-old mice of either sex that received ChR2 viral injections at least 2 weeks earlier. Slices were prepared with a LeicaVT1000S vibratome in carbogenated HEPES ACSF containing the following (in mm): 20 HEPES, 92 NaCl, 1.2 NaHCO3, 2.5 KCl, 10 MgSO4, 0.5 CaCl2, 30 NaH2PO4, 25 glucose, 5 sodium ascorbate, 2 thiourea, and 3 sodium pyruvate, pH 7.25. Slices were allowed to recover for 15 min at 33°C in a chamber filled with N-methyl-D-glucamine-HEPES recovery solution (in mm): 93 N-methyl-D-glucamine, 2.5 KCl, 1.2 NaH2PO4, 30 NaHCO3, 20 HEPES, 25 glucose, 10 MgSO4, 0.5 CaCl2, 5 sodium ascorbate, 2 thiourea, and 3 sodium pyruvate. Slices were then held at room temperature for at least 1 h before recording in a holding solution that was similar to the HEPES cutting solution but with 1 mm MgCl2 and 2 mm CaCl2. Recordings were made at 33°C in carbogenated ACSF (in mm) as follows: 125 NaCl, 26 NaHCO3, 1.25 NaH2PO4, 2.5 KCl, 12.5 glucose, 1 MgCl2, and 2 CaCl2. Data were collected with a MultiClamp 700B amplifier (Molecular Devices) and ITC-18 analog-to-digital board (HEKA) using Igor Pro software (Wavemetrics) and custom acquisition routines (Recording Artist; Richard C. Gerkin, Phoenix). Current-clamp recordings were filtered at 10 kHz and digitized at 40 kHz; voltage-clamp recordings were filtered at 2 kHz and digitized at 10 kHz. Electrodes were made from borosilicate glass (pipette resistance, 2–6 mΩ). The internal solution for voltage-clamp recordings consisted of the following (in mm): 120 CsMeSO3, 15 CsCl, 8 NaCl, 0.5 EGTA, 10 HEPES, 2 Mg-ATP, 0.3 Na-GTP, and 5 QX-314. The internal solution for current-clamp recordings consisted of the following (in mm): 130 KMeSO3, 10 NaCl, 2 MgCl2, 0.16 CaCl2, 0.5 EGTA, 10 HEPES, 2 Mg-ATP, and 0.3 NaGTP.
Immunohistochemistry.
Slices that were used for data collection were fixed and resectioned at 30 μm for further immunohistochemistry and processing. Tyrosine hydroxylase was stained using rabbit anti-tyrosine hydroxylase primary antibody (1:1000, Pel-Freez) incubated for 24 h at room temperature. Sections were then incubated in Alexa-Fluor-647 anti-rabbit (1:500, Invitrogen) for 1.5 h at room temperature. Quantification of dopamine remaining was achieved by comparing normalized fluorescence in the depleted and nondepleted hemispheres.
Assessment of ChR2 viral spread was completed by enhancing and imaging ChR2-EYFP or by imaging ChR2-mCherry without enhancement necessary. ChR2-EYFP was enhanced with chicken anti-GFP (1:1000, Aves Laboratory) incubated for 24 h at room temperature. Sections were then incubated in AlexaFluor-488 anti-chicken (1:500, Invitrogen) for 1.5 h at room temperature.
GPe viral targeting quantification.
All processing of images and quantification were performed in ImageJ (National Institutes of Health). To quantify GPe fill, images were thresholded to the average background pixel intensity within GPe. The “Fill Holes” feature was applied to binary images to account for false negative pixels due to naturally occurring striation in the tissue. Mean pixel intensity of three 10 ×10 pixel squares within GPe of each section was averaged to calculate average background pixel intensity. Measuring background level of fluorescence within GPe insured that any fluorescent collateral fibers would not be included in the quantification of viral soma expression. The number of pixels within GPe above threshold was expressed as a percentage of the total number of pixels occupied by GPe in the image to yield the percentage fill. Percentage fill values were averaged across 2–3 slices per animal.
Biophysical network model.
We developed a computational representation of the pallidostriatal circuit by combining published, single-compartment models of three cell types: striatal MSNs (Mahon et al., 2000) and FSIs (Golomb et al., 2007) and GPe neurons (Fujita et al., 2012). In each of these models, each cell's membrane potential V (mV) is governed by a differential equation specified in a conductance-based framework as follows:
 |
where Cm is membrane capacitance (μF/cm2) and each Ix is a voltage-dependent intrinsic or synaptic current (μA/cm2) in the set of currents X. Each intrinsic current is governed by the following equation:
 |
where gx is maximal conductance (mS/cm2), Vx is the reversal potential for the ion(s) in the current, and m and h are open fractions of voltage-dependent activation and inactivation gates, respectively, with integer exponents p and q. If a cell does not have an activation or inactivation gate, the corresponding m or n is set to 1. Otherwise, states of gates are governed by the following equation:
 |
(and equivalently for hx) where τmx is the time constant for the gate and mx∞ is the voltage-dependent steady-state value for mx given by the Boltzmann equation as follows:
 |
(and equivalently for hx) with constants θmx and kmx., τmx is given by the following:
 |
(and equivalently for hx) with constants τmx0, τmx1, φ, σmx0, and σmx1. In the MSN model with no σmx1 parameter, the term including this value was set to 0.
Each published model includes a set of experimentally observed intrinsic currents, with parameters based on experimental findings, such that voltage traces produced by the models match experimental data (see Fig. 2C). Parameters are listed in Table 1.
Figure 2.

Conductance-based GPe-FSI-MSN network models. A, Schematic of the conductance-based network model, built from published cell models (Table 1) connected synaptically with experimentally observed values for connection probabilities and strengths (Table 2). The models contained 40 MSNs, 8 GPe cells, and 8 FSIs. B, A DD network was created by doubling the number of connections from FSIs to MSNs. C, Responses of model neurons and experimentally recorded neurons to square depolarizing current injections. Scale bar, 100 ms.
Table 1.
Cellular parameters for each modeled neuron typea
| Current | V | gmax | Gate | θ | k | τ0 | τ1 | φ | σ0 | σ1 | min | |
|---|---|---|---|---|---|---|---|---|---|---|---|---|
| GPe | NaF | 50 | 50 | m | −39 | 5.0 | 0.028 | 0.028 | ||||
| h | −48 | 2.8 | 0.25 | 4.0 | −43 | 10 | −5.0 | |||||
| s | −40 | −5.4 | 10 | 1000 | −30 | 18.3 | −10 | 0.15 | ||||
| NaP | 50 | 0.1 | m | −57.7 | 5.7 | 0.03 | 0.146 | −42.6 | 14.4 | −14.4 | ||
| h | −57 | −4 | 10 | 17 | −34 | 26 | −31.9 | 0.154 | ||||
| Kv2 | −90 | 0.1 | m | −33.2 | 9.1 | 0.1 | 3.0 | −33.2 | 21.7 | −13.9 | ||
| h | −20 | −10 | 3400 | 3400 | 0.2 | |||||||
| Kv3 | −90 | 10 | m | −26 | 7.8 | 0.1 | 14 | −26 | 13 | −12 | ||
| h | −20 | −10 | 7.0 | 33 | 0 | 10 | −10 | 0.6 | ||||
| Kv4 | −90 | 3.0 | m | −49 | 12.5 | 0.25 | 7.0 | −49 | 29 | −29 | ||
| h | −83 | −10 | 15 | 100 | −83 | 10 | −10 | |||||
| KCNQ | −90 | 0.15 | m | −61 | 19.5 | 6.7 | 100 | −61 | 35 | −25 | ||
| CaH | 130 | 0.3 | m | −20 | 7.0 | 0.2 | 0.2 | |||||
| HCN | −30 | 0.1 | m | −76.4 | −3.3 | 0 | 3625 | −76.4 | 6.56 | −7.48 | ||
| SK | 0.4 | See Fujita et al. (2012) for Ca2+-dependent channel dynamics | ||||||||||
| Leak | −60 | 0.068 | ||||||||||
| MSN | Na | 55 | 35 | See Mahon et al. (2000) for parameters using channel opening and closing rate formulation | ||||||||
| K | −90 | 6 | ||||||||||
| Kir | −90 | 0.15 | m | −100 | −10 | 0.01 | ||||||
| Af | −73 | 0.09 | m | −33.1 | 7.5 | 1.0 | ||||||
| h | −70.4 | −7.6 | 25.0 | |||||||||
| As | −85 | 0.32 | m | −25.6 | 13.3 | 131.4 | −37.4 | 27.3 | ||||
| h | −78.8 | −10.4 | See Mahon et al. (2000) | |||||||||
| Krp | −77.5 | 0.42 | m | −13.4 | 12.1 | 206.2 | −53.9 | 26.5 | ||||
| h | −55.0 | −19.0 | See Mahon et al. (2000) | |||||||||
| NaP | 45 | 0.02 | m | −47.8 | 3.1 | 1.0 | ||||||
| NaS | 40 | 0.11 | m | −16.0 | 9.4 | 637.8 | −33.5 | 26.3 | ||||
| Leak | −90 | 0.075 | ||||||||||
| FSI | Na | 50 | 112.5 | m | −24.0 | 11.5 | 0 | |||||
| h | −58.3 | −6.7 | 0.5 | 13.5 | −60 | −12 | ||||||
| Kv3 | −90 | 225.0 | h | −12.4 | 6.8 | 0.087 | 11.313 | −14.6, 1.3b | −8.6, 18.7b | |||
| Kv1 | −90 | 0.1 | m | −50 | 20 | 2 | ||||||
| h | −70 | −6 | 150 | |||||||||
| Leak | −70 | 0.25 | ||||||||||
aParameters for model GPe (Fujita et al., 2012), MSN (Mahon et al., 2000), and FSI (Golomb et al., 2007) neurons, reflecting minor changes from the published model implemented to fit experimental data (see Materials and Methods). Blank spaces indicate that the variable's default value was used. V, Reversal potential of ion(s) permeable to channel (mV); gsyn, maximal channel conductance (mS/cm2); Gate, gating variable for which the following parameters are defined. θ and k, constants for determining voltage-dependent steady-state value of the gating variable (mV); τ0 and τ1, minimal and maximal time constants for the gating variable, respectively (ms, default value for τ0 = 0; when both τ0 and τ1 = 0, the gating variable's approach to steady state is instantaneous); φ, σ0, and σ1: constants determining the time course of voltage-dependent gating time constants (mV, default values are φ = 0, σ0 = σ1 = 1); min, lower bound of gating variable (default min = 0). Values without units are dimensionless.
bThis gating variable uses a time constant which is the product of two terms of the form found in Equation 1 (see Materials and Methods) (Golomb et al., 2007).
In the MSN model (Mahon et al., 2000) as originally published, some gating variable equations are presented in terms of voltage-dependent rates of channel opening and closing rather than a decay to steady state with a time constant, but this representation is mathematically equivalent to the one presented above. We altered the published model by reducing the reversal potential for the leak current to −90 mV based on more recent experimental findings (Gertler et al., 2008).
The GPe model (Fujita et al., 2012) includes incomplete inactivation of persistent and fast Na+, Kv2, and Kv3 channels and a calcium (Ca2+) dependent K+ channel that deviates from the above framework. To better match the model's published traces, we reduced the conductance of the KCNQ-type channel to 0.15 mS/cm2. In addition, to reduce computation time, we removed the s-gate of persistent Na+ channels and combined the fast and slow Kv4-type channels into a single channel covering their combined time constant ranges. Neither of these reductions had any effect on the qualitative behavior of the simulated GPe neurons.
In the FSI model (Golomb et al., 2007), the gating variable of the Kv3 channels uses a time constant that is the product of two terms of the form found in Equation 1. We made no changes to the published model and used the “delayed tonic firing” parameter set considered in Golomb et al. (2007).
We chose biologically realistic population proportions. MSNs make up at least 95% of all striatal cells (Kemp and Powell, 1971), approximately half of which are D2-expressing. Although both D1- and D2-MSNs send projections to GPe (Cazorla et al., 2014), the predominant striatal input to GPe is from D2-MSNs (Matamales et al., 2009). Furthermore, inhibition from FSIs following dopamine depletion occurs selectively onto D2 MSNs (Gittis et al., 2011), so only these MSNs were included in our model. We chose to simulate 40 D2-MSNs and 8 FSIs, a ratio of 5:1, which is approximately that seen in vivo (Gittis et al., 2010). Based on these numbers and the relative proportions of striatum to GPe (Oorschot, 1996), we chose to model 8 GPe cells.
The network architecture is shown in Figure 2A, B, with connection probabilities (CPre-Post, where Pre and Post indicate the presynaptic and postsynaptic cell type, respectively) given in Table 2. Specific connections between cells were established randomly such that each cell in a population receives an equal number of connections from a presynaptic population, given by the product of CPre-Post with the total number of cells in the presynaptic population. CMSN-MSN, CMSN-FSI, and CFSI-FSI were taken directly from published values (Gertler et al., 2008; Taverna et al., 2008; Gittis et al., 2010). A given GPe cell receives approximately one GPe connection for every eight MSN connections (Shink and Smith, 1995). We thus chose CMSN-GPe and CGPe-GPe to maintain this ratio, which slightly overestimates published values for CGPe-GPe (Bar-Gad et al., 2003; Bugaysen et al., 2013) while underestimating CMSN-GPe (Chuhma et al., 2011). There are sparse data on CGPe-FSI, but of GPe cells that project to striatum (the only GPe cells modeled here), 19%–66% of their synapses are on FSIs (Bevan et al., 1998). Because all recorded FSIs were innervated by GPe (see Fig. 1) and we do not model all GPe connections (such as those to SNr), we chose a CGPe-FSI such that CGPe-FSI/(CGPe-FSI + CGPe-GPe) fell near the upper bound of this range. When the GPe-MSN connections were included (see Fig. 4), CGPe-MSN was chosen to be the same as CGPe-FSI.
Table 2.
Connectivity parameters for each modeled connectiona
| Pre | Post | CPre-Post (%) | gsyn | a | b | Reference |
|---|---|---|---|---|---|---|
| GPe | FSI | 37.5 | 0.12 | 2 | 0.23 | Figure 1; Bevan, et al., 1998 |
| FSI | MSN | 37.5 (DD: 75) | 0.15 | 2 | 0.13 | Gittis, et al., 2010, 2011; Guzmán, et al., 2003 |
| MSN | GPe | 37.5 | 0.07 | 2 | 0.08 | Chuhma, et al., 2011; Shink and Smith, 1995; Miguelez, et al., 2012 |
| GPe | GPe | 25 | 0.1 | 2 | 0.08 | Bar-Gad, et al., 2003; Bugaysen, et al., 2013; Miguelez, et al., 2012 |
| FSI | FSI | 62.5 | 0.05 | 2 | 0.19 | Gittis, et al., 2010 |
| MSN | MSN | 35 | 0.09 | 2 | 0.1 | Gertler, et al., 2008; Taverna, et al., 2008; Guzmán, et al., 2003 |
| GPeb | MSN | 37.5 | 0.003 | 2 | 0.12 | Figure 1 |
| DD: 0.01 |
aModel synaptic parameters, taken directly from experimental data when possible and estimated based on related empirical data otherwise (see Materials and Methods). Pre and Post, Presynaptic and postsynaptic populations, respectively, for the described connection; CPre-Post, connection probability between the populations; gsyn, maximal synaptic conductance (mS/cm2); a and b, constants regulating neurotransmitter release and decay (ms). Values without units are dimensionless.
bThe GPe-MSN connection was only included in the model when explicitly noted (e.g., Fig. 4).
Figure 1.
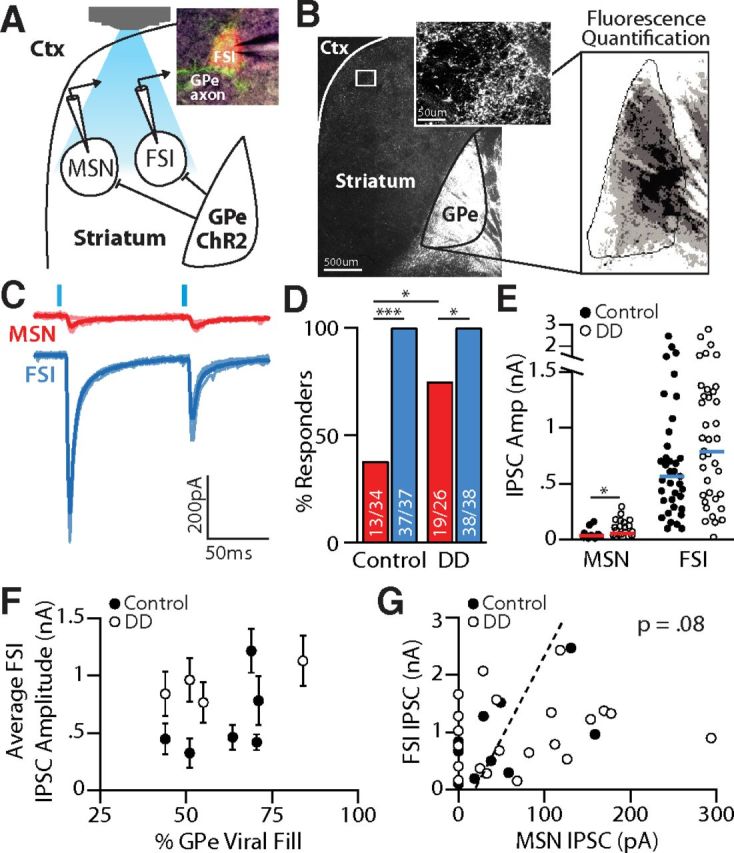
Pallidostriatal projections preferentially target interneurons. A, Schematic of experimental configuration. ChR2-EFYP was expressed in GPe. Pallidostriatal terminals were optically activated locally within striatum. Inset, Image of ChR2-EYFP-expressing pallidostriatal terminals (green) surrounding a striatal FSI (red) targeted for recording. B, Raw fluorescent (left) and thresholded (right) images of a sagittal mouse brain slice, showing spread of ChR2-EFYP expression. C, Maximal light-evoked IPSCs measured in a simultaneously recorded MSN (red) and FSI (blue). Responses were calculated as the average (thick line) across five trials (thin lines). D, Percentage of MSNs (red) and FSIs (blue), which showed a synaptic response to pallidostriatal stimulation in control and DD slices. A significantly greater percentage of FSIs showed responses compared with MSNs in both control (p < 0.0001) and DD conditions (p < 0.01). A significantly greater percentage of MSNs showed responses in DD compared with control (p < 0.01). E, Evoked responses were significantly larger in FSIs than in MSNs in both control and DD conditions (p < 0.00001). Horizontal lines indicate population medians. Median FSI response size did not differ significantly between control and DD conditions, whereas median response sizes from responding MSNs were significantly increased in DD (p ≤ 0.01). F, Median values (circles) and SEMs (error bars) of FSI-IPSCs recorded in each mouse, plotted as a function of the percentage GPe viral fill, assessed histologically (B). Variability in IPSC amplitudes did not correlate with the degree of viral fill. G, Scatter plot showing trending relationship of IPSC amplitudes between paired FSI and MSN recordings. *p < 0.01 (two-sample t test). ***p < 0.0001 (two-sample t test).
Figure 4.

GPe-MSN synapses are not strong enough to influence DD circuit dysfunction. A, Schematic showing the addition of GPe-MSN connections into the DD circuit. B, Average power spectral densities calculated in each cell population under DD conditions (green) or DD conditions with GPe-MSN connections added (gray). C, Total β power (13–30 Hz) in each cell population in DD and DD plus GPe-MSN networks. GPe-MSN connections did not significantly alter the β power in any cell populations (all p > 0.05). D, Average spike synchrony in each cell population in DD and DD plus GPe-MSN networks. GPe-MSN connections slightly and significantly altered the spike synchrony in MSNs (p < 0.05) but did not affect spike synchrony in GPe or FSIs (p > 0.05). Comparisons between conditions were assessed using two sample t tests on raw power or synchrony values. Plots represent average values ± SEM. *p < 0.05 (two-sample t test).
Each inhibitory synaptic current in the model is given by the following equation:
where V is the voltage of the postsynaptic cell and VCl is the reversal potential of chloride (−80 mV), the primary ion contributing to current flow through GABAergic channels. In Equation 2, s is a voltage-dependent synaptic gating variable governed by the following:
 |
where a and b are constants governing neurotransmitter release and decay, respectively, and H is a smooth, monotone-increasing approximation of the Heaviside step function. Simulations including axonal conduction delays showed that the qualitative activity of the model was no different from the model without synaptic delays (data not shown), so for simplicity, delays were not included. The parameters a, b, and gsyn for each type of synapse were calculated by matching simulated IPSCs to experimentally measured IPSCs in terms of decay time and maximum amplitude (Table 2). When unitary IPSC data were available (MSN-MSN: Guzman et al., 2003; Taverna et al., 2008; FSI-MSN: Guzman et al., 2003; Gittis et al., 2010; FSI-FSI: Gittis et al., 2010), we determined the single-synapse conductance for our model by multiplying the experimental unitary conductance by the ratio of the number of contacts from one presynaptic cell to one postsynaptic cell in vivo (Guzman et al., 2003) divided by the number of contacts in our model. For IPSCs based on optical stimulation (MSN-GPe: Miguelez et al., 2012; GPe-FSI, GPe-MSN: see Fig. 1; GPe-GPe: Miguelez et al., 2012), we calculated the total conductance and divided by the number of contacts in our model.
Excitation to striatum (e.g., from cortex) and to GPe (e.g., from the subthalamic nucleus) is modeled as an ungated channel with current governed by the following:
 |
where V is the postsynaptic voltage and Vcat is a cation reversal potential of 0 mV. Simulations used passive excitation, except when otherwise noted, with constant gex chosen to best approximate published in vivo firing rates (Berke, 2008; Gage et al., 2010; Kita and Kita, 2011). In simulations including oscillatory excitatory inputs, gex is governed by the following:
where gmin is tuned to produce experimentally observed firing rates, f is the frequency of the input in Hz, and σ is a random variable that simulates random channel fluctuations, drawn at each time step from the following distribution:
 |
chosen for its symmetry and accumulation of mass near 0.
Dopamine depletion was simulated in the model by (1) doubling the FSI- D2 MSN connection probability (Gittis et al., 2011) and (2) increasing MSN firing rate (Fino et al., 2007; Azdad et al., 2009; Kita and Kita, 2011) through an increase of excitatory current conductance (gex) of MSN neurons.
The model was simulated in XPPAUT (Ermentrout, 2002). Differential equations were solved numerically using Runge-Kutta integration with an adaptive time step (QRK method in XPPAUT) sampled every 0.1 ms. Unless otherwise noted, models were run for 9500 ms of simulated time and the first 500 ms were discarded. For each set of results reported, three sets of connectivity matrices were generated, the model was simulated three times with each set of matrices, and results were averaged. Initial conditions for channel gating variables were set within small neighborhoods of their rest values, and an initial condition for each cell's voltage was chosen randomly between −80 mV and −40 mV, independently across runs. For comparisons between healthy and DD conditions, the same random seed was used in each pair of trials compared.
Model analysis.
Results were exported for analysis in MATLAB (The MathWorks, version 2014b). Spikes were detected from traces with a threshold voltage of 0 mV. Local field potentials (LFPs) from a population were modeled as a low-pass filtered (250 Hz cutoff) average of the population voltage. Power spectral densities of LFPs were calculated by computing the squared Fast Fourier Transform of the LFP. Spectrograms were generated using the MATLAB function specgram with a window size of 4098 samples and a sliding window overlap of 3483 samples. Power within particular frequency bands was calculated from power spectra using the MATLAB function bandpower with a broadband range of 13–30 Hz for β frequency and 40–80 Hz for γ frequency. Assessment of power enhancement by applied oscillatory stimuli was computed within a narrow frequency band around the stimulus frequency: 3–13 Hz for θ, 20–30 Hz for β, and 55–65 Hz for γ. Differences between the control and DD circuit's amplification of applied oscillations were quantified by subtracting the control power in the population of interest from its power in DD.
Spike synchrony was computed by modifying the voltage synchrony metric presented by Golomb and Rinzel (1993), using counts of spikes binned into 15 ms bins. With ai(t) defined as the binned spike count over time for cell i, we compute the within-cell variance σi2 and population variance σpop2 as follows:
 |
where a(t) = (a1(t) + … + aN(t))/N for a population of N neurons and the brackets denote averaging over our total simulation time, to find the synchrony measure χ:
 |
When classifying spikes as “synchronous” or “asynchronous,” synchronous spikes were defined as spikes accompanied by at least three other spikes from the same population within 10 ms on either side, and asynchronous spikes were all spikes that did not meet this criterion. We computed spike-triggered spike latency probability distributions by locking onto spikes from a presynaptic population and computing the latency to spiking of each neuron in a population downstream (connected either monosynaptically or disynaptically). Pauses in FSIs were defined as epochs of at least 20 ms during which at least 6 of 8 FSIs were silent. Power spectral densities of spikes and pauses were computed as above on binary vectors over time, where a 1 is placed at the onset of a spike or throughout a pause.
Instantaneous firing rate for a single cell was calculated by convolving its spike train (with each spike treated as a δ function) with a scaled Gaussian with 5 ms SD and peak equal to 1. Instantaneous population firing rate plots were calculated by averaging the instantaneous firing rates of all cells within a population.
Statistical methods.
All statistical comparisons on electrophysiology data were performed using the Wilcoxon Rank Sum test because the data were not normally distributed. Comparisons of the percentages of responding cells were conducted using a Fisher's exact test. Data from the model were compared using one-way ANOVA and two-tailed t tests when indicated.
Results
Pallidostriatal projections are selective for interneurons
To investigate the synaptic projections from GPe to striatum, inhibitory currents were recorded in different striatal cell types in response to optical activation of GPe terminals (Fig. 1A). Recordings were conducted in slices from control and unilaterally DD animals 2 weeks after 6-OHDA injection into the medial forebrain bundle. To achieve widespread ChR2 expression in GPe neurons, mice were stereotaxically injected at the time of dopamine depletions with AAV2 carrying ChR2 under the synapsin promoter (Fig. 1B). Viral spread was quantified and slices were excluded if <40% of the GPe was infected (range, 44%–84%; mean, 61.3%) or there was >100 μm spread into the striatum (Fig. 1B, right; see Materials and Methods). Variability in infection volume did not correlate with variability in response sizes (r(9) = 0.22, p = 0.39; Fig. 1F).
To target different striatal cell populations, recordings were performed in transgenic mouse lines that label GABAergic interneurons in striatum (see Materials and Methods). Most recordings were conducted on simultaneously recorded pairs of interneurons and MSNs (Fig. 1C), but in some instances, recordings were done on sequentially patched pairs of neurons within 100 μm of each other. Neurotransmitter release from GPe terminals in the field of view was evoked with 1 ms pulses of white light, filtered through a 470 nm filter cube with a 40 nm bandwidth. Maximal light-evoked IPSCs were observed in all FSIs sampled and were similarly large in both control and DD conditions (control: 566 ± 560 pA, n = 37; DD: 844 ± 647 pA, n = 39; Wilcoxon Rank Sum test, p = 0.12; Fig. 1E). In contrast, responses in MSNs were only observed in 38% (13 of 34) of MSNs sampled in control slices, and 73% (19 of 26) of MSNs sampled after DD. The increase in fraction of responsive MSNs in DD slices was significant (Fisher's exact test, p < 0.01; Fig. 1D). In MSNs where responses were observed, the average IPSC amplitude was significantly larger after DD compared with control (control: 28 ± 44 pA, n = 13; DD: 108 ± 73 pA, n = 21; Wilcoxon Rank Sum test, p < 0.01; Fig. 1E), but still smaller than IPSCs recorded in FSIs in both conditions (p < 0.00001).
As shown in Figure 1E, there was a tremendous amount of variability in the amplitude of maximally evoked IPSCs. We attribute this to biological variability because within-neuron responses were consistent across trials (Fig. 1C) and the range of response variability was consistent from animal to animal (Fig. 1F). Biological variability in response amplitude might reflect the clustered distribution of GPe projections in striatum (Fig. 1B, inset), which is supported by our observations that FSIs with the largest responses tended to be near MSNs that also exhibited relatively large responses (Fig. 1G; p = 0.08).
In summary, our synaptic data confirm previously published anatomical work showing that pallidostriatal projections are highly enriched onto GABAergic interneurons (Bevan et al., 1998). Indeed, IPSCs were also observed reliably in persistent low-threshold spiking interneurons (159 ± 395 pA, n = 11), but these projections are not further characterized here. In contrast, pallidostriatal projections onto MSNs were synaptically weak, a surprising result given recent descriptions of an anatomically specialized subset of “arkypallidal” GPe neurons that densely project to striatum and target both MSNs and GABAergic interneurons (Mallet et al., 2012; Abdi et al., 2015; Dodson et al., 2015). A summary of the synaptic properties recorded at each synapse in healthy and DD conditions is provided in Table 3.
Table 3.
Properties of synaptic recordings in healthy and dopamine depleted conditionsa
| MSN |
FSI |
PLTS |
||||
|---|---|---|---|---|---|---|
| Control | DD | Control | DD | Control | DD | |
| N | 34 | 26 | 37 | 38 | 11 | NA |
| Max IPSC (pA) | 0 ± 39.5b,c,e | 57.9 ± 80.8b,d | 565.9 ± 560.2c,f | 843.8 ± 643.8d | 159.0 ± 395.5e,f | NA |
| Min IPSC (pA) | NA | NA | 28.1 ± 54.1 | 29.6 ± 12.0 | NA | NA |
| Input Resistance (MΩ) | 200.2 ± 97.7 | 191.6 ± 221.5 | 134.9 ± 55.2 | 184.2 ± 79.4 | 1328.5 ± 631.2 | NA |
| Decay constant (ms) | 7.0 ± 2.5 | 7.7 ± 3.0g | 4.5 ± 1.8 | 5.0 ± 6.0g | 8.0 ± 0.3 | NA |
aProperties of light-evoked synaptic responses from all recorded striatal cells. Values are median ± SD. PLTS, Persistent low-threshold spiking interneurons; NA, not applicable.
b,c,d,e,f,gLike letters indicate a significant difference of p < 0.05 (Wilcoxon Rank Sums Test).
Construction of a biophysically detailed model of the GPe-FSI-MSN loop
GPe has been implicated in promoting network synchrony and oscillations in the basal ganglia of human patients and in animal models of PD (Hutchison et al., 1994; Nini et al., 1995; Bergman et al., 1998; Brown et al., 2001; Magill et al., 2001; Mallet et al., 2008a; Kuhn et al., 2009), but the cellular mechanisms through which this occurs remain unknown. Much work has focused on GPe's reciprocal connections with the STN, but a number of other mechanisms are also likely to be involved, including GPe's reciprocal connections with striatum.
The striatum provides the major inhibitory input to GPe, and synchrony across MSNs can contribute to pathological rhythmicity in GPe (Kita and Kita, 2011; Yim et al., 2011). By comparison, the reciprocal effects of feedback inhibition from GPe to striatum have been underexplored, despite the fact that its enrichment for striatal interneurons makes it a strong candidate to influence synchrony and rhythmicity throughout the circuit (Gage et al., 2010; Gittis et al., 2011).
To investigate the role of GPe projections onto FSIs in shaping striatal activity and the emergence or amplification of β oscillations, we created a 56-cell network model (8 GPe, 8 FSI, 40 MSN) composed of previously published, conductance-based single-cell models for GPe neurons (Fujita et al., 2012), MSNs (Mahon et al., 2000), and FSIs (Golomb et al., 2007) (Fig. 2A). Neurons in the model were connected using experimentally observed connection probabilities and synaptic parameters (Table 2). To mimic synaptic changes in the network observed following DD, synaptic connections between FSI-MSN were doubled (from 37.5% to 75%) (Gittis et al., 2011), but GPe-FSI (Fig. 1) and MSN-GPe (Miguelez et al., 2012) were not changed (Fig. 2B).
To confirm that our single-cell model outputs were consistent with experimental observations, we compared their firing responses to square depolarizing current steps with those measured experimentally (Fig. 2C). GPe neurons fired spontaneously and responded quickly to square pulses with increases in firing rate (Fig. 2C). In contrast, FSIs and MSNs did not fire spontaneously but fired in response to depolarizing inputs. FSIs responded with an initial spike and a brief period of subthreshold membrane oscillations followed by sustained, repetitive firing, often with a minimum firing rate of >40 Hz (Fig. 2C). MSNs also exhibited a delay between depolarization and firing onset (Fig. 2C), most likely due to outwardly rectifying K+ currents present in these neurons (Surmeier et al., 1991; Nisenbaum et al., 1996; Wilson and Kawaguchi, 1996; Wolf et al., 2005).
GPe-FSI-MSN loop is sufficient to produce β under DD conditions
To study the effects of dopamine loss on the dynamics of the GPe-FSI-MSN loop, we simulated network activity in control and DD conditions. The conductance (gex) of a passive excitatory channel (see Materials and Methods) was tuned in each population to generate average firing rates that match experimentally recorded values in vivo (Berke, 2008; Gage et al., 2010; Kita and Kita, 2011) (Fig. 3A). MSNs fired at 2.0 ± 0.24 Hz in control and 5.0 ± 0.63 Hz in the DD model (p < 0.0001; Fig. 3B) (Fino et al., 2007; Azdad et al., 2009; Kita and Kita, 2011). GPe neurons fired at 24.5 ± 1.14 Hz in control and 18.9 ± 0.87 Hz in the DD model (p < 0.0001; Fig. 3B) (Boraud et al., 2001; Kita and Kita, 2011). FSIs fired at 21.4 ± 0.75 Hz in control and 23.7 ± 0.69 Hz in the DD model (p < 0.0001; Fig. 3B) (Hernández et al., 2013).
Figure 3.

GPe-FSI-MSN loop enhances synchrony and β oscillations under DD conditions. A, Output of the model for each cell type. Top, Membrane voltage traces from individual cells. Bottom, Average low-pass filtered voltage trace across all neurons within a population (“pseudo-LFP”). B, Average firing rates for each cell population under control (black) and DD (green) conditions. Values were averaged across the output of nine runs for each condition (three runs for each of three connectivity matrices). C, Top, Spike rasters showing the timing of action potentials across all cells in each population, under control and DD conditions. Green shaded areas represent example periods of spike synchrony. Bottom, Corresponding pseudo-LFPs calculated during the same epochs shown above in rasters. D, Average spike synchrony for each cell population across nine runs of a control (black) and DD network (green). All cell populations showed a significant increase in spike synchrony in DD. E, Average power spectral densities computed from pseudo-LFPs (smoothed for display purposes) across nine runs of a control (black) and DD network (green). Note the increase in β activity (13–30 Hz, dashed lines) in DD for each population. F, All cell populations showed a significant increase in β power. *p < 0.05 (two-sample t test). ***p < 0.0001 (two-sample t test). Group values are mean ± SEM.
To evaluate the firing dynamics of single neurons, raw voltage traces were analyzed to determine the spike times of single action potentials (Fig. 3A, top). To evaluate population activity as a whole, voltage traces in each neuron were low-pass filtered (250 Hz cutoff), and the results were averaged across neurons to obtain what we called a pseudo-LFP (Fig. 3A, bottom). The pseudo-LFP does not accurately represent extracellular LFPs recorded in vivo, but it captures subthreshold activity and is therefore a suitable signal with which to assess oscillatory activity.
In the control network, firing of individual neurons was largely asynchronous across all three neuronal populations despite their synaptic interactions. Under DD conditions, epochs of synchronous activity emerged, as seen in DD animal models and PD patients (Hammond et al., 2007; Mallet et al., 2008b; Kuhn et al., 2009) (Fig. 3C). To quantify synchrony, we assessed the proportion of neurons spiking within specified time bins for each population (see Materials and Methods) and observed a significant increase in spike synchrony for each neuronal population in the DD network (GPecontrol: 0.14 ± 0.045, GPeDD: 0.24 ± 0.01, p < 0.00001; MSNcontrol: 0.046 ± 0.015, MSNDD: 0.124 ± 0.045. p < 0.00001; FSIcontrol: 0.167 ± 0.021, FSIDD: 0.181 ± 0.48, p < 0.05; Fig. 3D).
To determine whether the observed increases in synchrony were accompanied by changes in the degree or frequency of rhythmicity within the network, we constructed power spectra for the pseudo-LFPs from each population in the control and DD networks (Fig. 3E). In the control network, spectral power in GPe was low, with the exception of a small peak at 38 Hz, in the range of high β/low γ (Fig. 3E). In contrast, GPe in the DD model showed β frequency activity (3.04 ± 1.68 × 10⁹ V2/Hz) that was ninefold greater than in control (0.65 ± 0.24 × 10⁹ V2/Hz, p < 0.0001; Fig. 3E,F), with a peak centered at 23 Hz.
A significant increase in spectral power in the β frequency range was also observed in MSNs and FSIs in the DD network. While MSNs showed some β activity in control (1.24 ± 0.27 × 10⁹ V2/Hz), consistent with experimental findings (Courtemanche et al., 2003), they showed significantly more β activity in the DD model (3.16 ± 0.93 × 10⁹ V2/Hz, p < 0.0001; Fig. 3E,F). FSIs also showed a significant increase in β range activity in the DD model (0.60 ± 0.12 × 10⁹ V2/Hz) compared with control (0.53 ± 0.05 × 10⁹ V2/Hz, p < 0.01; Fig. 3E,F), but this effect was small. Together, these results suggest that the intrinsic dynamics of the GPe-FSI-MSN loop are sufficient to generate substantial β oscillations. Notably, prominent β oscillations did not emerge in the control network, suggesting that pallidostriatal circuit dynamics specifically in DD are necessary for increased spike synchrony and β oscillations.
One of the surprising aspects of these results was that β oscillations were propagated throughout the circuit in DD despite the fact that the FSI population, a major circuit node, did not display strong β activity. Indeed, although some β power was observed in the FSI population, most power in their spectrum occurred within the γ frequency range (40–80 Hz), centered around 46.5 Hz (Fig. 3E). This property of the FSI population is consistent with experimental findings showing that FSIs resonate at γ frequency (Berke, 2009; Cardin et al., 2009; Sohal et al., 2009; van der Meer and Redish, 2009). γ power was also observed to some degree in the MSN population following DD, consistent with the findings of Lemaire et al. (2012).
GPe-MSN connections do not affect model rhythmicity
While GPe synapses onto MSNs are much weaker than those onto FSIs, their strength shows a small but significant increase in DD. To test whether these synapses affect the dynamics of the pallidostriatal model in DD, we added GPe-MSN connections to the DD model using experimentally derived parameters (Fig. 4A; Table 2). The addition of GPe-MSN connections in the DD model caused no significant change (p > 0.05) in the β bandpower in any cell population (GPe, 2.48 ± 0.54; FSI, 0.61 ± 0.28; MSN, 2.87 ± 0.29 × 10⁹ V2/Hz; Fig. 4B,C). Spike synchrony was similarly unaltered from the normal DD model in GPe (0.21 ± 0.03, p = 0.26) and FSIs (0.17 ± 0.01, p = 0.92) and was slightly but significantly decreased in MSNs (0.10 ± 0.01, p < 0.05; Fig. 4D). Adding GPe-MSN connections into the control model similarly had very little effect on its dynamics (data not shown).
These data suggest that the GPe-MSN synapses, although strengthened in DD, do not have a large effect on β or spike synchrony in the control or DD state. As predicted based on our physiology data (Fig. 1), the pallidostriatal projections to FSIs, but not to MSNs, are important for the circuit dynamics studied here.
The GPe-FSI projection significantly enhances synchrony and is necessary for β oscillations
To determine the role of GPe input to FSIs in the development of altered activity exhibiting β oscillations in the DD network, we replaced GPe input with randomly timed inhibitory inputs to FSIs (Fig. 5A). These random inhibitory stimuli maintained the overall amount of inhibition onto FSIs, but with timing decoupled from the activity of GPe neurons. This disruption of the GPe-FSI projection largely prevented β oscillations from developing in the DD network in all cell populations (Fig. 5B). In GPe, total β bandpower was 4.7-fold higher in the complete DD network compared with control, but only 2.3-fold higher with a less defined peak when GPe-FSI was disrupted (1.47 ± 0.66 × 10⁹ V2/Hz, p < 0.00001; Fig. 5C, purple). The mechanism driving residual β in the absence of GPe-FSI is not clear but might be related to residual effects of FSI γ in the network (see Discussion). In MSNs, disrupting the GPe-FSI connection reverted the 2.6-fold increase in β power seen in the DD network to control level (1.22 ± 0.33 × 10⁹ V2/Hz, p < 0.00001; Fig. 5C, red). Similarly, the increase in β power in FSIs in the DD network, although small, was also reversed by disrupting GPe-FSI (0.40 ± 0.45 × 10⁹ V2/Hz, p < 0.00001; Fig. 5C, blue). In contrast, γ oscillations were relatively unaffected by this manipulation, demonstrating that disruption of the GPe-FSI projection does not simply eliminate rhythmicity in the network altogether, but rather specifically reduces β frequency oscillations.
Figure 5.
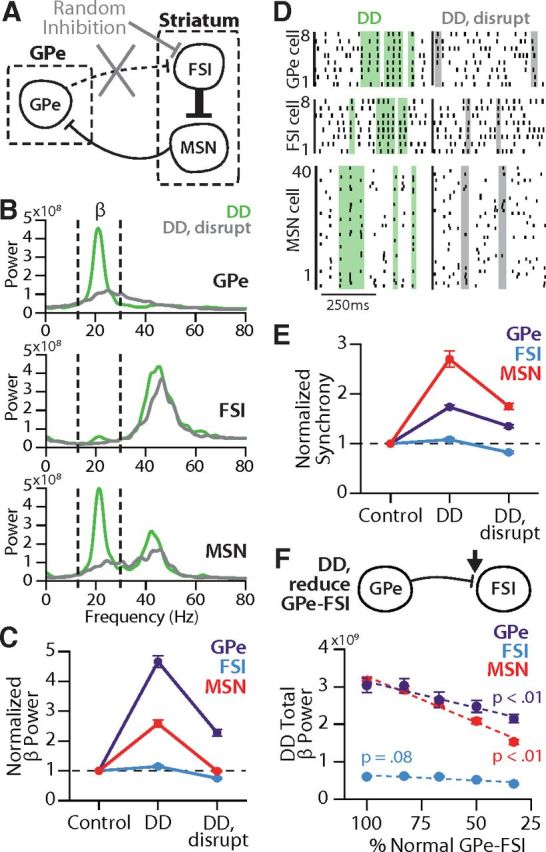
GPe-FSI connection is necessary for β activity in DD. A, Schematic showing how GPe-FSI connections were replaced with randomly timed inhibitory inputs at the same frequencies. B, Average power spectral densities calculated in each cell population under DD conditions (green) or DD conditions with GPe-FSI disrupted (gray). Power is in units of 1 × 10⁸ V2/Hz. C, β power (normalized to control) in each cell population in DD and DD disrupted networks. GPe-FSI disruption caused a reduction in β power in all cell populations (p < 0.0001). D, Representative spike rasters for each cell population firing in a DD or DD disrupted network. Shaded areas represent example periods of spike synchrony. E, Average spike synchrony (normalized to control) in each cell population in DD and DD disrupted networks. GPe-FSI disruption caused a reduction in synchrony in all cell populations (p < 0.0001). F, Top, Schematic representation of simulations of a DD network, in which the GPe-FSI connection was kept intact but synaptic conductance values were reduced. Bottom, β power in each cell population in a DD network, with diminishing values of GPe-FSI conductance. Reducing the strength of the GPe-FSI synapses was significantly correlated with a reduction in total β bandpower in GPe and MSNs (p < 0.01). Comparisons between conditions were assessed using two sample t tests on raw power or synchrony values. Plots represent average values normalized to control (C, E) or average raw power values (F) ± SEM.
DD-induced spike synchrony also decreased in all populations when the GPe-FSI connection was disrupted (GPe, 0.18 ± 0.06; FSI, 0.14 ± 0.04; MSN, 0.08 ± 0.02; p < 0.001; Fig. 5D,E). FSI synchrony decreased to lower than control levels (p < 0.001), indicating that GPe input to FSIs not only is essential for β oscillations, but also serves to synchronize FSIs (Fig. 5E, blue). Interestingly, while MSNs retained significant synchrony under disruption of GPe-FSI, consistent with previous results that the FSI-MSN connection by itself is capable of increasing synchrony in MSNs in DD (Gittis et al., 2011), its synchrony was only approximately half of that seen with GPe-FSI intact, highlighting another way in which the pallidostriatal influence permeated the DD network (Fig. 5E, red). Similarly, GPe synchrony remained significantly greater than control but with significantly reduced magnitude (p < 0.001; Fig. 5E, purple), suggesting that increased MSN synchrony is a major factor in the synchrony of GPe activity. Together, these results suggest that GPe input to FSIs is necessary for β oscillations in the DD circuit and that this effect may be mediated in part through its contributions to the enhancement of synchronization throughout the circuit.
It is possible that these reductions in β power and synchrony are due not to the disrupted GPe-FSI connection but rather due to the random inhibition on FSIs used to replace GPe. To rule out this possibility, we retained the GPe-FSI connection but incrementally reduced the conductance of the synapses. Unlike the GPe-FSI disruption, this manipulation did not include replacement of the inhibition onto FSIs; that is, it preserved input timing but weakened its magnitude. Decreases in GPe-FSI strength were significantly correlated with decreases in the total β power in GPe and MSNs (p < 0.01; Fig. 5F). The decrease in β as GPe-FSI strength is reduced is consistent with the loss of β activity when the GPe-FSI connection is completely disrupted, providing further evidence that the GPe-FSI connection is crucial for β oscillations in the DD network model.
Synchronous GPe spikes rhythmically synchronize FSI pauses and MSN spikes
To determine how the GPe-FSI pathway promotes β oscillations in the DD circuit despite the absence of high β power in the FSI population, we further investigated patterns in GPe spiking. GPe spike synchrony is increased in the DD model (Fig. 3C,D), which, we reasoned, might alter the effect that GPe input has on FSI activity. To explore this possibility, GPe spikes were separated into two categories: synchronous spikes, which occurred within 10 ms of spikes from at least three other GPe cells (Fig. 6A); and asynchronous spikes, which did not meet this criterion. As expected, there was a significantly higher proportion of synchronous spikes in GPe in DD (0.72 ± 0.10) than in control (0.55 ± 0.10, p < 0.00001; Fig. 6B).
Figure 6.
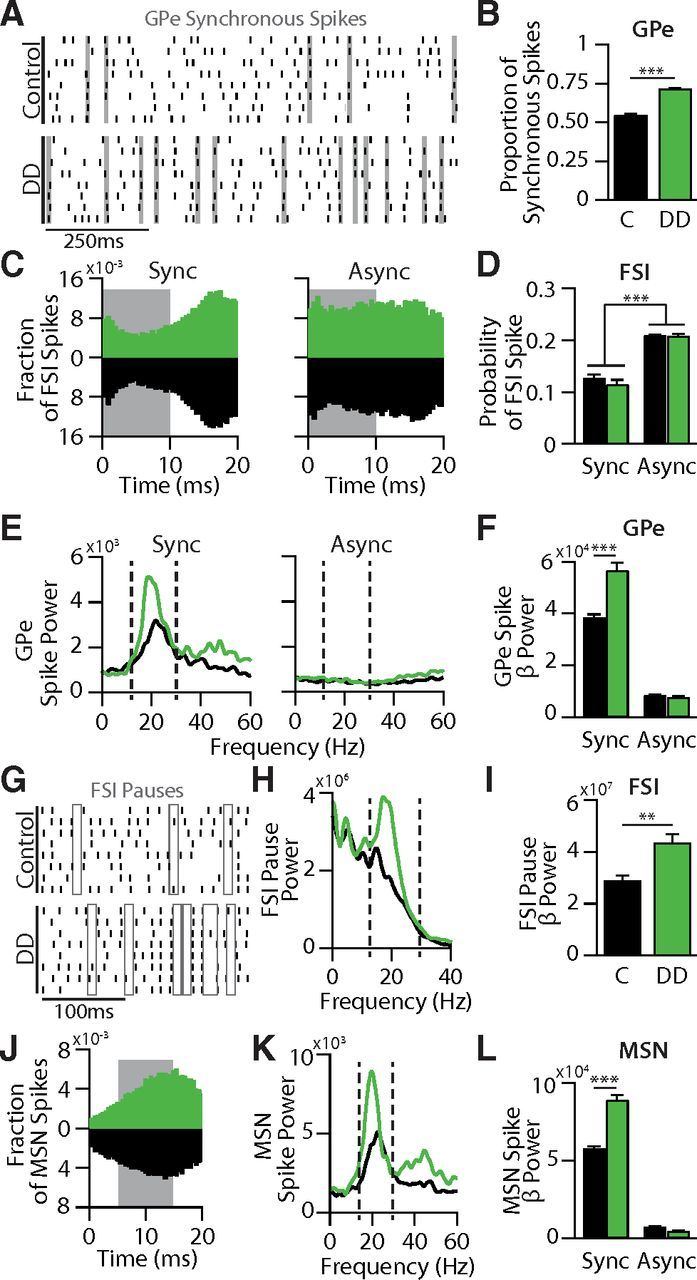
Rhythmicity in synchronous GPe spikes entrains FSI pauses and promotes β in the circuit. A, Representative spike rasters showing 1 s of firing across all 8 GPe neurons in a control and DD network. Gray shaded areas represent example periods of spike synchrony. B, Bar graph comparing the proportions of all GPe spikes that were classified as either synchronous or asynchronous. In DD networks, a significantly greater proportion of GPe spikes were synchronized than in control networks (p < 0.0001). C, Probability distributions of FSI spikes following synchronous and asynchronous GPe spikes in control (black) or DD networks (green). Gray boxes represent 10 ms window over which FSI spike probabilities were calculated. D, Bar graph comparing the spike probabilities of FSIs (gray boxes, C) immediately after synchronous or asynchronous GPe spikes. In both control and DD networks, FSI spike probabilities were significantly lower following synchronous GPe spikes than asynchronous GPe spikes (p < 0.0001). E, Average power spectral densities calculated from spike rasters of synchronous or asynchronous GPe spikes in control (black) or DD (green) networks. F, Bar graph quantifying average spectral power in the β frequency range (13–30 Hz, E, dashed lines) following synchronous or asynchronous GPe spikes in control (black) and DD (green) networks. β power after synchronous spikes was significantly greater in DD networks compared with control (p < 0.0001). G, Representative spike rasters showing 250 ms of firing across all 8 FSI neurons in a control and DD network. Open boxes represent examples of FSI pauses, which occur more frequently in DD than in control. H, Average power spectral densities calculated from FSI pauses in control (black) or DD (green) networks. I, Bar graph quantifying average spectral power in the β frequency range (13–30 Hz, H, dashed lines) of FSI pauses in control (black) and DD (green) networks. β power of FSI pauses was significantly greater in DD networks than in control (p < 0.001). J, Probability distributions of MSN spikes following synchronous GPe spikes in control (black) or DD networks (green). Gray box represents 10 ms window over which MSN spike probabilities were calculated. It was offset by 5 ms to account for the disynaptic connection from GPe to MSNs. K, Average power spectral densities calculated from synchronous MSN spikes in control (black) or DD (green) networks. L, Bar graph quantifying average spectral power in the β frequency range (13–30 Hz, K, dashed lines) of synchronous and asynchronous MSN spikes in control (black) and DD (green) networks. β power of synchronous MSN spikes was significantly greater in DD networks than in control (p < 0.0001). No β power was observed in asynchronous MSN spikes in either control or DD networks. Data are mean ± SEM. **p < 0.001 (two-tailed t test). ***p < 0.0001 (two-tailed t test).
This increase in synchronous GPe spikes in DD could have important implications for circuit dynamics if synchronous and asynchronous GPe spikes cause different responses in the FSI population. To establish how synchronous and asynchronous GPe spikes differentially affect FSI activity, we computed the probability distribution for the latency of an FSI's first spike (averaged over all FSIs) after each synchronous or asynchronous GPe spike (Fig. 6C). In both control and DD conditions, FSIs were significantly less likely to spike following a synchronous GPe spike (control: 0.13 ± 0.03, DD: 0.12 ± 0.03) than after an asynchronous GPe spike (control: 0.21 ± 0.003, DD: 0.21 ± 0.01, p < 0.00001) (Fig. 6D). Thus, the increase in synchronous GPe spikes in DD allows GPe to have a stronger functional influence on FSI activity.
To further explore this decrease in FSI spike probability, we investigated FSI population pauses, defined by a period of at least 20 ms during which at least 6 of the 8 FSIs did not fire (Fig. 6G). Consistent with our findings that synchronous GPe spikes more strongly reduce FSI firing probability and that there are more synchronous spikes in DD, we observed that there were significantly more FSI pauses in DD (178.3 ± 45.3) than in control (111.9 ± 25.08, p < 0.001).
The increase in functional strength of the GPe-FSI pathway in DD does not, on its own, explain why the GPe-FSI connection is necessary for the generation of β oscillations in the DD circuit. To assess the capacity of GPe spikes to promote oscillations, we calculated power spectra of synchronous and asynchronous GPe spikes (Fig. 6E). Synchronous GPe spiking occurs with strong β power in control (3.86 ± 0.30 × 10⁴ V2/Hz), and this effect is significantly enhanced in the DD circuit (5.69 ± 0.87 × 10⁴ V2/Hz, p < 0.0001; Fig. 6E,F). Asynchronous spiking in GPe does not show strong power in any frequency bands in control or DD (Fig. 6E). In order for rhythmic, synchronous spiking of GPe to influence downstream β activity, the induced FSI pauses must also occur at β frequency. Power spectra computed on the time series of FSI pauses (Fig. 6G,H) confirm that there is greater β range power in FSI pauses in DD (4.38 ± 0.96 × 10⁷ V2/Hz) than in control (2.91 ± 0.57 × 10⁷ V2/Hz, p < 0.001; Fig. 6H,I). These results suggest that, despite the prominent γ oscillations in FSI pseudo-LFP activity in both control and DD conditions (Fig. 3E), synchronized pauses in FSI population activity occur at β frequency in DD and thus may be critical in propagating β activity throughout the pallidostriatal circuit.
To see how GPe-induced FSI pauses affect MSNs, probability distributions for MSN latency to fire were generated, aligned to synchronous GPe spikes (Fig. 6J). MSNs showed increased probability of firing in the 5–15 ms window after a synchronous GPe spike (control: 0.088 ± 0.003, DD: 0.092 ± 0.012) compared with asynchronous GPe spikes (control: 0.058 ± 0.003, DD: 0.03 ± 0.003, p < 0.0001). As with GPe, there were no significant differences between control and DD models. The critical difference between control and DD MSN spiking was instead in the patterning of synchronous spikes. Synchronous MSN spiking occurred at β frequency (Fig. 6K), and the amount of β activity was greater in the DD model (8.93 ± 1.95 × 10⁴ V2/Hz) than in control (5.81 ± 0.39 × 10⁴ V2/Hz, p < 0.0001; Fig. 6L). This amplification suggests that, in DD, enhanced GPe synchrony carries over to MSN rhythmicity, whereas MSN input to GPe in turn reinforces GPe β activity.
Together, these data demonstrate how the GPe-FSI pathway promotes β activity in the DD circuit. In control and DD conditions, synchronous GPe spikes are able to cause synchronized FSI pauses in a way that asynchronous GPe spikes cannot. Synchronized GPe spikes tend to occur at β frequency, and thus FSI pauses and the resulting MSN disinhibition windows also occur at β frequency. In DD, because there are more synchronous GPe spikes, GPe more strongly organizes pauses in FSI firing. Correspondingly, MSNs in DD also display increased spike synchrony and increased β activity, and their synchronous β input to GPe reinforces heightened synchrony and β oscillations throughout the network.
β oscillations are selectively amplified in the GPe-FSI-MSN loop
Our simulations and data analyses have established that the model GPe-FSI-MSN loop has an intrinsic capacity to generate β oscillations in DD. Given the associated positive feedback mechanisms, the loop might also be expected to sustain or amplify β oscillations that originate elsewhere. Indeed, although the origin of pathological β oscillations in PD is unknown, both the STN and the cortex have been proposed as potential sources (Brown et al., 2001; Magill et al., 2001; Levy et al., 2002; Williams et al., 2002; Sharott et al., 2005; Weinberger et al., 2006; Gaynor et al., 2008; Mallet et al., 2008a, b; Bronte-Stewart et al., 2009; Hirschmann et al., 2011; Jenkinson and Brown, 2011; Tachibana et al., 2011). To assess how oscillations transmitted from such external sources affect dynamics within the GPe-FSI-MSN loop, we delivered Iex with sinusoidal conductance gex to different nodes in our model to simulate an oscillatory input (see Materials and Methods).
When a β frequency excitatory oscillatory input (25 Hz) was delivered to GPe (Fig. 7A), spectrograms revealed that oscillations were propagated throughout the loop in both control and DD networks, but they were highly amplified in the DD network compared with control (Fig. 7B,C). β was increased in the DD network 2.2-fold over control in GPe (control: 2.17 ± 0.24, DD: 5.04 ± 0.72 × 10⁹ V2/Hz, p < 10−5), 2.2-fold in MSNs (control: 1.48 ± 0.48, DD: 3.26 ± 0.93 × 10⁹ V2/Hz, p < 10−5), and 1.5-fold in FSIs (control: 0.96 ± 0.27, DD: 1.40 ± 0.30 × 10⁹ V2/Hz, p < 10−5).
Figure 7.
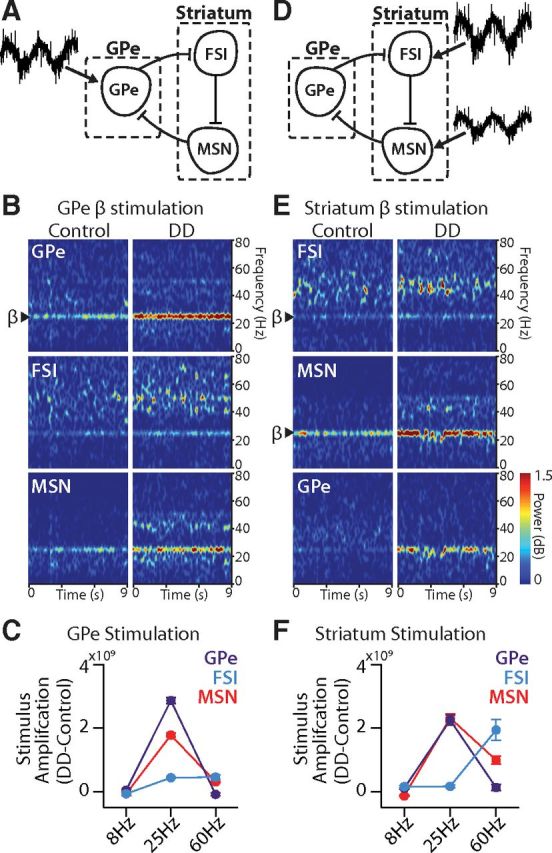
GPe-FSI-MSN loop selectively amplifies applied β oscillations in DD. A, Schematic of a GPe-FSI-MSN network receiving an oscillatory stimulus applied to GPe. B, Spectrograms showing power across all frequencies (0–80 Hz) over the duration of a model simulation (9 s). β oscillations applied to GPe (arrow) were propagated to FSIs and MSNs in both control and DD conditions but showed stronger power in DD than in control (p < 0.00001). C, Amplification (powerDD − powercontrol) of spectral power for each of three oscillatory inputs applied to GPe (θ = 8 Hz; β = 25 Hz; γ = 60 Hz). GPe and MSN populations amplified β more in DD than either θ or γ (see statistics in Table 4). FSIs amplified both β and γ equally (Table 4). D, Schematic of a GPe-FSI-MSN network receiving oscillatory stimuli applied to striatum. E, Spectrograms showing power across all frequencies (0–80 Hz) over the duration of a model simulation (9 s). β oscillations applied to FSIs and MSNs in striatum (arrows) were propagated to GPe in both control and DD conditions but showed stronger power in DD than in control (p < 0.01). F, Amplification of spectral power for each of three oscillatory inputs applied to striatum. GPe and MSN populations amplified β more in DD than either θ or γ (see statistics in Table 4). FSIs in the DD network amplified γ more than any other frequency (Table 4). Stimulus power amplification is in units of V2/Hz. Data are mean ± SEM.
To determine whether the DD network propagates all oscillatory stimuli to the same degree or whether this amplification is specific to β oscillations, we also applied sinusoidal input to GPe with one of two alternative frequencies to mimic γ oscillations (60 Hz) or θ (8 Hz) oscillations. γ oscillations (60 Hz) are thought to be prokinetic and have been reported to be decreased in PD circuits, whereas θ oscillations (8 Hz) have been shown to be increased in PD circuits (Brown, 2003; Hutchison et al., 2004; Sarnthein et al., 2007; Cheyne et al., 2008; Muthukumaraswamy, 2010; Tass et al., 2010; Jenkinson et al., 2013). Amplification of each stimulus was measured by subtracting bandpower from a narrow range around the stimulus frequency (±5 Hz) in the control network from the power in that range in the DD network for a given cell population (amplification = PowerDD − PowerControl). Oscillations imposed on GPe at γ and θ frequencies were no more strongly amplified in the DD network than in control. In GPe, the resulting γ power was actually diminished in the DD network relative to control (p < 0.05; Table 4). However, GPe γ power was propagated throughout the circuit, with some amplification in DD in MSNs and FSIs. Still, the γ amplification was much smaller than the β amplification in MSNs (p < 0.00001; Table 4) and not different from the degree of β amplification in FSIs (p = 0.80; Fig. 7C; Table 4). Likewise, θ power was amplified significantly less than β power in all cell populations (p < 0.0001; Fig. 7C; Table 4). These results indicate that oscillatory input to GPe will propagate throughout the circuit, suggesting that GPe, when synchronized by an oscillatory input, can pass information to other nodes in the circuit; importantly, however, the DD network showed a preferential amplification of β frequency oscillatory stimuli applied to GPe.
Table 4.
Amplification of oscillatory power in each circuit node when stimulus is applied to GPe or striatuma
| Applied to GPe |
Applied to striatum |
|||||
|---|---|---|---|---|---|---|
| 8 Hz | 25 Hz | 60 Hz | 8 Hz | 25 Hz | 60 Hz | |
| Stimulus power amplification (DD-control) | ||||||
| GPe | 0.04 ± 0.15* | 2.87 ± 0.30* | −0.09 ± 0.12* | 0.11 ± 0.06d | 2.25 ± 0.48d,e | 0.13 ± 0.30e |
| FSI | −0.07 ± 0.06b,c | 0.44 ± 0.06b | 0.45 ± 0.18c | 0.15 ± 0.06f | 0.17 ± 0.12g | 1.94 ± 0.99f,g |
| MSN | −0.07 ± 0.15* | 1.78 ± 0.21* | 0.31 ± 0.06* | −0.14 ± 0.06* | 2.31 ± 0.39* | 0.99 ± 0.36* |
aDifferences in amplification (DD stimulus bandpower − Control stimulus bandpower) of oscillatory stimulus. Power amplification in units of 1 × 10⁹ V2/Hz. Values are mean ± SD.
b,c,d,e,f,gLetters indicate a significant difference between just two values (at least p < 0.05). Pairwise comparisons were only computed following a significant one-way ANOVA.
*Pairwise comparisons between all three conditions were significantly different (at least p < 0.05).
When a β frequency oscillatory input was delivered to striatum (Fig. 7D), β propagated throughout the loop in both control and DD conditions and once again was amplified in the DD network relative to control (Fig. 7E,F). This amplification in the DD network was most prominent in GPe (control: 0.74 ± 0.45, DD: 3.00 ± 1.61 × 10⁹ V2/Hz, p < 10−5) and MSNs (control: 2.44 ± 0.63, DD: 4.75 ± 1.11 × 10⁹ V2/Hz, p < 10−5) and less obvious in FSIs (control: 1.00 ± 0.27, DD: 1.17 ± 0.27 × 10⁹ V2/Hz, p < 0.01). Combined with the data above, these results demonstrate that β oscillations applied to the pallidostriatal circuit at any node will be amplified, particularly under DD conditions.
We again asked whether θ or γ oscillations, now applied to striatum, were differentially amplified in the DD network relative to control. We observed a statistically significant increase (in GPe and FSIs) or decrease (in MSNs) in the power of θ oscillations in the DD network relative to control (all cell populations, p < 0.001; Fig. 7F; Table 4), but these effects were small in magnitude. In contrast, we observed that γ applied to striatum produced a different effect on network dynamics than γ applied to GPe. Specifically, striatally applied γ in FSIs was greater in the DD network (6.29 ± 3.09 × 10⁹ V2/Hz) than in control (4.35 ± 0.42 × 10⁹ V2/Hz, p < 0.0001; Fig. 7F, blue), likely reflecting the tendency of FSIs to resonate at γ frequency (Berke, 2009; Cardin et al., 2009; Sohal et al., 2009; van der Meer and Redish, 2009). Striatally applied γ was also amplified in MSNs in the DD network (2.12 ± 1.17 × 10⁹ V2/Hz) relative to control (1.12 ± 0.12 × 10⁹ V2/Hz, p < 0.00001), although the degree of amplification was significantly less than that for striatally applied β oscillations (p < 0.001; Fig. 7F, red; Table 4). In GPe, little amplification of γ occurred (control: 0.32 ± 0.02, DD: 0.45 ± 0.28 × 10⁹ V2/Hz, p = 0.19). Indeed, the DD amplification of striatal β oscillations in GPe (2.25 ± 0.48 × 10⁹ V2/Hz) was significantly greater than DD amplification of striatal γ oscillations (0.13 ± 0.30 × 10⁹ V2/Hz, p < 0.001; Fig. 7F, purple). Thus, overall, DD amplification of oscillatory input to striatum was preferential for β frequency, suggesting again that the pallidostriatal circuit has a tendency to promote β oscillations in the DD network.
Striatal stimulation at γ frequency also significantly enhanced β power in MSNs in the DD network (5.13 ± 0.66 × 10⁹ V2/Hz) relative to control (1.79 ± 0.09 × 10⁹ V2/Hz, p < 0.0001), and this amplification was significantly greater than DD amplification of β input (p < 0.01) and intrinsic β (p < 0.01) in MSNs (data not shown). In contrast, γ stimulation of the GPe did not enhance β activity in the circuit any more than the normal DD enhancement of intrinsic β activity. Likewise, θ stimulation of striatum or GPe did not significantly enhance intrinsic DD β activity. These results suggest a possible interaction between striatal γ and β activity in the circuit (see Discussion).
Overall, these results suggest that the DD model circuit preferentially amplifies β frequency stimuli, whether applied to GPe or striatum, consistent with experimental evidence indicating an increase in β band oscillatory activity in the basal ganglia circuit in PD (Levy et al., 2002; Brown, 2003; Sharott et al., 2005; Weinberger et al., 2006; Mallet et al., 2008a, b; Bronte-Stewart et al., 2009). This preference for β amplification in DD, regardless of where β oscillations enter the circuit, indicates that the GPe-FSI-MSN loop will amplify β oscillations that originate in other regions of the brain, in addition to intrinsically generating β activity in DD.
Discussion
Our results reveal a novel mechanism through which the pallidostriatal pathway influences the functional coupling between the GPe and striatum. We show that, within a GPe-FSI-MSN loop, transient synchronization occurs rhythmically at β frequencies, and this effect is amplified by the pallidostriatal pathway under DD conditions, despite no change in the strength of GPe-FSI synaptic connections. DD-induced increases in synchrony and β power in GPe produce rhythmic pauses in FSIs, via the pallidostriatal pathway, which enable MSNs to fire at β frequencies. Similar mechanisms yield amplification of β oscillations transmitted from neurons outside of the circuit. These results suggest that the pallidostriatal pathway shapes striatal output during periods of synchronous activity in GPe, which have been observed during certain behavioral tasks and in disease.
Synaptic properties of pallidostriatal projections
Pallidostriatal projections are often overlooked in circuit models of the basal ganglia, but they have been described anatomically for over three decades (Staines et al., 1981, Beckstead, 1983; Staines and Fibiger, 1984; Kita et al., 1991; Rajakumar et al., 1994; Bevan et al., 1998; Kita et al., 1999; Sato et al., 2000; Mallet et al., 2012). A number of pallidostriatal projections arise from axon collaterals of GPe neurons projecting to STN and SNr (Bevan et al., 1998; Saunders et al., 2016), but a subset of GPe neurons, recently dubbed “arkypallidal,” project exclusively to striatum (Sato et al., 2000; Mallet et al., 2012; Abdi et al., 2015; Dodson et al., 2015; Fujiyama et al., 2015; Hernández et al., 2015). Axon collaterals of “prototypic” GPe neurons (STN- and SNr-projecting) selectively innervate GABAergic interneurons in striatum (Bevan et al., 1998; Saunders et al., 2016), but axons of arkypallidal neurons make synaptic-like contacts onto both interneurons and MSNs (Mallet et al., 2012).
In contrast to previous anatomical evidence, results from our synaptic experiments reveal that GABAergic responses recorded in MSNs in response to pallidostriatal stimulation are much weaker than those recorded in FSIs. If pallidostriatal projections are more distal onto MSNs than they are onto FSIs, synaptic responses might be attenuated before reaching the soma. It is possible that arkypallidal neurons did not strongly express ChR2, but this is unlikely because EYFP fluorescence was detected in FoxP2+ neurons, a molecular marker of arkypallidal neurons (data not shown). Another possibility is that the release probability of pallidostriatal synapses onto MSNs is very low or that postsynaptic GABA receptors are absent from these synapses. After dopamine depletion, IPSC amplitude was increased in MSNs, but the paired pulse ratio was not changed (paired pulse ratio not shown), suggesting that changes in postsynaptic GABA receptors could be involved. Nonetheless, our results suggest that pallidostriatal projections do not exert the same degree of fast GABA-mediated inhibition onto MSNs that they do onto FSIs.
In contrast, pallidostriatal projections evoked strong IPSCs in FSIs. These responses likely arise from axon collaterals of “prototypic” GPe neurons, but projections from arkypallidal neurons might contribute as well. The large amplitude and rapid synaptic kinetics of these responses suggest that they mediate strong, fast synaptic inhibition capable of suppressing and/or synchronizing FSI activity, as previously proposed (Bevan et al., 1998; Shouno et al., 2009; Wilson, 2009; Gage et al., 2010).
Model β activity is generated through GPe synchronization at β frequency
An important prediction of our model is that synchronous firing in GPe is required for the pallidostriatal pathway to influence striatal output. Synchronized firing in GPe produces a coordinated pause across multiple FSIs (Fig. 8B), which does not result from asynchronous spiking (Fig. 8A). This transient pause provides a window in which MSNs have a high probability of spiking (Fig. 8B). The mechanistic predictions of this model cannot be tested in acute slices, where rhythmic oscillations are rarely observed in the basal ganglia (Loucif et al., 2005), but the disinhibitory role of the pallidostriatal pathway has been previously hypothesized from in vivo recordings (Wilson, 2009). Indeed, coordinated changes in GPe activity coincide with changes in FSI population activity at key decision points on a behavioral task (Gage et al., 2010).
Figure 8.
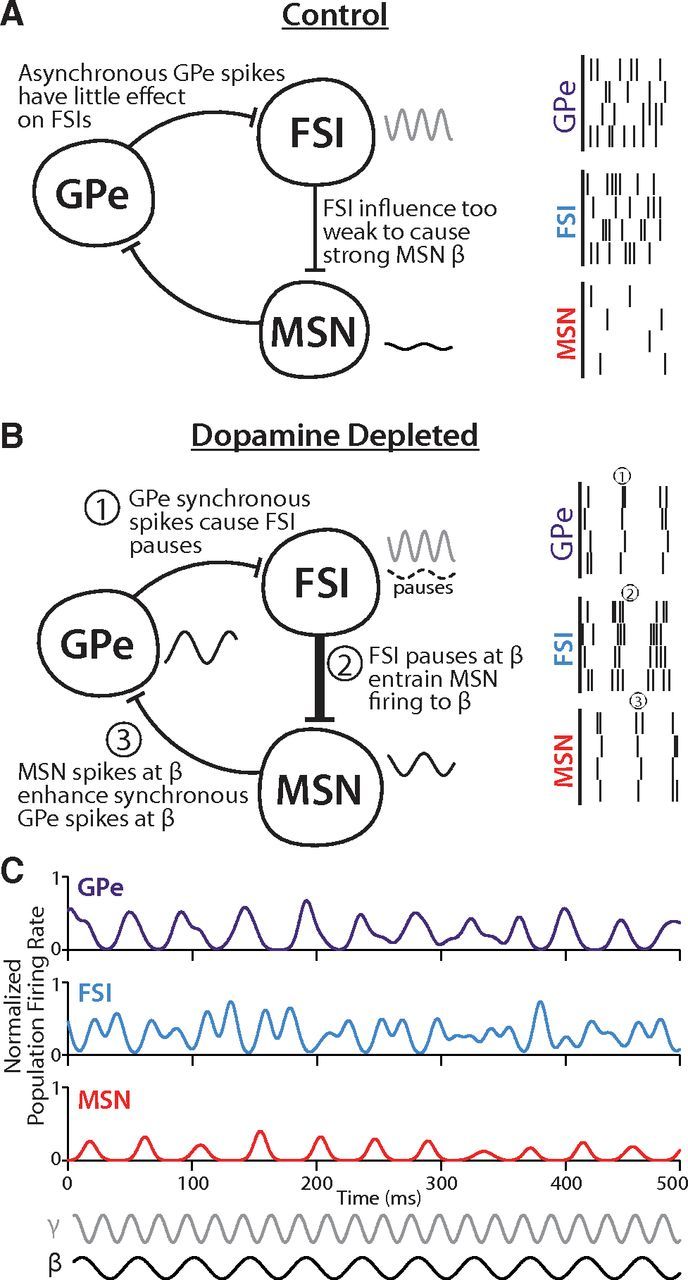
Proposed mechanism of synchrony and β oscillations. A, In control conditions, firing synchrony in GPe is low, so there are few synchronized pauses in FSIs. Because pauses in FSIs are unsynchronized, spikes in MSNs exhibit little temporal structure. FSIs exhibit strong γ activity (gray line), but their control over MSNs is too weak to cause strong MSN β (black line). B, In DD conditions, firing synchrony in the GPe is increased, especially at β frequencies (1, black line). This synchronizes pauses in FSIs to β frequencies (2, dashed black line) and entrains the pattern of MSN spikes to β (3, solid black line). Additional β entrainment of MSNs occurs via 2:1 entrainment from FSI γ activity (gray line) because FSIs have a greater influence over MSNs in DD due to increased connection probabilities. Firing of MSNs at β frequency further enhances β rhythmicity in GPe, which reinforces β and synchrony throughout the loop. C, Example instantaneous population firing rate plots for each cell type over 500 ms in the DD model. Simultaneous traces show how peaks of GPe firing at β frequency (purple) align with troughs in FSI firing at β frequency (blue). These pauses in FSI activity are followed by peaks in MSN firing at β frequency (red). Concurrently, FSI γ activity can be seen overlaid on the β oscillation, with two γ frequency peaks occurring between the β frequency pauses. Reference oscillations are shown at β (black, 22 Hz) and γ (gray, 44 Hz) frequencies.
In contrast to transient epochs of GPe synchrony that occur during behavioral selection in healthy animals (Courtemanche et al., 2003; Turner et al., 2005; Leventhal et al., 2012), GPe synchrony is chronic in low dopamine (Nini et al., 1995; Raz et al., 2000; Goldberg et al., 2004; Heimer et al., 2006; Hammond et al., 2007; Mallet et al., 2008a; Kuhn et al., 2009). This observation suggests that the pallidostriatal pathway exerts greater influence on striatal dynamics in PD. This prediction is supported in our model by observations that there are more synchronous FSI pauses in the DD network compared with control (Fig. 6). Furthermore, because the influence of FSIs over MSNs is increased by DD (Gittis et al., 2011), FSI pauses become even more important in determining the timing of MSN spikes.
In our model, synchronous firing of GPe neurons exhibits β frequency rhythmicity, which in turn establishes rhythmicity in the pauses of FSIs and entrains MSN firing to β frequencies (Fig. 8B,C), both of which become more pronounced in the DD network due to the pallidostriatal pathway (Figs. 5, 6). Synchronized MSN activation, particularly with the higher MSN firing rate in the DD condition, further reinforces β rhythms in GPe (Fig. 8B), which represent a physiological hallmark of BG dysfunction in PD (Brown et al., 2001; Levy et al., 2002; Sharott et al., 2005; Weinberger et al., 2006; Mallet et al., 2008a, b; Bronte-Stewart et al., 2009). The interplay between FSI γ activity, FSI β pauses, and MSN/GPe β activity is evident in instantaneous firing rate plots from the DD model (Fig. 8C).
In addition to our model's intrinsic β generation capability in DD, it exhibits preferential amplification of applied oscillations in the β band. Thus, the propensity of the DD network for β frequency activity could manifest either in the generation of rhythmic activity or in the propagation of oscillatory inputs originating outside the pallidostriatal loop. Additionally, stimulation of striatum at γ frequency enhances β activity in the DD state (data not shown), suggesting a relationship between γ and β activity in the DD model, likely due to increased FSI-MSN inhibition, which is consistent with past observations in PD (de Hemptinne et al., 2013) and theoretical work (Whittington et al., 2000).
Relation to previous models
Previous results have indicated that phasic striatal inhibition has a stronger impact than STN excitation on slow oscillations in GPe (Walters et al., 2007). Nonetheless, prominent theories of β in PD regard the GPe-STN reciprocal circuit as critical to the generation of oscillations (Brown et al., 2001; Magill et al., 2001; Terman et al., 2002; Rubin and Terman, 2004; Mallet et al., 2008a; Kumar et al., 2011; Tachibana et al., 2011; Nevado-Holgado et al., 2014; Pavlides et al., 2015). Our model suggests that, regardless of the source, the crucial mechanism in amplifying β oscillations in DD is rhythmic synchrony within GPe, which in turn strongly impacts striatal output. β activity in the STN could act as the synchronizer of GPe; in such a case, the amplification of β oscillations in the GPe-FSI-MSN loop could play a critical role in reinforcing STN oscillations, compatible with GPe-STN theories of β generation. Another potential synchronizer of GPe may be motor cortex, which has been shown to exhibit β activity in PD and to have direct connections to GPe (Naito and Kita, 1994; Gaynor et al., 2008; Mallet et al., 2008b; Jenkinson et al., 2011; Smith and Wichmann, 2015) in addition to its projections to striatum. Regardless of the site of origin, our model suggests a central role for GPe in amplifying cortico-basal ganglia β oscillations in PD and predicts that compromising the pathway from GPe to FSIs should diminish β power elsewhere in the basal ganglia.
In our model, β activity in the MSN population, caused by precisely timed FSI population pauses, promotes synchronization of GPe. One previous model has shown how striatal β activity could develop in MSNs alone, without the inclusion of an FSI population or GPe inputs (McCarthy et al., 2011). We have suggested that the FSIs are crucial for β based on our finding that they receive strong input from the pallidostriatal pathway, earlier observations of increased FSI-MSN connection probability in DD (Gittis et al., 2011), and the synchronizing effect of FSI pauses on MSN firing. Because our proposed mechanism for propagating oscillations relies on a β synchronization of GPe via MSNs, an MSN-only generation of β could be compatible with our central hypothesis, in which case our model would still offer new insights about propagation of rhythmicity throughout the pallidostriatal circuit. The work of Damodaran et al. (2014) supports a role for increased FSI inhibition in amplifying β oscillations but also suggests that decreased MSN-MSN connectivity is necessary for β emergence. In our model, although we do not implement a direct change in MSN lateral inhibition, we do include an increase in MSN firing rate in DD. Thus, our model predicts that any modification that yields increased MSN firing could play a similar role to plasticity in MSN connections in the emergence of β activity in DD.
In conclusion, this work highlights a novel dynamic capacity of a basal ganglia circuit composed of GPe and striatal neurons and provides an exploration of the involvement of the pallidostriatal projection in shaping circuit activity. The results suggest a pivotal role for GPe, through its projection to striatal FSIs, in synchronizing MSN activity and therefore striatal output. Through this connection, GPe may serve to generate pathological β synchrony throughout multiple basal ganglia nuclei or to amplify oscillations transmitted to GPe from another source. This effect offers a complementary mechanism to previously identified pathways through which GPe may contribute to abnormal activity in Parkinsonism. The pallidostriatal connection may therefore merit further exploration as a modulator of information flow through basal ganglia pathways and as a target for interventions for Parkinson's disease.
Footnotes
This work was supported by National Science Foundation Grants DMS 1516288 and DMS 1312508, National Institutes of Health Grants R00NS076524 and 2T32NS007433-16, Brain and Behavior Research Foundation (National Alliance for Research on Schizophrenia and Depression Young Investigator Grant), and the Pennsylvania Department of Health's Commonwealth Universal Research Enhancement Program. We thank Richard C. Gerkin for specialized IGOR analysis and acquisition routines.
The authors declare no competing financial interests.
References
- Abdi A, Mallet N, Mohamed FY, Sharott A, Dodson PD, Nakamura KC, Suri S, Avery SV, Larvin JT, Garas FN, Garas SN, Vinciati F, Morin S, Bezard E, Baufreton J, Magill PJ. Prototypic and arkypallidal neurons in the dopamine-intact external globus pallidus. J Neurosci. 2015;35:6667–6688. doi: 10.1523/JNEUROSCI.4662-14.2015. [DOI] [PMC free article] [PubMed] [Google Scholar]
- Azdad K, Chàvez M, Don Bischop P, Wetzelaer P, Marescau B, De Deyn PP, Gall D, Schiffmann SN. Homeostatic plasticity of striatal neurons intrinsic excitability following dopamine depletion. PLoS One. 2009;4:e6908. doi: 10.1371/journal.pone.0006908. [DOI] [PMC free article] [PubMed] [Google Scholar]
- Bar-Gad I, Heimer G, Ritov Y, Bergman H. Functional correlations between neighboring neurons in the primate globus pallidus are weak or nonexistent. J Neurosci. 2003;23:4012–4016. doi: 10.1523/JNEUROSCI.23-10-04012.2003. [DOI] [PMC free article] [PubMed] [Google Scholar]
- Beckstead RM. A pallidostriatal projection in the cat and monkey. Brain Res Bull. 1983;11:629–632. doi: 10.1016/0361-9230(83)90003-5. [DOI] [PubMed] [Google Scholar]
- Bergman H, Feingold A, Nini A, Raz A, Slovin H, Abeles M, Vaadia E. Physiological aspects of information processing in the basal ganglia of normal and parkinsonian primates. Trends Neurosci. 1998;21:32–38. doi: 10.1016/S0166-2236(97)01151-X. [DOI] [PubMed] [Google Scholar]
- Berke JD. Uncoordinated firing rate changes of striatal fast-spiking interneurons during behavioral task performance. J Neurosci. 2008;28:10075–10080. doi: 10.1523/JNEUROSCI.2192-08.2008. [DOI] [PMC free article] [PubMed] [Google Scholar]
- Berke JD. Fast oscillations in cortical-striatal networks switch frequency following rewarding events and stimulant drugs. Eur J Neurosci. 2009;30:848–859. doi: 10.1111/j.1460-9568.2009.06843.x. [DOI] [PMC free article] [PubMed] [Google Scholar]
- Bevan MD, Booth PA, Eaton SA, Bolam JP. Selective innervation of neostriatal interneurons by a subclass of neuron in the globus pallidus of the rat. J Neurosci. 1998;18:9438–9452. doi: 10.1523/JNEUROSCI.18-22-09438.1998. [DOI] [PMC free article] [PubMed] [Google Scholar]
- Bevan MD, Magill PJ, Terman D, Bolam JP, Wilson CJ. Move to the rhythm: oscillations in the subthalamic nucleus-external globus pallidus network. Trends Neurosci. 2002;25:525–531. doi: 10.1016/S0166-2236(02)02235-X. [DOI] [PubMed] [Google Scholar]
- Boraud T, Bezard E, Bioulac B, Gross CE. Dopamine agonist-induced dyskinesias are correlated to both firing pattern and frequency alterations of pallidal neurones in the MPTP-treated monkey. Brain. 2001;124:546–557. doi: 10.1093/brain/124.3.546. [DOI] [PubMed] [Google Scholar]
- Bronte-Stewart H, Barberini C, Koop MM, Hill BC, Henderson JM, Wingeier B. The STN beta-band profile in Parkinson's disease is stationary and shows prolonged attenuation after deep brain stimulation. Exp Neurol. 2009;215:20–28. doi: 10.1016/j.expneurol.2008.09.008. [DOI] [PubMed] [Google Scholar]
- Brown P. Oscillatory nature of human basal ganglia activity: relationship to the pathophysiology of Parkinson's disease. Mov Disord. 2003;18:357–363. doi: 10.1002/mds.10358. [DOI] [PubMed] [Google Scholar]
- Brown P, Oliviero A, Mazzone P, Insola A, Tonali P, Di Lazzaro V. Dopamine dependency of oscillations between subthalamic nucleus and pallidum in Parkinson's disease. J Neurosci. 2001;21:1033–1038. doi: 10.1523/JNEUROSCI.21-03-01033.2001. [DOI] [PMC free article] [PubMed] [Google Scholar]
- Bugaysen J, Bar-Gad I, Korngreen A. Continuous modulation of action potential firing by a unitary GABAergic connection in the globus pallidus in vitro. J Neurosci. 2013;33:12805–12809. doi: 10.1523/JNEUROSCI.1970-13.2013. [DOI] [PMC free article] [PubMed] [Google Scholar]
- Cardin JA, Carlén M, Meletis K, Knoblich U, Zhang F, Deisseroth K, Tsai LH, Moore CI. Driving fast-spiking cells induces gamma rhythm and controls sensory responses. Nature. 2009;459:663–667. doi: 10.1038/nature08002. [DOI] [PMC free article] [PubMed] [Google Scholar]
- Cazorla M, de Cavalho FD, Chohan MO, Shegda M, Chuhma N, Rayport S, Ahmari SE, Moore H, Kellendonk C. Dopamine D2 receptors regulate the anatomical and functional balance of basal ganglia circuitry. Neuron. 2014;81:153–164. doi: 10.1016/j.neuron.2013.10.041. [DOI] [PMC free article] [PubMed] [Google Scholar]
- Cheyne D, Bells S, Ferrari P, Gaetz W, Bostan AC. Self-paced movements induce high-frequency gamma oscillations in primary motor cortex. Neuroimage. 2008;42:332–342. doi: 10.1016/j.neuroimage.2008.04.178. [DOI] [PubMed] [Google Scholar]
- Chuhma N, Tanaka KF, Hen R, Rayport S. Functional connectome of the striatal medium spiny neuron. J Neurosci. 2011;31:1183–1192. doi: 10.1523/JNEUROSCI.3833-10.2011. [DOI] [PMC free article] [PubMed] [Google Scholar]
- Courtemanche R, Fujii N, Graybiel AM. Synchronous, focally modulated β-band oscillations characterize local field potential activity in the striatum of awake behaving monkeys. J Neurosci. 2003;23:11741–11752. doi: 10.1523/JNEUROSCI.23-37-11741.2003. [DOI] [PMC free article] [PubMed] [Google Scholar]
- Damodaran S, Evans RC, Blackwell KT. Synchronized firing of fast-spiking interneurons is critical to maintain balanced firing between direct and indirect pathway neurons of the striatum. J Neurophysiol. 2014;111:836–848. doi: 10.1152/jn.00382.2013. [DOI] [PMC free article] [PubMed] [Google Scholar]
- de Hemptinne C, Ryapolova-Webb ES, Air EL, Garcia PA, Miller KJ, Ojemann JG, Ostrem JL, Galifianakis NB, Starr PA. Exaggerated phase-amplitude coupling in the primary motor cortex in Parkinson disease. Proc Natl Acad Sci U S A. 2013;110:4780–4785. doi: 10.1073/pnas.1214546110. [DOI] [PMC free article] [PubMed] [Google Scholar]
- Degos B, Deniau JM, Chavez M, Maurice N. Chronic but not acute dopaminergic transmission interruption promotes a progressive increase in cortical beta frequency synchronization: relationships to vigilance state and akinesia. Cereb Cortex. 2009;19:1616–1630. doi: 10.1093/cercor/bhn199. [DOI] [PubMed] [Google Scholar]
- Dodson PD, Larvin JT, Duffell JM, Garas FN, Doig NM, Kessaris N, Duguid IC, Bogacz R, Butt SJ, Magill PJ. Distinct developmental origins manifest in the specialized encoding of movement by adult neurons of the external globus pallidus. Neuron. 2015;86:501–513. doi: 10.1016/j.neuron.2015.03.007. [DOI] [PMC free article] [PubMed] [Google Scholar]
- Ermentrout B. Simulating, analyzing, and animating dynamical systems: a guide to XPPAUT for researchers and students. Philadelphia: Society for Industrial and Applied Mathematics; 2002. [Google Scholar]
- Fino E, Glowinski J, Venance L. Effects of acute dopamine depletion on the electrophysiological properties of striatal neurons. Neurosci Res. 2007;58:305–316. doi: 10.1016/j.neures.2007.04.002. [DOI] [PubMed] [Google Scholar]
- Fujita T, Fukai T, Kitano K. Influences of membrane properties on phase response curve and synchronization stability in a model globus pallidus neuron. J Comput Neurosci. 2012;32:539–553. doi: 10.1007/s10827-011-0368-2. [DOI] [PubMed] [Google Scholar]
- Fujiyama F, Nakano T, Matsuda W, Furuta T, Udagawa J, Kaneko T. A single-neuron tracing study of arkypallidal and prototypic neurons in healthy rats. Brain Struct Funct. 2015 doi: 10.1007/s00429-015-1152-2. doi: 10.1007/s00429-015-1152-2. Advance online publication. Retrieved Dec. 7, 2015. [DOI] [PubMed] [Google Scholar]
- Gage GJ, Stoetzner CR, Wiltschko AB, Berke JD. Selective activation of striatal fast-spiking interneurons during choice execution. Neuron. 2010;67:466–479. doi: 10.1016/j.neuron.2010.06.034. [DOI] [PMC free article] [PubMed] [Google Scholar]
- Gatev P, Darbin O, Wichmann T. Oscillations in the basal ganglia under normal conditions and in movement disorders. Mov Disord. 2006;21:1566–1577. doi: 10.1002/mds.21033. [DOI] [PubMed] [Google Scholar]
- Gaynor LM, Kühn AA, Dileone M, Litvak V, Eusebio A, Pogosyan A, Androulidakis AG, Tisch S, Limousin P, Insola A, Mazzone P, Di Lazzaro V, Brown P. Suppression of beta oscillations in the subthalamic nucleus following cortical stimulation in humans. Eur J Neurosci. 2008;28:1686–1695. doi: 10.1111/j.1460-9568.2008.06363.x. [DOI] [PMC free article] [PubMed] [Google Scholar]
- Gertler TS, Chan CS, Surmeier DJ. Dichotomous anatomical properties of adult striatal medium spiny neurons. J Neurosci. 2008;28:10814–10824. doi: 10.1523/JNEUROSCI.2660-08.2008. [DOI] [PMC free article] [PubMed] [Google Scholar]
- Gittis AH, Nelson AB, Thwin MT, Palop JJ, Kreitzer AC. Distinct roles of GABAergic interneurons in the regulation of striatal output pathways. J Neurosci. 2010;30:2223–2234. doi: 10.1523/JNEUROSCI.4870-09.2010. [DOI] [PMC free article] [PubMed] [Google Scholar]
- Gittis AH, Hang GB, LaDow ES, Shoenfeld LR, Atallah BV, Finkbeiner S, Kreitzer AC. Rapid target-specific remodeling of fast-spiking inhibitory circuits after loss of dopamine. Neuron. 2011;71:858–868. doi: 10.1016/j.neuron.2011.06.035. [DOI] [PMC free article] [PubMed] [Google Scholar]
- Goldberg JA, Rokni U, Boraud T, Vaadia E, Bergman H. Spike synchronization in the cortex-basal ganglia networks of Parkinsonian primates reflects global dynamics of the local field potentials. J Neurosci. 2004;24:6003–6010. doi: 10.1523/JNEUROSCI.4848-03.2004. [DOI] [PMC free article] [PubMed] [Google Scholar]
- Golomb D, Rinzel J. Dynamics of globally coupled inhibitory neurons with heterogeneity. Phys Rev. 1993;48:4810. doi: 10.1103/PhysRevE.48.4810. [DOI] [PubMed] [Google Scholar]
- Golomb D, Donner K, Shacham L, Shlosberg D, Amitai Y, Hansel D. Mechanisms of firing patterns in fast-spiking cortical interneurons. PLoS Comput Biol. 2007;3:e156. doi: 10.1371/journal.pcbi.0030156. [DOI] [PMC free article] [PubMed] [Google Scholar]
- Guzmán JN, Hernández A, Galarraga E, Tapia D, Laville A, Vergara R, Aceves J, Bargas J. Dopaminergic modulation of axon collaterals interconnecting spiny neurons of the rat striatum. J Neurosci. 2003;23:8931–8940. doi: 10.1523/JNEUROSCI.23-26-08931.2003. [DOI] [PMC free article] [PubMed] [Google Scholar]
- Hammond C, Bergman H, Brown P. Pathological synchronization in Parkinson's disease: networks, models and treatments. Trends Neurosci. 2007;30:357–364. doi: 10.1016/j.tins.2007.05.004. [DOI] [PubMed] [Google Scholar]
- Heimer G, Rivlin-Etzion M, Bar-Gad I, Goldberg JA, Haber SN, Bergman H. Dopamine replacement therapy does not restore the full spectrum of normal pallidal activity in the 1-methyl-4-phenyl-1,2,3,6-tetra-hydropyridine primate model of parkinsonism. J Neurosci. 2006;26:8101–8114. doi: 10.1523/JNEUROSCI.5140-05.2006. [DOI] [PMC free article] [PubMed] [Google Scholar]
- Hernández LF, Kubota Y, Hu D, Howe MW, Lemaire N, Graybiel AM. Selective effects of dopamine depletion and L-DOPA therapy on learning-related firing dynamics of striatal neurons. J Neurosci. 2013;33:4782–4795. doi: 10.1523/JNEUROSCI.3746-12.2013. [DOI] [PMC free article] [PubMed] [Google Scholar]
- Hernández VM, Hegeman DJ, Cui Q, Kelver DA, Fiske MP, Glajch KE, Pitt JE, Huang TY, Justice NJ, Chan CS. Parvalbumin+ neurons and Npas1+ neurons are distinct neuron classes in the mouse external globus pallidus. J Neurosci. 2015;35:11830–11847. doi: 10.1523/JNEUROSCI.4672-14.2015. [DOI] [PMC free article] [PubMed] [Google Scholar]
- Hirschmann J, Özkurt TE, Butz M, Homburger M, Elben S, Hartmann CJ, Vesper J, Wojtecki L, Schnitzler A. Distinct oscillatory STN-cortical loops revealed by simultaneous MEG and local field potential recordings in patients with Parkinson's disease. Neuroimage. 2011;55:1159–1168. doi: 10.1016/j.neuroimage.2010.11.063. [DOI] [PubMed] [Google Scholar]
- Holgado AJ, Terry JR, Bogacz R. Conditions for the generation of beta oscillations in the subthalamic nucleus-globus pallidus network. J Neurosci. 2010;30:12340–12352. doi: 10.1523/JNEUROSCI.0817-10.2010. [DOI] [PMC free article] [PubMed] [Google Scholar]
- Hutchison WD, Lozano AM, Davis KD, Saint-Cyr JA, Lang AE, Dostrovsky JO. Differential neuronal activity in segments of globus pallidus in Parkinson's disease patients. Neuroreport. 1994;5:1533–1537. doi: 10.1097/00001756-199407000-00031. [DOI] [PubMed] [Google Scholar]
- Hutchison WD, Dostrovsky JO, Walters JR, Courtemanche R, Boraud T, Goldberg J, Brown P. Neuronal oscillations in the basal ganglia and movement disorders: evidence from whole animal and human recordings. J Neurosci. 2004;24:9240–9243. doi: 10.1523/JNEUROSCI.3366-04.2004. [DOI] [PMC free article] [PubMed] [Google Scholar]
- Jenkinson N, Brown P. New insights into the relationship between dopamine, beta oscillations and motor function. Trends Neurosci. 2011;34:611–618. doi: 10.1016/j.tins.2011.09.003. [DOI] [PubMed] [Google Scholar]
- Jenkinson N, Kühn AA, Brown P. Gamma oscillations in the human basal ganglia. Exp Neurol. 2013;245:72–76. doi: 10.1016/j.expneurol.2012.07.005. [DOI] [PubMed] [Google Scholar]
- Kemp JM, Powell TP. The structure of the caudate nucleus of the cat: light and electron microscopy. Philos Trans R Soc Lond B Biol Sci. 1971;262:383–401. doi: 10.1098/rstb.1971.0102. [DOI] [PubMed] [Google Scholar]
- Kita H. Globus pallidus external segment. Prog Brain Res. 2007;160:111–133. doi: 10.1016/S0079-6123(06)60007-1. [DOI] [PubMed] [Google Scholar]
- Kita H, Kita T. Role of striatum in the pause and burst generation in the globus pallidus of 6-OHDA-treated rats. Front Syst Neurosci. 2011;5:42. doi: 10.1097/00001756-199905140-00014. [DOI] [PMC free article] [PubMed] [Google Scholar]
- Kita H, Chang HT, Fujimoto K. Pallidal-neostriatal projections of the rat. Soc Neurosci Abstr. 1991;17:453. [Google Scholar]
- Kita H, Tokuno H, Nambu A. Monkey globus pallidus external segment neurons projecting to the neostriatum. Neuroreport. 1999;10:1467–1472. doi: 10.1097/00001756-199905140-00014. [DOI] [PubMed] [Google Scholar]
- Kühn AA, Kupsch A, Schneider GH, Brown P. Reduction in subthalamic 8–35 Hz oscillatory activity correlates with clinical improvement in Parkinson's disease. Eur J Neurosci. 2006;23:1956–1960. doi: 10.1111/j.1460-9568.2006.04717.x. [DOI] [PubMed] [Google Scholar]
- Kühn AA, Tsui A, Aziz T, Ray N, Brücke C, Kupsch A, Schneider GH, Brown P. Pathological synchronisation in the subthalamic nucleus of patients with Parkinson's disease relates to both bradykinesia and rigidity. Exp Neurol. 2009;215:380–387. doi: 10.1016/j.expneurol.2008.11.008. [DOI] [PubMed] [Google Scholar]
- Kumar A, Cardanobile S, Rotter S, Aertsen A. The role of inhibition in generating and controlling Parkinson's disease oscillations in the basal ganglia. Front Syst Neurosci. 2011;5:86. doi: 10.3389/fnsys.2011.00086. [DOI] [PMC free article] [PubMed] [Google Scholar]
- Leblois A, Meissner W, Bioulac B, Gross CE, Hansel D, Boraud T. Late emergence of synchronized oscillatory activity in the pallidum during progressive Parkinsonism. Eur J Neurosci. 2007;26:1701–1713. doi: 10.1111/j.1460-9568.2007.05777.x. [DOI] [PubMed] [Google Scholar]
- Lemaire N, Hernández LF, Hu D, Kubota Y, Howe MW, Graybiel AM. Effects of dopamine depletion on LFP oscillations in striatum are task- and learning-dependent and selectively reversed by L-DOPA. Proc Natl Acad Sci U S A. 2012;109:18126–18131. doi: 10.1073/pnas.1216403109. [DOI] [PMC free article] [PubMed] [Google Scholar]
- Leventhal DK, Gage GJ, Schmidt R, Pettibone JR, Case AC, Berke JD. Basal ganglia beta oscillations accompany cue utilization. Neuron. 2012;73:523–536. doi: 10.1016/j.neuron.2011.11.032. [DOI] [PMC free article] [PubMed] [Google Scholar]
- Levy R, Ashby P, Hutchison WD, Lang AE, Lozano AM, Dostrovsky JO. Dependence of subthalamis nucleus oscillations on movement and dopamine in Parkinson's disease. Brain. 2002;125:1196–1209. doi: 10.1093/brain/awf128. [DOI] [PubMed] [Google Scholar]
- Little S, Pogosyan A, Kuhn AA, Brown P. Beta band stability over time correlates with parkinsonian rigidity and bradykinesia. Exp Neurol. 2012;236:383–388. doi: 10.1016/j.expneurol.2012.04.024. [DOI] [PMC free article] [PubMed] [Google Scholar]
- Loucif KC, Wilson CL, Baig R, Lacey MG, Stanford IM. Functional interconnectivity between the globus pallidus and the subthalamic nucleus in the mouse brain slice. J Physiol. 2005;567:977–987. doi: 10.1113/jphysiol.2005.093807. [DOI] [PMC free article] [PubMed] [Google Scholar]
- Magill PJ, Bolam JP, Bevan MD. Dopamine regulates the impact of the cerebral cortex on the subthalamic nucleus-globus pallidus network. Neuroscience. 2001;106:313–330. doi: 10.1016/S0306-4522(01)00281-0. [DOI] [PubMed] [Google Scholar]
- Mahon S, Deniau JM, Charpier S, Delord B. Role of a striatal slowly inactivating potassium current in short-term facilitation of corticostriatal inputs: a computer simulation study. Learn Mem. 2000;7:357–362. doi: 10.1101/lm.34800. [DOI] [PubMed] [Google Scholar]
- Mallet N, Pogosyan A, Márton LF, Bolam JP, Brown P, Magill PJ. Parkinsonian beta oscillations in the external globus pallidus and their relationship with subthalamic nucleus activity. J Neurosci. 2008a;28:14245–14258. doi: 10.1523/JNEUROSCI.4199-08.2008. [DOI] [PMC free article] [PubMed] [Google Scholar]
- Mallet N, Pogosyan A, Sharott A, Csicsvari J, Bolam JP, Brown P, Magill PJ. Disrupted dopamine transmission and the emergence of exaggerated beta oscillations in subthalamic nucleus and cerebral cortex. J Neurosci. 2008b;28:4795–4806. doi: 10.1523/JNEUROSCI.0123-08.2008. [DOI] [PMC free article] [PubMed] [Google Scholar]
- Mallet N, Micklem BR, Henny P, Brown MT, Williams C, Bolam JP, Nakamura KC, Magill PJ. Dichotomous organization of the external globus pallidus. Neuron. 2012;74:1075–1086. doi: 10.1016/j.neuron.2012.04.027. [DOI] [PMC free article] [PubMed] [Google Scholar]
- Mastro KJ, Bouchard RS, Holt HA, Gittis AH. Transgenic mouse lines subdivide external segment of the globus pallidus (GPe) neurons and reveal distinct GPe output pathways. J Neurosci. 2014;34:2087–2099. doi: 10.1523/JNEUROSCI.4646-13.2014. [DOI] [PMC free article] [PubMed] [Google Scholar]
- Matamales M, Bertran-Gonzalez J, Salomon L, Degos B, Deniau JM, Valjent E, Hervé D, Girault JA. Striatal medium-sized spiny neurons: identification by nuclear staining and study of neuronal subpopulations in BAC transgenic mice. PLoS One. 2009;4:3. doi: 10.1371/journal.pone.0004770. [DOI] [PMC free article] [PubMed] [Google Scholar]
- McCarthy MM, Moore-Kochlacs C, Gu X, Boyden ES, Han X, Kopell N. Striatal origin of the pathologic beta oscillations in Parkinson's disease. Proc Natl Acad Sci U S A. 2011;108:11620–11625. doi: 10.1073/pnas.1107748108. [DOI] [PMC free article] [PubMed] [Google Scholar]
- Miguelez C, Morin S, Martinez A, Goillandeau M, Bezard E, Bioulac B, Baufreton J. Altered pallido-pallidal synaptic transmission leads to aberrant firing of globus pallidus neurons in a rat model of Parkinson's disease. J Physiol. 2012;590:5861–5875. doi: 10.1113/jphysiol.2012.241331. [DOI] [PMC free article] [PubMed] [Google Scholar]
- Muthukumaraswamy SD. Functional properties of human primary motor cortex gamma oscillations. J Neurophysiol. 2010;104:2873–2885. doi: 10.1152/jn.00607.2010. [DOI] [PubMed] [Google Scholar]
- Naito A, Kita H. The cortico-pallidal projection in the rat: an anterograde tracing study with biotinylated dextran amine. Brain Res. 1994;653:251–257. doi: 10.1016/0006-8993(94)90397-2. [DOI] [PubMed] [Google Scholar]
- Nevado-Holgado AJ, Mallet N, Magill PJ, Bogacz R. Effective connectivity of the subthalamic nucleus-globus pallidus network during Parkinsonian oscillations. J Physiol. 2014;592:1429–1455. doi: 10.1113/jphysiol.2013.259721. [DOI] [PMC free article] [PubMed] [Google Scholar]
- Nini A, Feingold A, Slovin H, Bergman H. Neurons in the globus pallidus do not show correlated activity in the normal monkey, but phase-locked oscillations appear in the MPTP model of parkinsonism. J Neurophysiol. 1995;74:1800–1805. doi: 10.1152/jn.1995.74.4.1800. [DOI] [PubMed] [Google Scholar]
- Nisenbaum ES, Wilson CJ, Foehring RC, Surmeier DJ. Isolation and characterization of a persistent potassium current in neostriatal neurons. J Neurophysiol. 1996;76:1180–1194. doi: 10.1152/jn.1996.76.2.1180. [DOI] [PubMed] [Google Scholar]
- Oorschot DE. Total number of neurons in the neostriatal, pallidal, subthalamic, and substantia nigral nuclei of the rat basal ganglia: a stereological study using the cavalieri and optical disector methods. J Comp Neurol. 1996;366:580–599. doi: 10.1002/(SICI)1096-9861(19960318)366:4%3C580::AID-CNE3%3E3.0.CO%3B2-0. [DOI] [PubMed] [Google Scholar]
- Pavlides A, Hogan SJ, Bogacz R. Computational models describing possible mechanisms for generation of excessive beta oscillations in Parkinson's disease. PLoS Comput Biol. 2015;11:12. doi: 10.1371/journal.pcbi.1004609. [DOI] [PMC free article] [PubMed] [Google Scholar]
- Plenz D, Kital ST. A basal ganglia pacemaker formed by the subthalamic nucleus and external globus pallidus. Nature. 1999;400:677–682. doi: 10.1038/23281. [DOI] [PubMed] [Google Scholar]
- Rajakumar N, Elisevich K, Flumerfelt BA. The pallidostriatal projection in the rat: a recurrent inhibitory loop? Brain Res. 1994;651:332–336. doi: 10.1016/0006-8993(94)90714-5. [DOI] [PubMed] [Google Scholar]
- Raz A, Vaadia E, Bergman H. Firing patterns and correlations of spontaneous discharge of pallidal neurons in the normal and the tremulous 1-methyl-4-phenyl-1,2,3,6-tetrahydropyridine vervet model of parkinsonism. J Neurosci. 2000;20:8559–8571. doi: 10.1523/JNEUROSCI.20-22-08559.2000. [DOI] [PMC free article] [PubMed] [Google Scholar]
- Rubin JE, Terman D. High frequency stimulation of the subthalamic nucleus eliminates pathological thalamic rhythmicity in a computational model. J Comput Neurosci. 2004;16:211–235. doi: 10.1023/B:JCNS.0000025686.47117.67. [DOI] [PubMed] [Google Scholar]
- Sarnthein J, Jeanmonod D. High thalamocortical theta coherence in patients with Parkinson's disease. J Neurosci. 2007;21:124–131. doi: 10.1523/JNEUROSCI.2411-06.2007. [DOI] [PMC free article] [PubMed] [Google Scholar]
- Sato F, Lavallée P, Lévesque M, Parent A. Single-axon tracing study of neurons of the external segment of the globus pallidus in primate. J Comp Neurol. 2000;417:17–31. doi: 10.1002/(SICI)1096-9861(20000131)417:1%3C17::AID-CNE2%3E3.0.CO%3B2-I. [DOI] [PubMed] [Google Scholar]
- Saunders A, Huang KW, Sabatini BL. Globus pallidus externus neurons expressing parvalbumin interconnect the subthalamic nucleus and striatal interneurons. PLoS One. 2016;11:e0149798. doi: 10.1371/journal.pone.0149798. [DOI] [PMC free article] [PubMed] [Google Scholar]
- Sharott A, Magill PJ, Harnack D, Kupsch A, Meissner W, Brown P. Dopamine depletion increases the power and coherence of β-oscillations in the cerebral cortex and subthalamic nucleus of the awake rat. Eur J Neurosci. 2005;21:1413–1422. doi: 10.1111/j.1460-9568.2005.03973.x. [DOI] [PubMed] [Google Scholar]
- Shink E, Smith Y. Differential synaptic innervation of neurons in the internal and external segments of the globus pallidus by the GABA- and glutamate-containing terminals in the squirrel monkey. J Comp Neurol. 1995;358:119–141. doi: 10.1002/cne.903580108. [DOI] [PubMed] [Google Scholar]
- Shouno O, Takeuchi J, Tsujino H. The basal ganglia. Vol IX. New York: Springer; 2009. A spiking neuron model of the basal ganglia circuitry than can generate behavioral variability. [Google Scholar]
- Smith Y, Wichmann T. The cortico-pallidal projection: an additional route for cortical regulation of the basal ganglia circuitry. Mov Disord. 2015;30:293–295. doi: 10.1002/mds.26095. [DOI] [PMC free article] [PubMed] [Google Scholar]
- Sohal VS, Zhang F, Yizhar O, Deisseroth K. Parvalbumin neurons and gamma rhythms enhance cortical circuit performance. Nature. 2009;459:698–702. doi: 10.1038/nature07991. [DOI] [PMC free article] [PubMed] [Google Scholar]
- Staines WA, Fibiger HC. Collateral projections of neurons of the rat globus pallidus to the striatum and substantia nigra. Exp Brain Res. 1984;56:217–220. doi: 10.1007/BF00236276. [DOI] [PubMed] [Google Scholar]
- Staines WA, Atmadja S, Fibiger HC. Demonstration of a pallidostriatal pathway by retrograde transport of HRP-labeled lectin. Brain Res. 1981;206:446–450. doi: 10.1016/0006-8993(81)90545-X. [DOI] [PubMed] [Google Scholar]
- Surmeier DJ, Stefani A, Foehring RC, Kitai ST. Developmental regulation of a slowly inactivating potassium conductance in rat neurostriatal neurons. Neurosci Lett. 1991;122:41–46. doi: 10.1016/0304-3940(91)90188-Y. [DOI] [PubMed] [Google Scholar]
- Tachibana Y, Iwamuro H, Kita H, Takada M, Nambu A. Subthalamo-pallidal interactions underlying parkinsonian neuronal oscillations in the primate basal ganglia. Eur J Neurosci. 2011;34:1470–1484. doi: 10.1111/j.1460-9568.2011.07865.x. [DOI] [PubMed] [Google Scholar]
- Tass P, Smirnov D, Karavaev A, Barnikol U, Barnikol T, Adamchic I, Hauptmann C, Pawelcyzk N, Maarouf M, Sturm V, Freund HJ, Bezruchko B. The causal relationship between subcortical local field potential oscillations and Parkinsonian resting tremor. J Neural Eng. 2010;7:16009. doi: 10.1088/1741-2560/7/1/016009. [DOI] [PubMed] [Google Scholar]
- Taverna S, Ilijic E, Surmeier DJ. Recurrent collateral connections of striatal medium spiny neurons are disrupted in models of Parkinson's disease. J Neurosci. 2008;28:5504–5512. doi: 10.1523/JNEUROSCI.5493-07.2008. [DOI] [PMC free article] [PubMed] [Google Scholar]
- Terman D, Rubin JE, Yew AC, Wilson CJ. Activity patterns in a model for the subthalamopallidal network of the basal ganglia. J Neurosci. 2002;22:2963–2976. doi: 10.1523/JNEUROSCI.22-07-02963.2002. [DOI] [PMC free article] [PubMed] [Google Scholar]
- Turner RS, Anderson ME. Context-dependent modulation of movement-related discharge in the primate globus pallidus. J Neurosci. 2005;25:2965–2976. doi: 10.1523/JNEUROSCI.4036-04.2005. [DOI] [PMC free article] [PubMed] [Google Scholar]
- van der Meer MAA, Redish AD. Low and high gamma oscillations in rat ventral striatum have distinct relationships to behavior, reward, and spiking activity on a learned spatial decision task. Front Integr Neurosci. 2009;3:9. doi: 10.3389/neuro.07.009.2009. [DOI] [PMC free article] [PubMed] [Google Scholar]
- Vitek JL, Hashimoto T, Peoples J, DeLong MR, Bakay RA. Acute stimulation in the external segment of the globus pallidus improves parkinsonian motor signs. Mov Disord. 2004;19:907–915. doi: 10.1002/mds.20137. [DOI] [PubMed] [Google Scholar]
- Vitek JL, Zhang J, Hashimoto T, Russo GS, Baker KB. External pallidal stimulation improves parkinsonian motor signs and modulates neuronal activity throughout the basal ganglia thalamic network. Exp Neurol. 2012;233:581–586. doi: 10.1016/j.expneurol.2011.09.031. [DOI] [PMC free article] [PubMed] [Google Scholar]
- Walters JR, Hu D, Itoga CA, Parr-Brownlie LC, Bergstrom DA. Phase relationships support a role for coordinated activity in the indirect pathway in organizing slow oscillations in basal ganglia output after loss of dopamine. Neuroscience. 2007;144:762–776. doi: 10.1016/j.neuroscience.2006.10.006. [DOI] [PMC free article] [PubMed] [Google Scholar]
- Weinberger M, Mahant N, Hutchison WD, Lozano AM, Moro E, Hodaie M, Lang AE, Dostrovsky JO. Beta oscillatory activity in the subthalamic nucleus and its relation to dopaminergic response in Parkinson's disease. J Neurophysiol. 2006;96:3248–3256. doi: 10.1152/jn.00697.2006. [DOI] [PubMed] [Google Scholar]
- Whittington MA, Traub RD, Kopell N, Ermentrout B, Buhl EH. Inhibition-based rhythms: experimental and mathematical observations on network dynamics. Int J Psychophysiol. 2000;38:315–336. doi: 10.1016/S0167-8760(00)00173-2. [DOI] [PubMed] [Google Scholar]
- Williams D, Tijssen M, Van Bruggen G, Bosch A, Insola A, Di Lazzaro V, Mazzone P, Oliviero A, Quartarone A, Speelman H, Brown P. Dopamine-dependent changes in the functional connectivity between basal ganglia and cerebral cortex in humans. Brain. 2002;125:1558–1569. doi: 10.1093/brain/awf156. [DOI] [PubMed] [Google Scholar]
- Wilson CJ. What controls the timing of striatal spiny cell action potentials in the up state? In: Groenewegen HJ, Berendse HW, Cools AR, Voorn P, Mulder AB, editors. Basal Ganglia IX. Springer; 2009. pp. 49–61. [Google Scholar]
- Wilson CJ, Kawaguchi Y. The origins of two-state spontaneous membrane potential fluctuations of neostriatal spiny neurons. J Neurosci. 1996;16:2397–2410. doi: 10.1523/JNEUROSCI.16-07-02397.1996. [DOI] [PMC free article] [PubMed] [Google Scholar]
- Wolf JA, Moyer JT, Lazarewicz MT, Contreras D, Benoit-Marand M, O'Donnell P, Finkel LH. NMDA/AMPA ratio impacts state transitions and entrainment to oscillations in a computational model of the nucleus accumbens medium spiny projection neuron. J Neurosci. 2005;25:9080–9095. doi: 10.1523/JNEUROSCI.2220-05.2005. [DOI] [PMC free article] [PubMed] [Google Scholar]
- Yim MY, Aertsen A, Kumar A. Significance of input correlations in striatal function. PLoS Comput Biol. 2011;7:11. doi: 10.1371/journal.pcbi.1002254. [DOI] [PMC free article] [PubMed] [Google Scholar]