Abstract
Heterocyclic dications are receiving increasing attention as targeted inhibitors of transcription factors. While many dications act as purely competitive inhibitors, some fail to displace protein efficiently at drug concentrations expected to saturate their DNA target. To achieve a mechanistic understanding of these non-competitive effects, we used a combination of dications, which are intrinsically fluorescent and spectrally-separated fluorescently labeled DNA to dissect complex interactions in multi-component drug/DNA/protein systems. Specifically, we interrogated site-specific binding by the transcription factor PU.1 and its perturbation by DB270, a furan-bisbenzimidazole-diamidine that strongly targets PU.1 binding sites yet poorly inhibits PU.1/DNA complexes. By titrating DB270 and/or cyanine-labeled DNA with protein or unlabeled DNA, and following the changes in their fluorescence polarization, we found direct evidence that DB270 bound protein independently of their mutual affinities for sequence-specific DNA. Each of the three species competed for the other two, and this interplay of mutually dependent equilibria abrogated DB270's inhibitory activity, which was substantively restored under conditions that attenuated DB270/PU.1 binding. PU.1 binding was consistent with DB270's poor inhibitory efficacy of PU.1 in vivo, while its isosteric selenophene analog (DB1976), which did not bind PU.1 and strongly inhibited the PU.1/DNA complex in vitro, fully antagonized PU.1-dependent transactivation in vivo.
INTRODUCTION
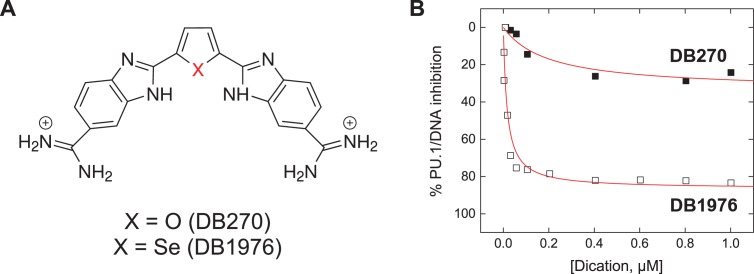
Once considered ‘undruggable,’ there is now a growing appetite for inhibiting macromolecular interfaces of complexes involved in key biochemical pathways. Relative to protein/protein interfaces, which remain challenging propositions (1), inhibition of protein/DNA interfaces is significantly more tractable. Specifically, the DNA minor groove represents a well-defined target for the rational design of sequence-specific inhibitors, exemplified by pyrrole-imidazole polyamides (2) and more recently by new heterocyclic dications (3). With strong sequence selectivity, favorable druglikedness and extensive clinical experience (4), dications are attractive scaffolds for developing targeted transcriptional inhibitors. We have been investigating the inhibitory potential of AT-selective heterocyclic dications on the transcription factor PU.1, which binds similarly AT-rich sites (5). While many dications competitively displaces DNA-bound PU.1, some analogs are poor inhibitors even at concentrations that would saturate the PU.1 binding site in the protein's absence. Such symptoms of non-competitive interactions are not explained by simple schemes that account for differences in inhibitory potency (IC50) alone. One striking example is DB270, a furan-bisbenzimidazole-diamidine that tightly binds AT-rich PU.1 binding sites with 10−9 M affinity but negligibly inhibits the site-specific protein/DNA complex at 10−6 M (Figure 1). In contrast, its isosteric selenophene analogue DB1976, which differs only by a single heteroatom, both binds PU.1 sites tightly and efficiently displaces DNA-bound PU.1. As incomplete inhibition of PU.1 binding implies impaired pharmacologic efficacy, a key parameter of a compound's therapeutic potential, a deeper characterization of non-competitive dication interactions is needed, but the paucity of such data is currently limiting in this regard.
Figure 1.
DB270 and DB1976: two isosteres with contrasting inhibitory efficacy on the transcription factor PU.1. (A) DB270 and DB1976 are classic heterocyclic dications with strong affinity and selectivity for AT-rich sequences commonly found in cognate DNA binding sites for PU.1. (B) Despite similar DNA-binding properties on their own, the two isosteres differ markedly in their ability to inhibit PU.1. When inhibition of PU.1 binding to the λB motif (5′-AATAAAAGGAAGTG-3′), a natural high-affinity DNA binding site, was measured by biosensor-SPR, only DB1976 effectively displaced with DNA-bound PU.1 (5). The poor inhibitory efficacy seen with DB270 indicated additional non-competitive interactions at work.
To dissect the mechanistic details of the non-competitive interactions by dications, we employed fluorescence polarization (FP) to probe the behavior of DB270 in the presence of target DNA and/or PU.1. FP reports on the change in rotational correlation of a fluorophore during its excited state between the unbound and receptor-bound states (6). Compared with surface-binding techniques such as surface plasmon resonance (SPR) and electrophoretic mobility shift, FP provides a highly complementary window into drug/DNA/protein interactions, in homogenous solution, via the intrinsic blue fluorescence of the dications. Together with spectrally-separated, fluorescently-labeled DNA, we interrogated drug/DNA, protein/DNA, drug/protein and drug/DNA/protein binding in a multi-dimensional approach and comprehensively defined the mutual interactions among the three species. The data revealed DB270/PU.1 interactions that were independent of their respective DNA-binding properties. The affinity and stoichiometry of DB270/DNA binding conspired such that the presence of PU.1 efficiently sequestered DB270 from inhibiting the PU.1/DNA complex. In contrast, the selenophene analog DB1976 exhibited no affinity for PU.1. In addition, this difference correlated with the two analogues’ dose-response profiles, wherein DB1976 acted as a fully efficacious PU.1 inhibitor in vivo, but DB270 did not.
MATERIALS AND METHODS
Protein expression and purification
A recombinant PU.1 construct harboring the DNA-binding ETS domain (murine residues 167–272 or PU.1ΔN167), was cloned with a thrombin-cleavable C-terminal 6xHis tag and over-expressed in Escherichia coli as described (7,8). Bacterial pellets were resuspended in 0.1 M NaH2PO4/Na2HPO4, pH 8.0, with 0.5 M NaCl, 5 mM imidazole and 0.1 mM phenylmethanesulfonyl fluoride at 10 ml/g wet weight and shear-homogenized (Microfluidics M-110P). The lysate was cleared by centrifugation and loaded onto immobilized-metal affinity chromatography resin. After extensive washing, protein was eluted in the presence of 0.25 M imidazole. The 6xHis tag was cleaved with thrombin (1 U/10 ml eluate) while dialyzed at room temperature against 10 mM NaH2PO4/Na2HPO4, pH 7.5, 0.5 M NaCl overnight, and the preparation was loaded onto a cation exchange column (HiTrap Sepharose SP HP, GE) under the control of a Bio-Rad NGS Quest 10 instrument. After washing out residual impurities, purified protein was eluted by a NaCl gradient to 2 M. Purified protein was extensively dialyzed against binding buffer (10 mM Tris–HCl, pH 7.4 at 25°C, 150 mM NaCl). Protein concentration was determined by UV absorption at 280 nm using the extinction coefficient ϵ280 = 22,460 M−1 cm−1 and molecular weight verified by mass spectrometry (Supplementary Figure S1, Supporting Information).
DNA and DNA-binding compounds
Synthetic DNA oligos were purchased from Integrated DNA Technologies (Coralville, IA, USA) and annealed to form duplex PU.1 binding sites (Table 1) as described previously (9,10). Fluorescent DNA probes were constructed by annealing oligos harboring an internal cyanine dye (Cy3 or Cy5) in the backbone with an unlabeled complementary strand, the latter at 10% molar excess. The unlabeled strand contained an unpaired nucleotide to accommodate the internal cyanine dye in the labeled strand. Oligo concentrations were determined spectrophotometrically using nearest-neighbor methods (11). The synthesis and chemical analyses of the DNA-binding heterocyclic dications DB270 (12) and DB1976 (5) had been previously reported. Concentrated stocks (1 mM) were prepared in water.
Table 1. DNA sequences used to investigate DB270/DNA/PU.1 interactions.
| Name | Sequence | Reference |
|---|---|---|
| λB | 5′-GCGAATAAAAGGAAGTGAAACCG-3′ | (20) |
| [5′]AGC | 5′-GCGAATAAGCGGAAGTGAAACCG-3′ | (23) |
| SC1 | 5′-CGGCCAAGCCGGAAGTGAGTGCC-3′ | (24) |
| NS | 5′-GCGAATAAGCGAGAGTGAAACCG-3′ | (9) |
Typical of members of the ETS family of transcription factors, PU.1 recognizes an array of sequences bearing a central 5′-GGAA-3′ consensus (in bold). High-affinity DNA binding sites for PU.1 in vivo also frequently harbor A-tracks, defined as four or more consecutive AT base pairs (18). AT-selective heterocyclic dications such as DB270 and DB1976 target A-tracks in sequences such as the λB motif (5), a natural PU.1 binding site in the murine Igλ2-4 enhancer. [5′]AGC is derived from the λB motif and has the highest reported affinity for PU.1. SC1 is a non-AT rich sequence that PU.1 recognizes in vitro, while NS is a sequence isomer of [5′]AGC in which the central consensus is mutated to the non-cognate 5′-GAGA-3′.
Fluorescence polarization (FP)
Titrations of fluorescent probes were measured by steady-state fluorescence anisotropy in a Perkin Elmer LS 55 or Cary Eclipse instrument at room temperature. Deployment of polarizers, measurements of polarized intensities and computation of grating factors were controlled by the instruments’ software. Samples were measured in macro or semi-micro cuvettes at initial volumes of 3.5 or 0.6 ml, respectively. Titrations were designed such that the cumulative volume increment was no more than 10% at completion. Fluorescent probes were used at the lowest concentration at which they generated reliable signals, operationally defined as >5% of the saturating intensity at their excitation and emission maxima: DB 270 at 10 nM (358/420 nm); Cy3-and Cy5-labeled DNA probes at 1 nM (522/563 nm) and 3 nM (637/672 nm), respectively. Slit widths were set at 2.5 and 20 nm for excitation and emission, respectively. Each data point is represented as mean ± S.E. of five consecutive measurements for up to 100 s of integration time.
Model-dependent binding analysis
The observed fluorescence anisotropy (<r>) of a probe (X) was mapped as a linear combination of the anisotropies of its unbound and bound states, as a function of total titrant (A) concentration:
 |
(1) |
[Xi]b and <ri> are the concentration and intrinsic anisotropy of the probe in the i-th bound state, respectively, and <r0> is the anisotropy of the unbound probe. Total probe concentration is the summed contributions of the free and bound states:  . To facilitate assignment of parameters to the various species, we adopt a three-digit numeric code xyz, where x, y and z refer to stoichiometric equivalents of DB270, DNA and PU.1, receptively: DB270:DNA ≡ 110, DNA:PU.1 ≡ 011, DB270/PU.1 ≡ 101, etc.
Following previously described approaches (13,14), bound probe concentration was computed from models formulated as functions ƒ of total concentrations of titrant (A), probe (X), other relevant titrates (B) and the vector of parameters θ (equilibrium dissociation constants Ki, intrinsic anisotropies <ri> and stoichiometric coefficients):
 |
(2) |
Formulation of each model is detailed in Supplementary Methods. In general, ƒ was numerically solved as a single-variable function in [A]t using optimized routines (the NAG C Library, Oxford, UK or Mathematica, Wolfram, Champaign, IL, USA) and neglecting the small dilutions in [X]t and [B]t. Trials with representative datasets showed no meaningful effects on the goodness of fit or θ relative to tracking [X]t and [B]t at each step of the titration (Supplementary Figure S2, Supporting Information).
Parameter estimation was performed with Origin 9.1 (Northampton, MA, USA) with titrant concentrations on semi-logarithmic scale. Anisotropy of the probe in the absence of titrant was assigned to a concentration of log [titrant, M] = −15. Linear parameters from a single fit are given with standard errors (S.E.); uncertainties for non-linear parameters are given as 95% joint confidence limits computed by the F test for joint parameters. Parameters from replicate experiments are given as mean ± S.E.
Functional inhibition of the PU.1 transactivation
The functional inhibition of PU.1 transactivation by heterocyclic diamidines in live cells was measured using a fluorescent EGFP reporter, as previously described (5) and optimized as follows. A PU.1-expression plasmid was cloned by inserting a fragment encoding full-length human PU.1 fused to an infra-red RFP (iRFP) (15) reporter between the NheI/BamHI sites of pcDNA3.1(+). The fusion was linked by a sequence encoding a self-cleaving 2A peptide (16). Cultured HEK293 cells, which do not express PU.1, were transfected with the PU.1 expression plasmid for 24 h. Cells were then re-transfected, in the absence or presence of compounds, with an EGFP-based reporter under the control of a minimal promoter that was downstream from a synthetic λB-based enhancer (5). Following an additional 24 h, cells were trypsinized and counted by flow cytometry on two spectrally isolated channels for EGFP (488/511 nm) and iRFP (640/>670 nm).
RESULTS AND DISCUSSION
Binding of an AT-selective heterocyclic dication to PU.1 binding sites of different AT content
Classic heterocyclic dications, as exemplified by DB270, are DNA minor groove binders with strong selectively for AT-rich sequences (17). Several parents of DB270, notably DB75 (furamidine), are potent ligands for A-tracks, defined as four or more contiguous A/T base pairs (18), that densely populate kinetoplast DNA in trypanosomes (19). We have previously identified a panel of dications including DB270 that also targeted the A-track within the λB motif (5′-AATAAAAGGAAGTG-3′), a cognate binding site for transcription factor PU.1 in the murine Igλ2-4 enhancer element (5,20). Since the AT content of PU.1-binding sites varies (21,22), and to establish FP measurements of DB270/DNA binding, we titrated DB270 with duplex DNA oligos harboring λB or two other PU.1-binding sequences: 5′-AATAAGCGGAAGTG-3′ (termed [5′]AGC, 5-bp A-track) (23) and 5′-CCAAGCCGGAAGTG-3′ (termed SC1, no A-track) (24) (Table 1). When saturated with DNA, the fluorescence intensity of DB270 increased by ∼35% (Figure 2A), while anisotropy jumped over 3-fold (Figure 2B), corresponding to a ∼10-fold wider dynamic range by FP than total fluorescence intensity.
Figure 2.
Sequence-dependent binding of DB270 with duplex DNA sites as measured by fluorescence polarization (FP). (A) Emission spectra of DB270 at 10 nM in the absence (dashed) or 1 μM of duplex DNA harboring the [5′]AGC sequence (solid). (B) Representative titrations of DB270 (10 nM) with unlabeled duplex DNA harboring the λB (circles), [5′]AGC (squares) or SC1 site (diamonds) in the presence of 300 mM Na+. DNA sequences of the three sites are given in Table 1. Curves represent a global fit of the three datasets with a 1:1 binding model in which the anisotropies of the free and bound states are shared parameters. (C) Log–log plot of the dissociation constants for DB270/DNA binding at various NaCl concentrations. Lines represent a global linear fit of all the data points with a shared, fitted slope of 2.1 ± 0.2. The extrapolated affinities of DB270 at 150 mM Na+ for the λB and [5′]AGC sequences are 0.19 ± 0.04 and 1.3 ± 0.3 nM, respectively (Table 2).
Since DB270 bound A-track DNA very tightly, the 10 nM of DB270 needed for reliable FP signals represented a prohibitively depleting concentration for titration at physiological salt concentrations. We therefore performed titrations over a range of higher NaCl concentrations, from 300 to 800 mM NaCl and back-extrapolated to 150 mM (Figure 2C). DB270 bound λB the most tightly (KD = 0.26 ± 0.10 nM) in 150 mM Na+ and ∼6-fold more strongly than the shorter A-track in [5′]AGC, and over 103-fold over SC1, which lacked an A-track. We also found that the affinity of DB270 for λB in phosphate buffer was ∼10-fold weaker than measured in Tris–HCl at the same total Na+ concentration (Supplementary Figure S2, Supporting Information), suggesting strong electrostatic interactions between DB270 and free phosphate. The affinities of DB270 for all three DNA sequences exhibited identical salt dependence, consistent in terms of polyelectrolyte theory (25) with the neutralization of two DNA backbone phosphates by a single dication in a 1:1 DB270/DNA complex.
FP measurements of high-affinity PU.1/DNA binding
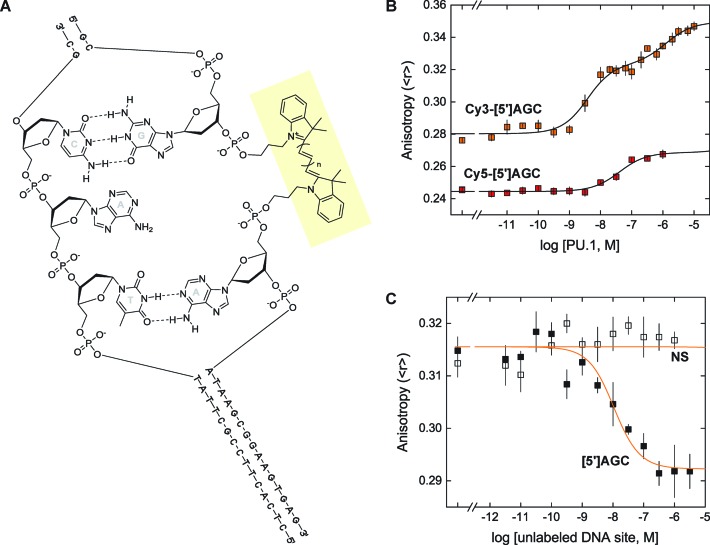
In anticipation of the need for spectral separation from the broad emission peak of DB270 centered at 420 nm (c.f. Figure 2A), we used DNA probes carrying an internal cyanine (Cy3 or Cy5) label. The Cy label was positioned between adjacent phosphates distal to a [5′]AGC binding site (Figure 3A). The anisotropies of both single-stranded probes were comparable (Cy3: 0.23; Cy5: 0.21) and increased similarly when annealed with the same complementary strand. However the two probes, which differed only in a single methine group, showed opposite changes in fluorescence between the single- and double-stranded states, as well as between the free and PU.1-bound states (Supplementary Figure S3, Supporting Information). In addition, thermal melting experiments revealed a 10°C lower melting temperature for the Cy5-labeled duplex than its Cy3-labeled counterpart (Supplementary Figure S3).
Figure 3.
Characterization of PU.1/DNA interactions using internally cyanine-labeled DNA probes. (A) Structure of the Cy-labeled DNA probes harboring the [5′]AGC sequence. The labels (in highlight) were incorporated on the strand harboring the 5′-GGAA-3′ consensus. For Cy3, n = 1; for Cy5, n = 2. An unpaired adenine in the complementary strand provides spacing for the dye. (B) Representative direct titrations of Cy3- (1 nM) and Cy5-labeled [5′]AGC probes (3 nM) by PU.1 ETS domain. Curves represent a global fit of the data to a sequential 2:1 binding model as represented by Scheme 1. For the Cy5-[5′]AGC, the dissociation constant for the second equivalent of PU.1 was fixed at log K012 = −3. (C) Representative competitive titrations of 1 nM of Cy3-[5′]AGC by unlabeled [5′]AGC (solid symbols) and a non-specific site (NS, open symbols) in the presence of 2 nM of PU.1. Curves represent a global fit of the data to a one-site competitive model with the dissociation constant of the PU.1/Cy3-[5′]AGC complex fixed at the value determined by direct titration of the probe in Panel B. The dissociation constant for the NS site was set at log K011 = −3. Parametric values from replicate experiments are given in Table 2.
Prompted by the photophysical and thermodynamic differences between the two Cy-labeled probes, we titrated, in separate experiments, the two probes with recombinant PU.1 ETS domain (PU.1ΔN167; Figure 3B). Although the two probes harbored the same DNA sequence, they were strongly differentiated by PU.1. The Cy3-labeled probe bound PU.1 ∼10-fold more strongly than its Cy5-labeled counterpart, and exhibited biphasic binding up to a protein concentration of 10−6 M. The biphasic binding curve was well described by a sequential binding scheme (Scheme 1).
Scheme 1.
We had previously observed sequential PU.1 binding to a single DNA binding site by isothermal titration calorimetry, but the high concentrations required (>104 M) and high affinity of the 1:1 complex precluded a direct determination of the equilibrium constants (10). The FP data with Cy3-labeled [5′]AGC showed that the second equivalent bound the DNA probe over 900-fold more weakly (Table 2). Titration of an externally labeled DNA duplex yielded a binding profile in agreement with the Cy3 data (Supplementary Figure S4, Supporting Information), indicating that biphasic binding reflected the intrinsic property of the DNA sequence, rather than an effect of the internal Cy3 label.
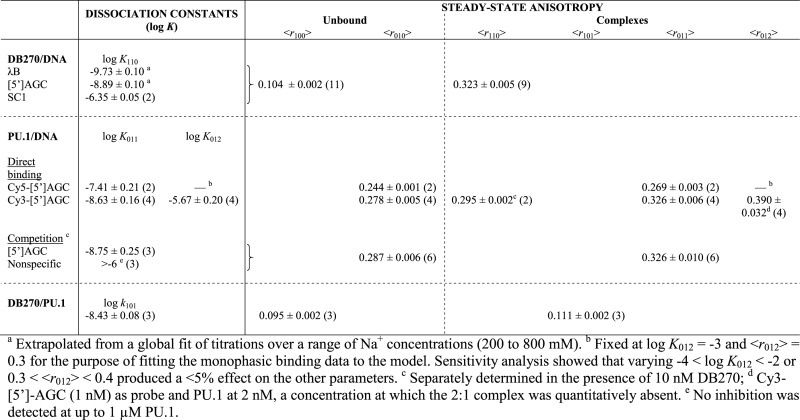
Table 2. Parametric values from mechanistic analysis of binary DB270/DNA/PU.1 interactions. Pairwise interactions between the three components were measured by FP changes (in terms of steady-state anisotropy, <r>) using DB270 (10 nM) or internally Cy3- and Cy5-labeled DNA (1 and 3 nM, respectively) harboring the high-affinity [5′]AGC sequence as probes. DNA sequences are given in Table 1. The nature of the models and notation of the subscripts are as described in the text (c.f. Schemes 1–3) and detailed in Supplemental Methods. All experiments summarized here are performed in 10 mM Tris–HCl, pH 7.4 and 150 mM NaCl. Values are means ± S.E. of N replicate experiments (in parenthesis) in which the parameter was directly estimated.
|
To further establish the Cy3-labeled probe, we performed competitive titrations in which fixed concentrations of probe (1 nM) and PU.1 (2 nM) were titrated with unlabeled DNA sites (Figure 3C). Titration with a non-specific sequence failed to displace PU.1-bound probe and confirmed the specificity of the PU.1/probe complex. When analyzed by a one-site model, which was appropriate at the low PU.1 concentration used, both Cy3-labeled and unlabeled [5′]AGC bound PU.1 equally well within experimental uncertainty (Table 2), indicating that the internal Cy3-label was minimally perturbative with respect to PU.1 binding. Additionally, independent analysis of the direct binding and competition data yielded equal anisotropies of the unbound and singly-bound state for the probe within experimental uncertainty (Table 2), supporting the internal consistency of our FP measurements of PU.1/DNA interactions and their underlying mechanistic assumptions.
DB270 binds PU.1 in the absence of DNA
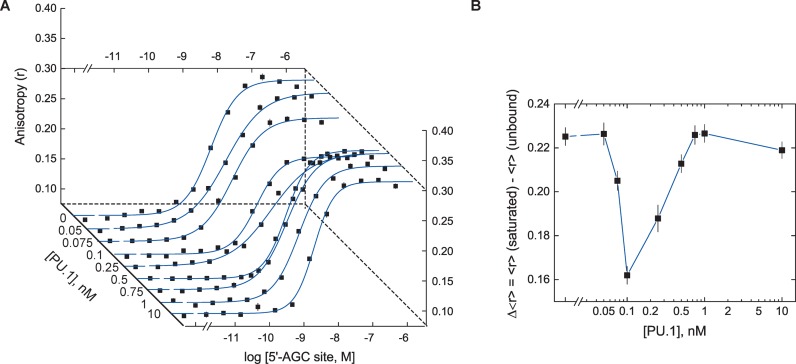
Having established FP measurements of DNA binding by DB270 and PU.1, we studied the perturbation of PU.1/DNA recognition by the small molecule. Given the strong affinity of PU.1 for the [5′]AGC sequence, we initially analyzed the competitive effect of PU.1 on the tight binding of DB270 to [5′]AGC at 150 mM NaCl. In separate direct binding experiments, we titrated DB270 (10 nM) with unlabeled [5′]AGC sites in the presence of up to 10 nM of PU.1 ETS domain. Instead of an attenuation in the apparent affinity of DB270 for its target DNA site, we observed a PU.1-dependent change in the anisotropy of bound DB270 at saturation (Figure 4A): the capacity of the binding curves decreased at 10−10 M of PU.1 but was restored once PU.1 concentration exceeded 10−9 M (Figure 4B). Such changes in capacity was incompatible with strictly competitive inhibition and indicated additional interactions at work.
Figure 4.
DB270/DNA titrations in the presence of PU.1 reveal multiple interactions. (A) Representative direct titrations of DB270 with (unlabeled) duplex DNA harboring the [5′]AGC site at fixed concentrations of PU.1 ETS domain as indicated along the diagonal abscissa. Curves represent empirical fits of the data to the Hill equation. (B) The fitted capacities of the binding curves in Panel A as a function of the PU.1 concentration present.
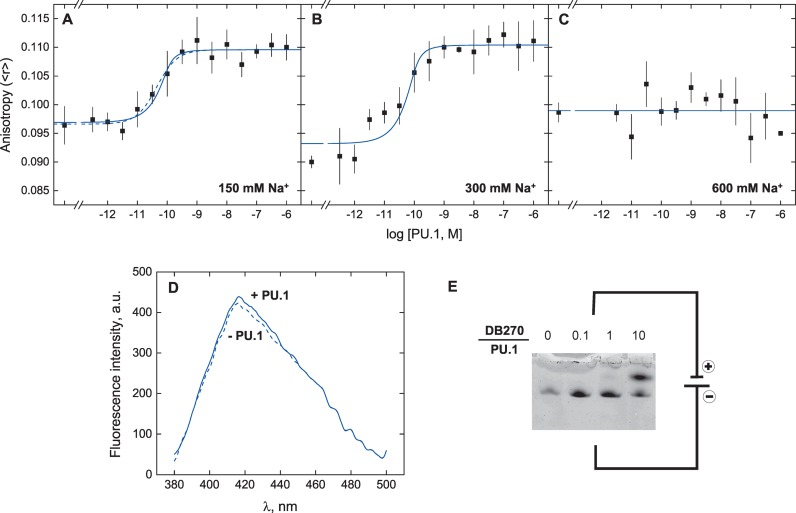
Since the observed anisotropy reflects the probe in its unbound and all of its bound states, we hypothesized that DB270 bound PU.1 as well as DNA. We therefore titrated DB270 (10 nM) with PU.1 ETS domain in the absence of DNA, and observed a concentration-dependent increase in anisotropy (Figure 5A) which was reproduced in 300 mM Na+ (Figure 5B), but not in 600 mM Na+ (Figure 5C). Although the anisotropy changes at 150 and 300 mM Na+ were modest (Δ<r> ∼ 0.02), they were well above experimental noise, and accompanied by a corresponding increase in total fluorescence intensity (150 mM Na+ shown in Figure 5D). Significantly, a 1:1 model fitted the binding data poorly, and suggested that the protein bound multiple equivalents of DB270. We found that a minimal model in which DB270 bound PU.1 at n independent sites with a microscopic dissociation constant k101 (Scheme 2) afforded a good fit to the data.
Figure 5.
DB270 binds PU.1 in the absence of DNA. Representative direct titrations of 10 nM of DB270 with PU.1 ETS domain at 150 mM (A), 300 mM (B) and 600 mM NaCl (C). Curves represent an empirical fit of the data to the Hill equation (dashed) or a mechanistic fit (solid) to a model in which DB270 binds n independent sites on PU.1 with a microscopic dissociation constant k101, as defined by Scheme 2. Parametric values are given in Table 2. (D) Emission spectra of 10 nM of DB270 in the free state (dashed) and when saturated with 1 μM of PU.1Δ167 (solid). The sample was excited at 358 nm. (E) Electrophoretic resoloution of the PU.1/DB270 complex. Mixtures of 1 μg of PU.1 (∼70 pmol) were titrated with graded amounts of DB270 before separation on a 12% non-denaturing polyacrylamide gel. Note the anode at the bottom of the gel.
Scheme 2.
The phenomenological dissociation constant is K101 = k101/n. As implied in this relationship, n and k101 tended to be highly correlated parameters and one of the two needed to be independently determined to yield an unbiased estimation of the other. To do so, we inferred the stoichiometry of the DB270/DNA complex from the capacity change in the DB270/DNA direct binding data (Figure 4B), and took the PU.1 concentration at the lowest observed capacity (0.1 nM) as the saturating concentration of PU.1 for the 10 nM of DB270 present. This estimate gave a DB270:DNA ratio of n = 100, and an average log k101 = −8.43 ± 0.08.
To establish the implications Scheme 2 and the PU.1/DB270 complex directly, we resolved mixtures of PU.1 and DB270 in 150 mM Na+ by polyacrylamide electrophoresis under native, non-denaturing conditions (Figure 5E; Supplemental Methods). At protein levels just sufficient for detection by Coomassie Blue staining (1 μg, corresponding to 7 μM prior to electrophoresis), excess DB270 induced the appearance of a second species of reduced mobility. The requirement for excess DB270, reduced mobility and high resolution of this band were all consistent with defined, high-stoichiometric binding of a small dication to PU.1. The electrophoretic data therefore supported the FP titrations and directly showed that DB270 bound PU.1 avidly to form a discrete complex.
DB270/PU.1 binding abrogates inhibition of the target PU.1/DNA complex
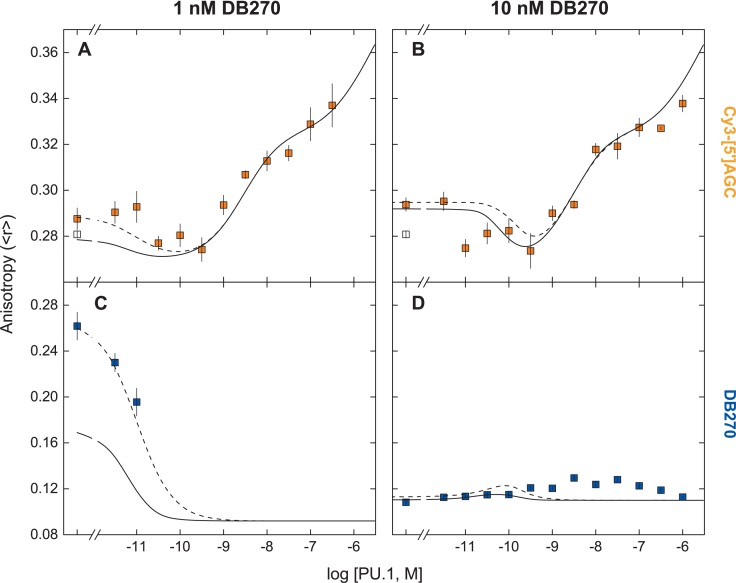
What is the quantitative effect of DB270/PU.1 binding on DNA recognition by PU.1? To interrogate this three-component system in situ, we undertook a two-dimensional analysis by co-titrating DB270 (1–10 nM) and Cy3-labeled [5']AGC site (1 nM) with PU.1 and measured the anisotropies of the two probes as each interacted with the protein as well as with each other. We chose the Cy3-labeled probe for its spectral separation from DB270's blue fluorescence (Supplementary Figure S5, Supporting Information) and the similarity of its PU.1-binding properties to the unlabeled DNA sequence. The non-monotonic changes in anisotropy of the DNA probe as a function of PU.1 concentration, namely the initial drop in anisotropy to a level corresponding to the unbound state (Figure 6A and B), immediately suggested multiple simultaneous equilibria. The precipitous drop in the anisotropy of DB270 at 1 nM could not be followed at higher PU.1 concentration due to a critical loss of the low fluorescence intensity of unbound DB270 at 1 nM (Figure 6C). At 10 nM, the anisotropy of DB270 was dominated by excess unbound compound relative to DNA prior to the addition of PU.1 (Figure 6D). With increasing PU.1 levels, DB270's anisotropy exhibited a modal profile that converged to the anisotropy of the DB270/PU.1 complex with PU.1 in vast excess, again indicative of complex interactions among the three species.
Figure 6.
Two-dimensional FP analysis of DB270/DNA/PU.1 interactions. DB270 at 1 or 10 nM, plus 1 nM of Cy3-labeled DNA probe harboring the [5′]AGC sequence, were co-titrated with PU.1 ETS domain. At each step the anisotropies of Cy3-[5′]AGC (A and B) and DB270 (C and D) were measured. The anisotropy of the Cy3-[5′]AGC probe alone is shown as open symbols. Curves represent a direct computation of the mutually competitive model as represented by Scheme 3 using only relevant parametric values from Table 2 (solid), or the same set of parameters with exception of the DB270/DNA dissociation constant set at log K110 = −10. N.B.: The curves are not optimized fits to the data; rather they are predicted anisotropies computed from Table 2, without adjustment or any additional floating parameters.
To model the two-dimensional FP data quantitatively, we combined the features of the pairwise interactions among the three components as represented by Scheme 3.
Scheme 3.
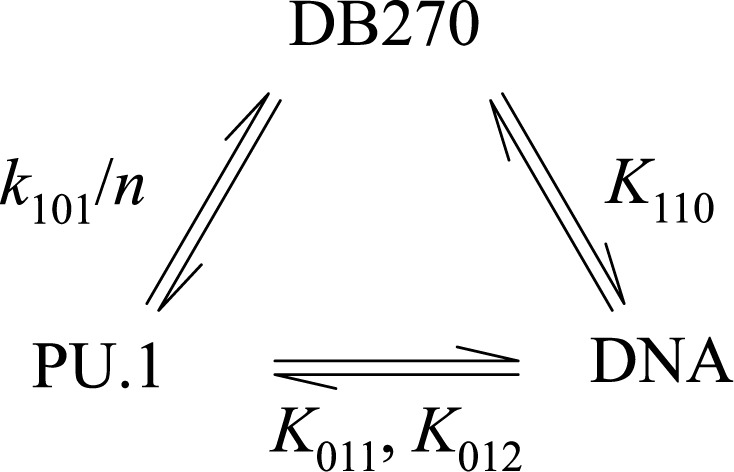
The model postulates that each component partitions between competitive interactions with the other two, but without formation of a ternary complex. We challenged Scheme 3 to explain the two-dimensional data by computing the model-predicted binding profiles for both PU.1 and DB270 using, without adjustment and with no floating parameters, the independently determined affinities and anisotropies in Table 2 (solid lines in Figure 6). We found good agreement with the Cy3 signals at both DB270 concentrations. With respect to DB270, the model conformed less well but the lack of fit with the DB270 data at 1 nM suggested that the value of the dissociation constant of DB270, taken from that measured with unlabeled DNA, might overestimate the dissociation constant for the Cy3-labeled DNA probe. We therefore varied the DB270/DNA affinity (K110) and found that the fit could be improved if the probe bound DB270 more tightly than the unlabeled DNA (dashed lines in Figure 6). Nonetheless, it was clear that the model would not recapitulate the full scale of the DB270 signals at 10 nM without compromising the fit to the Cy3-DNA data (Figure 6D). The ‘excess’ DB270 anisotropies at PU.1 concentrations coincident with the 1:1 PU.1/DNA complex suggested a ternary DB270/DNA/PU.1 complex, which was not included in our model. However, the good agreement of Scheme 3 to the Cy3-DNA binding profile argued that, if such a complex was formed, the incorporation of DB270 must contribute negligibly to the anisotropy of the Cy3 label, and bound PU.1 equally well regardless of the DNA.
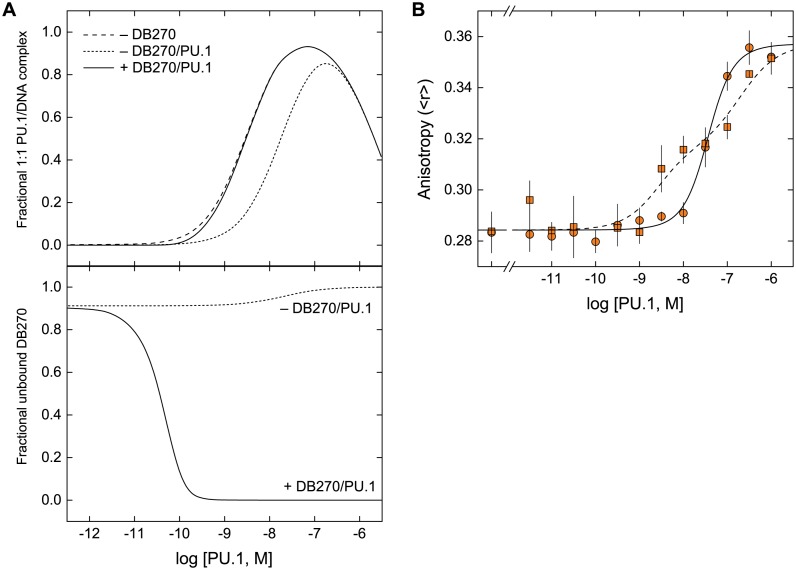
Given the apparent complexity of PU.1/DNA binding in the presence of DB270 and the ability of Scheme 3 to quantitatively model DNA recognition by PU.1 in the presence of DB270 (even though it did not fully describe the disposition of DB270), we used the model to determine the extent to which the compound perturbs the 1:1 PU.1:DNA complex, the presumptive transcriptionally active species (26). Thus, PU.1 binding usurps DB270's inhibition of the 1:1 PU.1/DNA complex through a profound depletion of the compound (Figure 7A). Although DB270/PU.1 binding also prevents the protein from DNA binding, the interaction's high affinity and high stoichiometry for DB270 renders the sequestration asymmetric in favor of PU.1. Minor inhibition of the PU.1/DNA complex only occurs at low concentrations of PU.1 when sufficient free DB270 is available to bind the DNA target.
Figure 7.
DNA-independent binding to PU.1 is the mechanism of impaired PU.1 inhibition. (A) Abundance of the transcriptionally active 1:1 PU.1/DNA complex and unbound DB270 as computed from a mutually competitive model (Scheme 3) for 10 nM of DB270 and 1 nM of [5′]AGC site using the parametric values in Table 2 (solid curve). The case of no DB270 (dashed curve) and if DB270/PU.1 interactions were absent (log k101 = −3; dotted curve) are also shown for comparison. Note that excess PU.1 drives the formation of the 2:1 protein/DNA complex, and dissociation of free DNA-bound DB270 in the absence of other interactions. (B) Inhibition of the PU.1/DNA complex by DB270 at 600 mM Na+, an ionic condition that abolished DB270/PU.1 binding (c.f. Figure 5C) and restored inhibition of the 1:1 PU.1/DNA complex (bottom Panel, square symbols). PU.1/DNA binding in the absence of DB270 is represented by squares. Curves represent fits of the data to the sequential 2:1 model as represented by Scheme 1.
To directly test the notion that sequestration of PU.1 by DB270 is causal to DB270's impaired inhibitory activity, we sought conditions under which DB270/PU.1 binding could be decoupled from PU.1/DNA binding. Since high-affinity PU.1/DNA binding is only weakly sensitive to Na+ concentration (8,27,28), we took advantage of the lack of DB270/PU.1 interactions at 600 mM Na+ (c.f. Figure 5C). Under these conditions, inhibition of the 1:1 PU.1/DNA complex by DB270 was substantively restored (Figure 7B) even though DB270/DNA binding was also attenuated (by ∼10-fold; c.f. Figure 2C). Although DB270 also appeared to drive the 2:1 PU.1/DNA complex, suggesting additional interactions at 600 mM Na+, the data clearly demonstrated a mechanistic connection between drug/protein binding and loss of protein/DNA inhibition.
DB270/PU.1 interactions: nature and implications for pharmacological inhibition of PU.1-dependent transcription in vivo
DB270 bound PU.1 with avidly and discrete stoichiometry, the latter in particular evidenced by the well-resolved electrophoretic separation of DB270-bound PU.1 (c.f. Figure 5E). This interaction is not promiscuous, as DB270 bound bovine serum albumin with negligible affinity (Supplementary Figure S6, Supporting Information). A reasonable picture of DB270/PU.1 interactions is that dications first bound PU.1 at surfaces distal to the basic DNA-binding surface and then, as charge density of the complex accumulated, induced additional binding sites through local unfolding of the protein. In DB270/DNA titrations involving fixed increments of PU.1, this would account for a recovery of DNA capacity for DB270 at high PU.1 concentrations (c.f. Figure 4), as compounds distributed among increasingly available initial sites on PU.1. Alternative possibilities such as formation of ternary or higher-order complexes, which would be favored by increasing concentrations of any of its constituents, would be manifest as increases in DB270 anisotropy above PU.1-free controls, but no such evidence was observed (c.f. Figure 4B). To ensure that the saturating DB270 anisotropy was not an artefact of homotropic resonance transfer among aggregating PU.1-bound DB270, we photobleached the DB270/PU.1 complex and detected no meaningful change in DB270 anisotropy (Supplementary Figure S7, Supporting Information).
How do the FP data in homogenous solution explain those from surface-binding assays, such as biosensor-SPR? In the SPR experiment, immobilized target DNA is exposed to a flow solution containing the protein at a fixed concentration and graded concentrations of the compound of interest (29). Compounds such as DB270 would have ample opportunity to interact with protein before competition with immobilized DNA, and a fraction of the compound would therefore be effectively sequestered by the protein in the flow solution. Since solution is continuously injected, interactions with immobilized DNA do not perturb the characteristics of the flow solution. Induced dissociation of protein bound to immobilized DNA therefore reflects mass action due to the effective concentrations of unbound compound and protein in the flow solution. Thus, the poor inhibition by compounds such as DB270 at concentrations that saturate the shared DNA binding site in the protein's absence can be explained by protein binding.
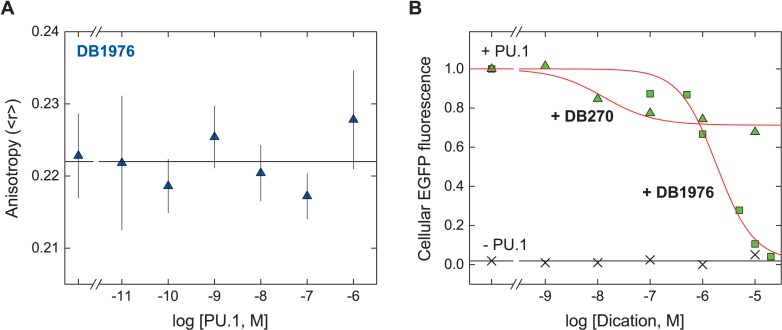
Are the FP observations of defined, purified components relevant in the complex cellular environment? To address this issue, DB1976, the selenophene analog of DB270, offered an insightful opportunity because DB1976 did not detectably bind PU.1 in 150 mM Na+ (Figure 8A), conditions under which DB270 bound PU.1 avidly (c.f. Figure 5A). We probed the biological activity of DB270 using a cell-based PU.1-dependent reporter and found that, in agreement with the SPR results, DB270 poorly inhibited PU.1-dependent gene expression at a λB-based promoter (Figure 8B). On the other hand, DB1976, which competitively inhibited PU.1 by SPR, fully inhibited PU.1 in vivo. Thus, the functional inhibitory efficacies of DB270 and DB1976 closely mirrored their inhibitory efficacies on DNA binding in vitro (c.f. Figure 1B). Since both dications share the same strong AT selectivity (a feature reinforced in dications of the diaminidinium type, 30), stoichiometry, and affinities for AT-rich DNA sites (5,17), the markedly poorer efficacy seen with DB270 is not consistent with differential depletion by off-target genomic DNA. Previous structure-function studies have also shown that cell distribution of symmetric dications was primarily determined by features at the termini (31). Both DB270 (12) and DB1976 (5) have been experimentally shown to enter cells, and bearing the identical termini (c.f. Figure 1A), are expected to penetrate cell nuclei similarly. In conclusion, although one cannot exhaustively exclude all possibilities, the data support a sequestrative effect in a complex cellular milieu consisting of PU.1 (and other physicochemically similar, non-DNA components) as the most consistent mechanism underlying pharmacologic efficacy in vivo.
Figure 8.
The lack of PU.1 binding by DB1976 under physiological conditions is correlated with PU.1 inhibitory efficacy in vivo. (A) Representative direct titration of 10 nM of DB1976 with PU.1 ETS domain at 150 mM Na+, an ionic condition under which DB270 avidly binds protein (c.f. Figure 5A). (B) Dose-dependent inhibition of PU.1 by DB1976 (triangles) and DB1076 (squares) in cultured HEK293 cells. PU.1-dependent transactivation at an engineered λB-based promoter was reported by the expression of enhanced GFP, and quantitatively measured by flow cytometry. No detectable EGFP fluorescence was observed in the absence of induced ectopic expression of PU.1 (×).
Single-atom replacement of oxygen with selenium (both chalcogens) is generally considered a conservative bioisosteric substitution in drug design (32). Indeed, quantitative comparison of physicochemical properties revealed only minor differences in the calculated partition coefficient, solubility, polarizability, volume and surface area between DB270 and DB1976 (Supplementary Table S1, Supplemental Information). The sharp contrast between the two analogs is therefore unexpected. If anything, the selenophene DB1976, which is more lipophilic and polarizable than its furan counterpart DB270, would be expected to be more promiscuous, yet the data show the former as better behaved. While off-target binding to proteins is widespread among drugs in general (33), and may even be high-affinity (34), the case of DB270 is unusual in that it binds unproductively to the same protein that it is aimed at inhibiting and illustrates an opportunity for off-target binding that is uniquely relevant to interfacial inhibitors.
Supplementary Material
Acknowledgments
We thank Ms Suela Xhani for PU.1 ETS purification and Dr W. David Wilson for insightful discussions.
Footnotes
Present address: Abdelbasset A. Farahat, Department of Pharmaceutical Organic Chemistry, Faculty of Pharmacy, Mansoura University, Mansoura 35516, Egypt.
SUPPLEMENTARY DATA
Supplementary Data are available at NAR Online.
FUNDING
NSF [MCB 15451600]; NIH [R21 HL129063 to G.M.K.P.]. Funding for open access charge: NSF [MCB 15451600]; NIH [R21 HL129063 to G.M.K.P.].
Conflict of interest statement. None declared.
REFERENCES
- 1.Wells J.A., McClendon C.L. Reaching for high-hanging fruit in drug discovery at protein-protein interfaces. Nature. 2007;450:1001–1009. doi: 10.1038/nature06526. [DOI] [PubMed] [Google Scholar]
- 2.White S., Szewczyk J.W., Turner J.M., Baird E.E., Dervan P.B. Recognition of the four Watson-Crick base pairs in the DNA minor groove by synthetic ligands. Nature. 1998;391:468–471. doi: 10.1038/35106. [DOI] [PubMed] [Google Scholar]
- 3.Chai Y., Paul A., Rettig M., Wilson W.D., Boykin D.W. Design and synthesis of heterocyclic cations for specific DNA recognition: from AT-rich to mixed-base-pair DNA sequences. J. Org. Chem. 2014;79:852–866. doi: 10.1021/jo402599s. [DOI] [PMC free article] [PubMed] [Google Scholar]
- 4.Paine M.F., Wang M.Z., Generaux C.N., Boykin D.W., Wilson W.D., De Koning H.P., Olson C.A., Pohlig G., Burri C., Brun R., et al. Diamidines for human African trypanosomiasis. Curr. Opin. Investig. Drugs. 11:876–883. [PubMed] [Google Scholar]
- 5.Munde M., Wang S., Kumar A., Stephens C.E., Farahat A.A., Boykin D.W., Wilson W.D., Poon G.M. Structure-dependent inhibition of the ETS-family transcription factor PU.1 by novel heterocyclic diamidines. Nucleic Acids Res. 2014;42:1379–1390. doi: 10.1093/nar/gkt955. [DOI] [PMC free article] [PubMed] [Google Scholar]
- 6.Weber G. Polarization of the fluorescence of macromolecules. I. Theory and experimental method. Biochem. J. 1952;51:145–155. doi: 10.1042/bj0510145. [DOI] [PMC free article] [PubMed] [Google Scholar]
- 7.He G., Tolic A., Bashkin J.K., Poon G.M. Heterogeneous dynamics in DNA site discrimination by the structurally homologous DNA-binding domains of ETS-family transcription factors. Nucleic Acids Res. 2015;43:4322–4331. doi: 10.1093/nar/gkv267. [DOI] [PMC free article] [PubMed] [Google Scholar]
- 8.Wang S., Linde M.H., Munde M., Carvalho V.D., Wilson W.D., Poon G.M. Mechanistic heterogeneity in site recognition by the structurally homologous DNA-binding domains of the ETS family transcription factors Ets-1 and PU.1. J. Biol. Chem. 2014;289:21605–21616. doi: 10.1074/jbc.M114.575340. [DOI] [PMC free article] [PubMed] [Google Scholar]
- 9.Poon G.M.K. Sequence discrimination by DNA-binding domain of ETS family transcription factor PU.1 is linked to specific hydration of protein-DNA interface. J. Biol. Chem. 2012;287:18297–18307. doi: 10.1074/jbc.M112.342345. [DOI] [PMC free article] [PubMed] [Google Scholar]
- 10.Poon G.M.K. DNA binding regulates the self-association of the ETS domain of PU.1 in a sequence-dependent manner. Biochemistry. 2012;51:4096–4107. doi: 10.1021/bi300331v. [DOI] [PubMed] [Google Scholar]
- 11.Tataurov A.V., You Y., Owczarzy R. Predicting ultraviolet spectrum of single stranded and double stranded deoxyribonucleic acids. Biophys. Chem. 2008;133:66–70. doi: 10.1016/j.bpc.2007.12.004. [DOI] [PubMed] [Google Scholar]
- 12.Hopkins K.T., Wilson W.D., Bender B.C., McCurdy D.R., Hall J.E., Tidwell R.R., Kumar A., Bajic M., Boykin D.W. Extended aromatic furan amidino derivatives as anti-Pneumocystis carinii agents. J. Med. Chem. 1998;41:3872–3878. doi: 10.1021/jm980230c. [DOI] [PubMed] [Google Scholar]
- 13.Poon G.M.K. Quantitative analysis of affinity enhancement by noncovalently oligomeric ligands. Anal. Biochem. 2013;433:19–27. doi: 10.1016/j.ab.2012.10.005. [DOI] [PubMed] [Google Scholar]
- 14.Wells J.W. Analysis and interpretation of binding at equilibrium. In: Hulme EC, editor. Receptor-Ligand Interactions: a Practical Approach. Oxford: IRL Press at Oxford University Press; 1992. pp. 289–395. [Google Scholar]
- 15.Filonov G.S., Piatkevich K.D., Ting L.M., Zhang J., Kim K., Verkhusha V.V. Bright and stable near-infrared fluorescent protein for in vivo imaging. Nat. Biotechnol. 2011;29:757–761. doi: 10.1038/nbt.1918. [DOI] [PMC free article] [PubMed] [Google Scholar]
- 16.Kim J.H., Lee S.-R., Li L.-H., Park H.-J., Park J.-H., Lee K.Y., Kim M.-K., Shin B.A., Choi S.-Y. High cleavage efficiency of a 2A peptide derived from porcine teschovirus-1 in human cell lines, zebrafish and mice. PLoS One. 2011;6:e18556. doi: 10.1371/journal.pone.0018556. [DOI] [PMC free article] [PubMed] [Google Scholar]
- 17.Wang L., Bailly C., Kumar A., Ding D., Bajic M., Boykin D.W., Wilson W.D. Specific molecular recognition of mixed nucleic acid sequences: an aromatic dication that binds in the DNA minor groove as a dimer. Proc. Natl. Acad. Sci. U.S.A. 2000;97:12–16. doi: 10.1073/pnas.97.1.12. [DOI] [PMC free article] [PubMed] [Google Scholar]
- 18.Burkhoff A.M., Tullius T.D. The unusual conformation adopted by the adenine tracts in kinetoplast DNA. Cell. 1987;48:935–943. doi: 10.1016/0092-8674(87)90702-1. [DOI] [PubMed] [Google Scholar]
- 19.Mathis A.M., Holman J.L., Sturk L.M., Ismail M.A., Boykin D.W., Tidwell R.R., Hall J.E. Accumulation and intracellular distribution of antitrypanosomal diamidine compounds DB75 and DB820 in African trypanosomes. Antimicrob. Agents Ch. 2006;50:2185–2191. doi: 10.1128/AAC.00192-06. [DOI] [PMC free article] [PubMed] [Google Scholar]
- 20.Eisenbeis C.F., Singh H., Storb U. PU.1 is a component of a multiprotein complex which binds an essential site in the murine immunoglobulin lambda 2-4 enhancer. Mol. Cell. Biol. 1993;13:6452–6461. doi: 10.1128/mcb.13.10.6452. [DOI] [PMC free article] [PubMed] [Google Scholar]
- 21.Pham T.H., Minderjahn J., Schmidl C., Hoffmeister H., Schmidhofer S., Chen W., Langst G., Benner C., Rehli M. Mechanisms of in vivo binding site selection of the hematopoietic master transcription factor PU.1. Nucleic Acids Res. 2013;41:6391–6402. doi: 10.1093/nar/gkt355. [DOI] [PMC free article] [PubMed] [Google Scholar]
- 22.Wei G.H., Badis G., Berger M.F., Kivioja T., Palin K., Enge M., Bonke M., Jolma A., Varjosalo M., Gehrke A.R., et al. Genome-wide analysis of ETS-family DNA-binding in vitro and in vivo. EMBO J. 2010;29:2147–2160. doi: 10.1038/emboj.2010.106. [DOI] [PMC free article] [PubMed] [Google Scholar]
- 23.Poon G.M., Macgregor R.B., Jr Base coupling in sequence-specific site recognition by the ETS domain of murine PU.1. J. Mol. Biol. 2003;328:805–819. doi: 10.1016/s0022-2836(03)00362-0. [DOI] [PubMed] [Google Scholar]
- 24.Graves B.J., Gillespie M.E., McIntosh L.P. DNA binding by the ETS domain. Nature. 1996;384:322. doi: 10.1038/384322a0. [DOI] [PubMed] [Google Scholar]
- 25.Record M.T., Jr, Lohman M.L., De Haseth P. Ion effects on ligand-nucleic acid interactions. J. Mol. Biol. 1976;107:145–158. doi: 10.1016/s0022-2836(76)80023-x. [DOI] [PubMed] [Google Scholar]
- 26.Kodandapani R., Pio F., Ni C.Z., Piccialli G., Klemsz M., McKercher S., Maki R.A., Ely K.R. A new pattern for helix-turn-helix recognition revealed by the PU.1 ETS-domain-DNA complex. Nature. 1996;380:456–460. doi: 10.1038/380456a0. [DOI] [PubMed] [Google Scholar]
- 27.Munde M., Poon G.M.K., Wilson W.D. Probing the electrostatics and pharmacological modulation of sequence-specific binding by the DNA-binding domain of the ETS family transcription factor PU.1: a binding affinity and kinetics investigation. J. Mol. Biol. 2013;425:1655–1669. doi: 10.1016/j.jmb.2013.02.010. [DOI] [PMC free article] [PubMed] [Google Scholar]
- 28.Poon G.M., Macgregor R.B., Jr A thermodynamic basis of DNA sequence selectivity by the ETS domain of murine PU.1. J. Mol. Biol. 2004;335:113–127. doi: 10.1016/j.jmb.2003.09.046. [DOI] [PubMed] [Google Scholar]
- 29.Wang S., Poon G.K., Wilson W.D. Quantitative Investigation of Protein–Nucleic Acid Interactions by Biosensor Surface Plasmon Resonance. In: Leblanc BP, Rodrigue S, editors. DNA-Protein Interactions. Vol. 1334. NY: Springer; 2015. pp. 313–332. [DOI] [PMC free article] [PubMed] [Google Scholar]
- 30.Reddy B.S., Sharma S.K., Lown J.W. Recent developments in sequence selective minor groove DNA effectors. Curr. Med. Chem. 2001;8:475–508. doi: 10.2174/0929867003373292. [DOI] [PubMed] [Google Scholar]
- 31.Lansiaux A., Tanious F., Mishal Z., Dassonneville L., Kumar A., Stephens C.E., Hu Q., Wilson W.D., Boykin D.W., Bailly C. Distribution of furamidine analogues in tumor cells: targeting of the nucleus or mitochondria depending on the amidine substitution. Cancer Res. 2002;62:7219–7229. [PubMed] [Google Scholar]
- 32.Patani G.A., LaVoie E.J. Bioisosterism: a rational approach in drug design. Chem. Rev. 1996;96:3147–3176. doi: 10.1021/cr950066q. [DOI] [PubMed] [Google Scholar]
- 33.Xie L., Xie L., Bourne P.E. Structure-based systems biology for analyzing off-target binding. Curr. Opin. Struct. Biol. 2011;21:189–199. doi: 10.1016/j.sbi.2011.01.004. [DOI] [PMC free article] [PubMed] [Google Scholar]
- 34.Glauner H., Ruttekolk I.R., Hansen K., Steemers B., Chung Y.-D., Becker F., Hannus S., Brock R. Simultaneous detection of intracellular target and off-target binding of small molecule cancer drugs at nanomolar concentrations. Br. J. Pharmacol. 2010;160:958–970. doi: 10.1111/j.1476-5381.2010.00732.x. [DOI] [PMC free article] [PubMed] [Google Scholar]
Associated Data
This section collects any data citations, data availability statements, or supplementary materials included in this article.


