


Abstract
Pluripotent self-renewing embryonic stem cells (ESCs) have been the focus of a growing number of high-throughput experiments, revealing the genome-wide locations of hundreds of transcription factors and histone modifications. While most of these datasets were used in a specific context, all datasets combined offer a comprehensive view of chromatin characteristics and regulatory elements that govern cell states. Here, using hundreds of datasets in ESCs, we generated colocalization maps of chromatin proteins and modifications, and built a discovery pipeline for regulatory proteins of gene families. By comparing genome-wide binding data with over-expression and knockdown analysis of hundreds of genes, we discovered that the pluripotency-related factor NR5A2 separates mitochondrial from cytosolic ribosomal genes, regulating their expression. We further show that genes with a common chromatin profile are enriched for distinct Gene Ontology (GO) categories. Our approach can be generalized to reveal common regulators of any gene group; discover novel gene families, and identify common genomic elements based on shared chromatin features.
INTRODUCTION
Advances in sequencing technologies and the continuous decline in sequencing costs, led, in recent years, to the rapid accumulation of high-throughput genomic data. These include, but not limited to, DNA methylation profiles, generated by bisulfite-sequencing; DNaseI-hypersensitivity (DHS), produced by DNaseI digestion and sequencing; nucleosome positioning mapping, generated by MNase digestion and sequencing; chromatin immunoprecipitation (ChIP) followed by sequencing (ChIP-seq) or by tiling array hybridization (ChIP-chip); expression profiles, generated using microarrays or RNA-sequencing (RNA-seq) technologies; ribosome profiling and sequencing, and 3D conformation of the genome, produced using 4C/Hi-C methods (1). Several initiatives, spearheaded by the ENCODE project (2), the NIH Roadmap Epigenomics Mapping Consortium (3) and BLUEPRINT Project (4), integrate large amounts of data and enable an ever easy access to a curated genomic data, either directly or by using some downstream applications (5,6). Other analyses platforms also integrate data from isolated publications (7–9), allowing a growing exposure to functional genomic experiments, which constitute the majority of the available datasets. These works and others, enable to perform a wide array of local and global analyses, yet these approaches are still somewhat limited in functionality. Additionally, even when analyzed on a global level, large-scale genomic data has not been integrated with systematic perturbation of gene expression data in order to attempt to link binding to function.
Due to their unique characteristics and clinical potential, embryonic stem cells (ESCs) have been the focus of numerous high-throughput studies in recent years. Consequently, a notable effort has been made in order to characterize ESCs at the chromatin and epigenetic level (10–13). Owing to this, ESCs possess a very broad repertoire of genome-wide datasets compared with any other cell type or tissue. Previously, we collected over 50 such genome-wide datasets in mouse ESCs, and using a bioinformatic pipeline which we developed, we were able to identify novel regulators of the histone gene family (14).
We now significantly expanded our database (‘BindDB’, http://bind-db.huji.ac.il) and collected over 450 genome-wide datasets in mouse and human ESCs, providing one of the most comprehensive ESCs-specific databases to date (15). Using simple strategies and unsupervised hierarchical clustering, we were able to generate broad cluster analyses of chromatin features in ESCs and describe both known and novel gene families with shared epigenetic landscape and chromatin-bound factors. We were further able to derive interaction nodes systematically, enabling us to identify core components of gene networks operating in ESCs. Using our BindDB, and by incorporating systematic gene perturbation (knockout / knockdown / over-expression) datasets (16–39) into our pipeline, we further show that we can discover potential regulators of any given gene family and systematically validate the functional significance of these enriched factors by testing the outcome of their perturbations. We demonstrate the power of this approach by applying our pipeline to ribosomal genes. We identify a novel potential regulator of ribosomal gene expression in ESCs, NR5A2, which separated ‘mitochondrial’ ribosomal genes (genes encoding ribosomal proteins which are targeted to the mitochondria) from ‘cytoplasmic’ ribosomal genes, and of which its over-expression shifted gene expression of the ‘mitochondrial’ and ‘cytoplasmic’ ribosomal genes in opposite directions. Our study thus provides a systematic discovery pipeline for novel regulators of gene families in ESCs.
MATERIALS AND METHODS
Data acquisition
Data has been downloaded from http://bind-db.huji.ac.il (15). Reads were aligned using Bowtie (40), taking only uniquely aligned reads with no more than two mismatches. peaks were then called using MACS 1.4 (41).
Microarray analysis
Processed data have been acquired from the specified resources (Supplementary Table S2). Unprocessed data have been normalized by RMA and the differentially expressed genes were picked using the described parameters.
Analysis
In order to minimize the effect of various peak sizes on the statistical analysis, we used a resolution that enable the representation and normalization of datasets with different nature (e.g. both TFs and histone modifications ChIP-Seqs). Mouse (MM9) and human (HG19) genomes have been partitioned into non-intersecting bins of 1.5 kb long, choosing a similar scale as previously published works (42–44). When addressing genes, all intersecting bins within 5 kb upstream to the TSS throughout the gene body were considered. When addressing promoter regions, bins intersecting the 2 kb region, centered in the TSS, were selected. Let N be the set of all genes and X be the set of genes that are being bound by factor X, the enrichment score of factor X within gene group Y was calculated as fallow:
 |
For the binding enrichment score, FDR corrected empirical P-value was calculated based on 100 000 randomizations of gene groups with the same size as the queried one. Unless specifically mentioned otherwise, all presented factors are significantly enriched or depleted in at least one gene group (Q-value ≤ 0.05). GO annotations have been acquired using HOMER (45). Gene groups were extracted using a dendogram cutoff height value of 1.15. A group of genes that was large enough (≥ 20) was considered as functionally annotated group if it had at least one significant (Q-value ≤ 0.05) GO term, not including chromosomal position annotations. Hierarchical clustering of genes in a heatmap was performed using Hamming distance and an average linkage. When building connectivity graphs, binding events were considered only when at least half of the datasets of the queried protein had a peak in the promoter region of a gene.
RESULTS
Data curation and validation
Our analysis is mostly based on data we collected over the years and which has been assembled in to the ‘BindDB’ database (http://bind-db.huji.ac.il) (15). To test the integrity of the data, we focused on genomic maps of histone modifications and compared the patterns in human and mouse. Principal component analysis (PCA) demonstrated that the patterns in human and mouse are highly similar in both the relative orientation of the histone modifications and the variance within each individual modification (Supplementary Figure S1). Applying this approach, we were able to extract and remove datasets that clustered away from their group and were therefore considered as outliers (Supplementary Figure S1).
As previously shown (15) we were able to use these data to characterize the similarity levels between the binding patterns of the different proteins in our database. Using unsupervised clustering, we obtained several defined clusters (Figure 1; Supplementary Table S1). Cluster I, which mainly consists of H3K27me3 and Polycomb group (PcG) components shows a strong positive correlation with several datasets in clusters XVI (KDMs) and XVII (H3K4me3) and a distinct negative correlation with cluster VI (active transcription); Cluster II contains the majority of the available MBD proteins, 5hmC and 5fC; III contains some pluripotency factors, e.g. NANOG, POU5f1 (Oct4), ESRRB, KLF4 and SOX2, as well as other proteins including UTX, MBD3, HDAC1, SMAD3, ELL3 and mediator components MED1 and MED12; Cluster IV includes SALL4b, SALL2, DAX1, NAC1 and ZFP281; V consists of CNOT, REST, SETDB1, GATA4, TIP60, REX1, DMAP1, JARID1a, MACAF, ZNF143, ZNF348, ZFP322a, SMAD2 and CBX3, in addition to H2A.X and H3K14ac; Cluster VI, containing H3K36me3 and RNA-seq tracks, is associated with active transcription; VII is characterized by datasets with low correlation levels to other datasets including TP53 (VIIa, Supplementary Table S1), H1 and mononucleosomes (VIIb), CLIP-seq data (VIIc) and a sub-cluster of heterochromatin including H3K9me3 and H4K20me3 (VIId) as well as HP1β, ATRX, CTR9 and more; Cluster VIII includes CTCF, SA1, SA2, SMC3, RAD21 and ZC3H11a. These datasets are found to be correlated with part of clusters IX–XII, that contain promoter and enhancer associated factors as previously reported (19,27); Cluster IX consists of components of Condensin-II and cohesion complexes, as well as enhancer related factors (e.g. P300, H3K27ac); Cluster X consists of MYC, MAX and other transcription factors (TFs) and chromatin remodelers; Cluster XI and cluster XII include RNA polymerase II, H3K4me2, H3K4me3 and other promoter associated factors, but cluster XI also includes datasets of the KDM proteins.
Figure 1.

Correlation heatmap of 214 datasets in mouse enable subclassification of chromatin into several different groups. Clusters are color coded and their numbers are depicted on the right-hand side bar. Pearson correlation levels run from low (dark blue) to high (red) as shown in the left-hand color bar.
Using VISTA Enhancer Browser (46) to extract enhancer regions, we noticed, as expected, a high correlation to cluster IX in our analysis, and in particular, to the datasets of P300, H3K56ac, H3K4me1 and H3K27ac. The ‘Enhancers’ track was also found to be highly correlated with GATA4 (cluster V), which reassuringly, was also found to be highly correlated to these regions and is known to bind enhancer regions (47,48), although this was not specifically shown in ESCs. As previously suggested (15), these results expand the epigenetic enhancer signature and suggest that H3K56ac acts as a new enhancer mark in ESCs.
Chromatin context predicts function
We next tested whether we could use the chromatin signature our databases provides us with, to classify functional groups of genes according to their chromatin signature alone. To this end, we performed hierarchical clustering of all known genes with the chromatin-signature database that we have established (Figure 2A). Using this method, we were able to identify known gene families, which share a common epigenetic signature. Among these families are the group of Bivalent genes, characterized by the presence of the conflicting histone modifications H3K4me3 and H3K27me3 accompanied by polycomb group (PcG) proteins (49); Olfactory receptors enriched group, characterized by a lack of any distinct chromatin signature; Hox genes cluster, enriched with genes from the HoxA, HoxB and HoxC families; and a group of most of the canonical histone genes. In addition, we found that 84 out of the 211 formed groups are significantly associated with several GO terms (Figure 2B, Supplementary Tables S3 and S4), demonstrating that chromatin signature alone provides a means to classify gene families into functional groups. Thus, this approach allowed us not only to identify existing gene families with shared epigenetic landscape but also to identify potentially new ones (Supplementary Table S5).
Figure 2.

Clustering of mouse genes according to their chromatin profile. (A) Hierarchical clustering of all genes (Refseq) according to their chromatin features enable to characterize groups of genes. Genes encoding for olfactory receptors are in the top cluster. (B) GO analysis of the acquired groups demonstrates significant enrichment of GO terms in 84 out of 211 gene clusters.
Transcriptional regulators of histone genes
Next, we turned to analyze specific gene families. To ensure that we can recapitulate previous analyses (14), we first focused on the group of histone genes. Reassuringly, we found enrichment of previously reported associated factors, including SMAD1, SMAD2, P300, MED1, MED12, E2F1 and E2F4 (14), but since we are now using a considerably larger database, significance values differed slightly, and we also identified several novel associated factors, i.e. TP53, GCN5, AFF4 and CAPH2 (Supplementary Figure S2A). We were also able to dissect the data and show that ZFX is enriched in H1 linker histone genes as opposed to core histone genes (14), as well as REST and KAT5 (Supplementary Figure S2B); and that canonical replication-dependent histone genes are depleted for H3K36me3 (50) as opposed to histone variants, which are replication independent and are enriched for this modification, as expected (Supplementary Figure S2C).
Examining the binding events in the promoter region of all histone genes, we find that replication independent histone gene variants are clustered apart from canonical histone genes (Supplementary Figure S2D). The histone variants are clustered in three separate groups. The first (cyan), contains H1fx, which is known to be mostly expressed during early embryonic development (51), H2afy2, Hist1h2ba and Hit1h2aa. The latter two are replication dependent, and sperm-specific. Even though, unlike the second group, this group has a higher factor binding frequency, which in turn might suggest that tissue specific genes are actually active in ESCs, they also contain the repressive polycomb associated H3K27me3 histone modification. The second group (green) contains H1fnt and H1foo, which are testis-specific and oocyte-specific (52), and are not expressed in ESCs. This group presents a very sparse binding pattern. H2afy3, H2afb1 and H2bfm are clustered inside that group and also have only a few factors binding at their promoters. These genes also show a germ-cell specific expression (53). The third group (pink) contains all the rest of the histone variants, and presents a rich binding repertoire, including expression associated factors such as RNAPII.
Epigenetic signature can separate ribosomal genes into functional groups
To further emphasize the insights that can be inferred from our comprehensive approach, we next turned to analyze a well-known gene family, the ribosomal genes, which is believed to have tightly controlled expression regulation, but which has not been studied in great detail at the transcriptional level. Inspecting the factors that are enriched or depleted in these genes, we found evidence for both significant enrichment and significant depletion for dozens of factors (Figure 3A and B), of which the histone acetyltransferase GCN5 was the most highly enriched, and polycomb group (PcG) components were the most significantly depleted, as might be expected from a highly active group of genes, that contains many known housekeeping genes (54).
Figure 3.

Chromatin features separate mitochondrial from cytoplasmic ribosomal genes. (A and B) Enrichment analysis of multiple histone modifications (A) and proteins (B) in mitochondrial and cytoplasmic ribosomal genes. (C and D) Principal component analysis (PCA) separates between mitochondrial and cytoplasmic ribosomal genes (C), but not between the Large and Small ribosomal subunits (D). (E) Hierarchical clustering of chromatin features of all ribosomal genes. Mitochondrial ribosomal genes (Mito) are labeled green; cytoplasmic ribosomal genes (Cyto) are labeled blue.
Genes encoding ribosomal components can be classified into genes encoding components of cytosolic ribosomes and genes encoding for mitochondrial ribosome components. Both of these subgroups show an overall active histone modification pattern but analyzing their chromatin context, we found that they differ by the presence of H3K14ac, which is enriched in cytoplasmic ribosomal genes but depleted in mitochondrial ribosomal genes (Figure 3A) (55).
Analyzing the TF binding patterns of the two cytoplasmic and mitochondrial subgroups separately, we observed a distinct difference at the enrichment levels of the groups. Several proteins, such as AFF4, CTR9, CBX3, UTX, KLF4, SMAD2, ELL2, TP53S18, NR5A2, KAT5, SETDB are significantly enriched in cytoplasmic ribosomal genes, while MECP2, MBD1a, MAFK, coREST and TCF3 are significantly depleted in the cytoplasmic ribosomal group, but not in the mitochondrial group (Figure 3B).
These differential binding patterns enable to classify ribosomal genes to either cytosolic or mitochondrial solely based on their chromatin signature (Figure 3C, P < 10−5, Permutation test). Significantly, these functional groups could not be separated based on their transcriptional level. Interestingly, we could not further partition the set of ribosomal genes into groups of genes encoding for the small or large ribosomal subunits, based on their chromatin signature (Figure 3D), suggesting that they are not differentially regulated, as would be expected from components of the same cellular functional structure.
Incorporating systematic gene perturbation datasets
So far, our analysis provided a comprehensive, yet descriptive, chromatin context of genes and gene families. Next, in order to investigate potential functional relevance of our bioinformatic analysis, we additionally collected 290 different knockdown/knockout/over-expression (KD/KO/OE) experiments (Supplementary Table S2), all of which were followed by expression analyses in mouse ESCs. These experiments allow testing the outcome of altering the expression of the identified bound transcription factors, and enable us to classify transcription factors that not only bind, but also modulate the expression (either directly or indirectly) of a certain gene group. Thus, combining all datasets, we could now not only identify factors that bind any particular gene or gene group, but which also regulate the expression of these bound genes. Testing this on the ribosomal bound factors, we found that out of 290 assays, 91 of the factors which altered expression had an effect on some of the ribosomal genes (Figure 4A). Five of these (TCL1 KD, CDC5l KD, OGT KD, MSC OE, NR5A2 OE), resulted in a statistically significant effect in at least one of the ribosomal subgroups (Figure 4B). Although the binding maps for three out of the five factors are not available in ESCs, maps for OGT and NR5A2 are available, and the results for NR5A2 are consistent with its binding patterns, which is significantly depleted inside mitochondrial ribosomal genes and significantly enriched in cytosolic ribosomal genes (Figure 3). Taken together, these results identify the factors that bind ribosomal gene promoters, demonstrate that the chromatin environment completely separates cytosolic from mitochondrial ribosomal genes, and uncover at least one novel regulator, NR5A2, of ribosomal gene expression in mouse ESCs.
Figure 4.
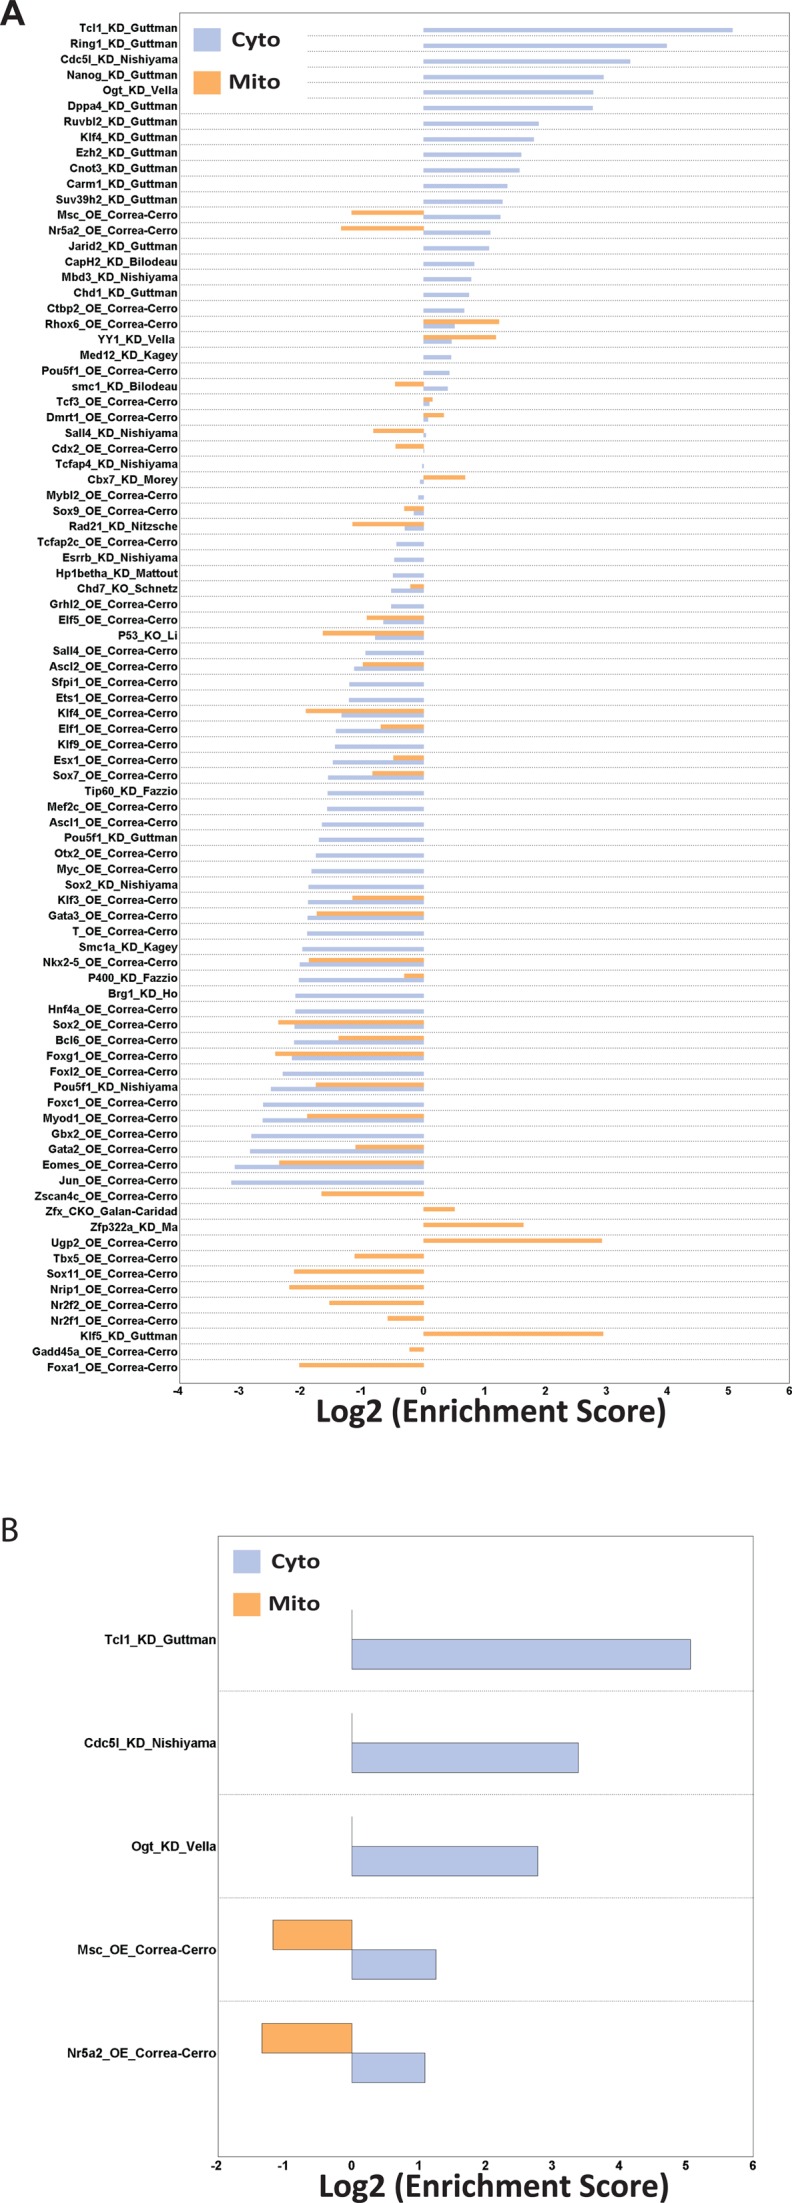
Expression modulation enrichment analysis. (A) 91 KO/KD/OE experiments resulted in expression changes of ribosomal genes. (B) Out of the factors identified to induce transcriptional changes of ribosomal genes, changes induced by knockdown of TCL1, CDC5l or OGT and changes induced by over-expression of MSC or NR5A2 were statistically significant.
Finally, we made use of our comprehensive database to inspect network connectivity. Examining the general properties of our network, we saw that the number of genes that a particular factor potentially regulates (#out-degree) is not corrolated with the number of factors that bind to that factor's gene location (#in-degree). We also noticed that the variation in the number of in-degrees (STD = 26.4), is much higher than the variation in the number of out-degrees (STD = 12.9). We continued by testing several methyl CpG binding proteins including MBD1, MBD2, MBD3, MBD4 and MECP2. Interestingly, MBD3, which was previously reported to play a role in reprograming and pluripotency, although with somewhat conflicting conclusions (56,57), seems to have a distinct connectivity pattern (Figure 5). MBD3 promoter is directly bound by the major pluripotency factors including POU5F1 (Oct4), NANOG, SOX2, KLF4 and ESRRB. This feature is true for merely 66 gene promoters (out of 25 314, P < 10−100, z-test) and is unique to MBD3 among all other MBD proteins (Supplementary Table S6). Additionally, it is the only MBD protein that displays a regulatory network that is smaller than the extent of its own network regulation, as revealed by the network parameters (i.e. in-degree > out-degree) (Figure 5). This might suggest a more restricted manner of regulation by MBD3 on this circuitry. MBD2, which has also been associated with pluripotency (58), is the second in line after MBD3 in terms of the number of pluripotency factors that are bound to it and potentially regulate it. The three remaining MBDs: MBD1, MBD4 and MECP2, are bound by a lower number of pluripotency factors. Based on these observations, we propose that our platform can serve as an easy and almost trivial pipeline to extract members of a certain functional circuitry.
Figure 5.

Regulatory circuitry of several pluripotent factors, MBD proteins and Polycomb components. Each node represents a gene. Each edge represents a binding event of a protein (source node) to a promoter region of some other gene (the destination node). All the genes in the network that bind Mbd3 are colored in red.
DISCUSSION
We assembled a comprehensive epigenetic database of mouse and human ESCs and generated discovery pipelines for epigenetic signatures, feature identification, gene families, novel transcriptional regulators and network connectivity. Our observation that the genomic distribution of the data is very similar in both mouse and human, essentially recapitulating a similar picture using different assays and platforms, demonstrates the robustness of our approach. Additionally, we've shown the importance of using comparative methodologies in order to determine that a dataset is correlated to other biological repeats and to exclude datasets with some irregularities. These, or similar such approaches should, and probably will, become a golden standard in ChIP-seq quality control validations.
One unbiased way to analyze such a large database is using correlation heatmaps of all datasets combined. Using this approach we were able to easily trace many known biological mechanisms, and often provide testable predictions for factors that may act in a certain pathway. For example, condensin-II components were clustered alongside with many promoter related factors (19); the polycomb cluster displayed a very low correlation with the active expression cluster (H3K36me3 and RNA-seq tracks) but a high correlation with several promoter associated factors such as H3K4me3, consistent with the presence of bivalent marks (H3K4me3/H3K27me3) in ESCs (49); TP53 signal is highly correlated with ZNF143, which is known to be involved in DNA-damage repair (59), and SMAD2 and CBX3 (Cluster V) are highly correlated with the high-expression associated cluster (VI), consistent with reports that CBX3 binds to highly expressed gene regions in ESCs (60) and with studies in human keratinocytes, showing that SMAD2 binds at genes that are induced by the TGFβ signaling pathway (61).
Yet, due to the non-homogeneous nature of the different datasets, originating from diverse ChIP protocols, variable sequencing coverage and the variety of algorithms used to detect enriched regions, some of the duplicates have been clustered apart from one another (e.g. cluster IV which includes some identical features as cluster III, but which is generally characterized by tracks with a lower number of significantly enriched regions). This observation demonstrates the difficulties of analyzing data based on a low number of biological repeats, and stresses the need to further integrate more duplicate experiments and to develop additional computational strategies. Furthermore, some of the analyzed datasets that we have examined had no other available biological repeat and we could not estimate the amount of noise and reproducibility of the data. Whereas some strategies try to partially deal with this obstacle by homogeneously processing the different datasets, we note that, in many cases, this might overlook some of the experimental individual conditions or omit an important fine-tuning effort made by the experiment conductors. Each of these complementary analysis pipelines bare its own pros and cons. Yet, due to this effect, the conclusions made based on these datasets might be partial, and more data should be obtained before reliably sound conclusions can be drawn. Regardless, this is one of the most comprehensive analysis yet attempted in assembled ESC datasets.
In many recent studies, researchers have tried to characterize unique families of genomic regions such as enhancers (46,62,63), functional non-coding regions (18,64,65), different types of topological domains (66) and others. Our methodology is perfectly suitable to assist in characterizing such regions and distinguish between different classes. For example, the classification of H3K56ac in the enhancer associated cluster, alongside with the high correlation of this track to the VISTA enhancers locations, strongly suggests that acetylation of H3K56 plays a significant role in enhancer function either generally or specifically in ESCs, and provides a novel criterion for enhancer discovery. Moreover, the presence of several factors in the enhancer cluster that show a low correlation with the VISTA enhancers may originate from the existence of several different sub-classes of enhancers. Studies in cardiomyocytes, for example, have shown that GATA4 binds tissue specific enhancers (67). This may explain the association of GATA4 with the VISTA database, but not its presence in the enhancer associated cluster, and may stem from a the fact that our analysis was restricted only to ESCs while the enhancers extracted from the VISTA browser were not. Similarly, the clustering of HDAC2 within the enhancer cluster, while not showing a high correlation to the VISTA enhancers set, might originate from the association of the NuRD complex with enhancers in ESCs (68).
Additional novel insights can be extracted using our approach. For example, the genome-wide binding map of the ZC3H11a protein, which is poorly characterized with an unclear function, is highly correlated with components of the Cohesin complex. This observation suggests that ZC3H11a either plays a role in expression regulation through its interactions with promoters/enhancers, or that ZC3H11a directly interacts with some members of the Cohesin complex. Such hypotheses, which can be easily extracted using our biocomputational pipeline, can then be tested in follow-up studies.
Analyzing the set of Histone genes, a well-defined gene family, we were able to validate our previous report (14), but since we used here a considerably larger database we were able to discover additional potential regulators and refine the epigenetic signature of histone gene promoters. Our analysis further showed that when classifying all histone genes according to their chromatin features in an unsupervised manner, most canonical histones form a distinct group (group #172 in mouse; group #100 in human, Supplementary Table S5). Analyzing the epigenetic signature also enabled us to distinguish between canonical histones and histone variants, between active histones and tissue specific inactive histone genes, and finally, to reveal novel, previously uncharacterized, potential tissue-specific histone gene regulators in ESCs.
Since the histone gene family was previously analyzed (14), we wished to further test our discovery platform more rigorously on another gene family. We focused on ribosomal genes as a specific gene family case study since very little is known on its transcriptional regulation or epigenetic state, and since its protein products reside outside our convenient zone, the nucleus. Using our computational approach we were able to label many factors as novel potential regulators of ribosomal genes, awaiting further validation. Additionally, and somewhat unexpectedly, we were able to assign a distinct set of chromatin features that distinguish between mitochondrial-ribosomal genes and cytosolic-ribosomal genes. The two gene groups are separated by a different binding pattern, contributed mostly by the relative enrichment of SMAD2, AFF4, CBX2, ELL2, CTR9, DMAP1, CAPH2 and WDR5 proteins in the cytosolic genes. While the histone modification pattern of both ribosomal subgroups is highly similar, a significant difference has been recorded for H3K14ac, which is selectively enriched in the cytosolic ribosomal group, but not in the mitochondrial ribosomal gene group. Although this difference could be partially explained by a globally higher expression levels of the cytosolic ribosomes, the peak distribution of the major expression-correlated histone modifications (H3K4me3, H3K9ac, H3K36me3 and others) did not present a significant change between the two groups, and H3K14ac itself was shown to be selectively enriched on a subset of inactive inducible promoters in mouse ESCs (55). While some of the predictions await further experimental validation, these results strongly suggest that our platform can generate novel insights and testable hypotheses, and can assign unique epigenetic signature to defined, or even novel, gene groups.
Despite the fact that NR5A2 was found to regulate only a limited number of ribosomal genes, our findings suggest that NR5A2 is a novel exclusive regulator of cytosolic ribosomal genes, but not mitochondrial ribosomal genes. By intersecting our binding maps with expression data of systematic knockdown and over-expression experiments, we were able to validate and considerably increase the reliability of our results. Our novel insights regarding the impact of NR5A2 on ribosomal gene expression may help shed new light on its role in pluripotent stem cells (69,70). Thus, the combination of multiple layers of data offers a complementary approach enabling us to refine our results and make our platform a strong discovery tool.
Finally, our analysis of the regulatory network of the pluripotency factors around the MBD proteins, using interaction networks, supports a role for MBD3 in stemness/pluripotency, although it does not reveal the nature of its function whether promoting or inhibiting pluripotency / reprogramming (56,57). Regardless, similar types of analyses can reveal additional potential factors controlling pluripotency, differentiation and reprogramming.
Towards a global epigenetic signature in ESCs, we have shown here a systematic way of characterizing groups of genes and identifying new commonly regulated groups. Our approach harnesses the power embedded in the union of hundreds of separately and independently performed high-throughput experiments, and enables an integrative view of all of them combined. Furthermore, the incorporation of expression-modulation assays provides us with a complementary means to extract our findings and makes it possible to produce a wider, more accurate prediction than ever before.
The available data we have so far acquired provides us with the means to inspect different angles regarding chromatin states in ESCs. Questions such as ‘which factors regulate gene family X?’ or ‘which are the common regulators of gene group Y?’ can now be more easily answered using this approach. We predict that this and similar such pipelines will be further developed and used, and will serve as discovery and inquiry platforms, allowing the scientific community to consider the entire available picture.
Supplementary Material
SUPPLEMENTARY DATA
Supplementary Data are available at NAR Online.
FUNDING
Israel Science Foundation (ISF) [1252/12 and 657/12 to E.M.]; Israel Ministry of Science (infrastructure grant to E.M.); European Research Council [ERC-281781 to E.M.]. Funding for open access charge: European Research Council [ERC-281781 to E.M.].
Conflict of interest statement. None declared.
REFERENCES
- 1.Meshorer E. SyStem cell biology: a systems biology approach to pluripotent stem cells. Syst. Biomed. 2014;1:2–4. [Google Scholar]
- 2.Bernstein B.E., Birney E., Dunham I., Green E.D., Gunter C., Snyder M. An integrated encyclopedia of DNA elements in the human genome. Nature. 2012;489:57–74. doi: 10.1038/nature11247. [DOI] [PMC free article] [PubMed] [Google Scholar]
- 3.Bernstein B.E., Stamatoyannopoulos J.A., Costello J.F., Ren B., Milosavljevic A., Meissner A., Kellis M., Marra M.A., Beaudet A.L., Ecker J.R., et al. The NIH roadmap epigenomics mapping consortium. Nat. Biotechnol. 2010;28:1045–1048. doi: 10.1038/nbt1010-1045. [DOI] [PMC free article] [PubMed] [Google Scholar]
- 4.Adams D., Altucci L., Antonarakis S.E., Ballesteros J., Beck S., Bird A., Bock C., Boehm B., Campo E., Caricasole A., et al. BLUEPRINT to decode the epigenetic signature written in blood. Nat. Biotechnol. 2012;30:224–226. doi: 10.1038/nbt.2153. [DOI] [PubMed] [Google Scholar]
- 5.Wang J., Zhuang J., Iyer S., Lin X.Y., Greven M.C., Kim B.H., Moore J., Pierce B.G., Dong X., Virgil D., et al. Factorbook.org: a Wiki-based database for transcription factor-binding data generated by the ENCODE consortium. Nucleic Acids Res. 2013;41:D171–D176. doi: 10.1093/nar/gks1221. [DOI] [PMC free article] [PubMed] [Google Scholar]
- 6.Nielsen C.B., Younesy H., O'Geen H., Xu X., Jackson A.R., Milosavljevic A., Wang T., Costello J.F., Hirst M., Farnham P.J., et al. Spark: a navigational paradigm for genomic data exploration. Genome Res. 2012;22:2262–2269. doi: 10.1101/gr.140665.112. [DOI] [PMC free article] [PubMed] [Google Scholar]
- 7.Xu H., Baroukh C., Dannenfelser R., Chen E.Y., Tan C.M., Kou Y., Kim Y.E., Lemischka I.R., Ma'ayan A. ESCAPE: database for integrating high-content published data collected from human and mouse embryonic stem cells. Database (Oxford) 2013;2013:bat045. doi: 10.1093/database/bat045. [DOI] [PMC free article] [PubMed] [Google Scholar]
- 8.Yang J.H., Li J.H., Jiang S., Zhou H., Qu L.H. ChIPBase: a database for decoding the transcriptional regulation of long non-coding RNA and microRNA genes from ChIP-Seq data. Nucleic Acids Res. 2013;41:D177–D187. doi: 10.1093/nar/gks1060. [DOI] [PMC free article] [PubMed] [Google Scholar]
- 9.Sanchez-Castillo M., Ruau D., Wilkinson A.C., Ng F.S., Hannah R., Diamanti E., Lombard P., Wilson N.K., Gottgens B. CODEX: a next-generation sequencing experiment database for the haematopoietic and embryonic stem cell communities. Nucleic Acids Res. 2014;43:D1117–D1123. doi: 10.1093/nar/gku895. [DOI] [PMC free article] [PubMed] [Google Scholar]
- 10.Gaspar-Maia A., Alajem A., Meshorer E., Ramalho-Santos M. Open chromatin in pluripotency and reprogramming. Nat. Rev. Mol. Cell. Biol. 2011;12:36–47. doi: 10.1038/nrm3036. [DOI] [PMC free article] [PubMed] [Google Scholar]
- 11.Boland M.J., Nazor K.L., Loring J.F. Epigenetic regulation of pluripotency and differentiation. Circ. Res. 2014;115:311–324. doi: 10.1161/CIRCRESAHA.115.301517. [DOI] [PMC free article] [PubMed] [Google Scholar]
- 12.Liang G., Zhang Y. Embryonic stem cell and induced pluripotent stem cell: an epigenetic perspective. Cell Res. 2013;23:49–69. doi: 10.1038/cr.2012.175. [DOI] [PMC free article] [PubMed] [Google Scholar]
- 13.Rada-Iglesias A., Wysocka J. Epigenomics of human embryonic stem cells and induced pluripotent stem cells: insights into pluripotency and implications for disease. Genome Med. 2011;3:36. doi: 10.1186/gm252. [DOI] [PMC free article] [PubMed] [Google Scholar]
- 14.Gokhman D., Livyatan I., Sailaja B.S., Melcer S., Meshorer E. Multilayered chromatin analysis reveals E2f, Smad and Zfx as transcriptional regulators of histones. Nat. Struct. Mol. Biol. 2013;20:119–126. doi: 10.1038/nsmb.2448. [DOI] [PubMed] [Google Scholar]
- 15.Livyatan I., Aaronson Y., Gokhman D., Ashkenazi R., Meshorer E. BindDB: an integrated database and webtool platform for “reverse-ChIP” epigenomic analysis. Cell Stem Cell. 2015;17:647–648. doi: 10.1016/j.stem.2015.11.015. [DOI] [PubMed] [Google Scholar]
- 16.Correa-Cerro L.S., Piao Y., Sharov A.A., Nishiyama A., Cadet J.S., Yu H., Sharova L.V., Xin L., Hoang H.G., Thomas M., et al. Generation of mouse ES cell lines engineered for the forced induction of transcription factors. Sci. Rep. 2011;1:167. doi: 10.1038/srep00167. [DOI] [PMC free article] [PubMed] [Google Scholar]
- 17.Nishiyama A., Sharov A.A., Piao Y., Amano M., Amano T., Hoang H.G., Binder B.Y., Tapnio R., Bassey U., Malinou J.N., et al. Systematic repression of transcription factors reveals limited patterns of gene expression changes in ES cells. Sci. Rep. 2013;3:1390. doi: 10.1038/srep01390. [DOI] [PMC free article] [PubMed] [Google Scholar]
- 18.Guttman M., Donaghey J., Carey B.W., Garber M., Grenier J.K., Munson G., Young G., Lucas A.B., Ach R., Bruhn L., et al. lincRNAs act in the circuitry controlling pluripotency and differentiation. Nature. 2011;477:295–300. doi: 10.1038/nature10398. [DOI] [PMC free article] [PubMed] [Google Scholar]
- 19.Dowen J.M., Bilodeau S., Orlando D.A., Hubner M.R., Abraham B.J., Spector D.L., Young R.A. Multiple structural maintenance of chromosome complexes at transcriptional regulatory elements. Stem Cell Rep. 2013;1:371–378. doi: 10.1016/j.stemcr.2013.09.002. [DOI] [PMC free article] [PubMed] [Google Scholar]
- 20.Morey L., Pascual G., Cozzuto L., Roma G., Wutz A., Benitah S.A., Di Croce L. Nonoverlapping functions of the Polycomb group Cbx family of proteins in embryonic stem cells. Cell Stem Cell. 2012;10:47–62. doi: 10.1016/j.stem.2011.12.006. [DOI] [PubMed] [Google Scholar]
- 21.Ho L., Jothi R., Ronan J.L., Cui K., Zhao K., Crabtree G.R. An embryonic stem cell chromatin remodeling complex, esBAF, is an essential component of the core pluripotency transcriptional network. Proc. Natl. Acad. Sci. U.S.A. 2009;106:5187–5191. doi: 10.1073/pnas.0812888106. [DOI] [PMC free article] [PubMed] [Google Scholar]
- 22.Schnetz M.P., Handoko L., Akhtar-Zaidi B., Bartels C.F., Pereira C.F., Fisher A.G., Adams D.J., Flicek P., Crawford G.E., Laframboise T., et al. CHD7 targets active gene enhancer elements to modulate ES cell-specific gene expression. PLoS Genet. 2010;6:e1001023. doi: 10.1371/journal.pgen.1001023. [DOI] [PMC free article] [PubMed] [Google Scholar]
- 23.Zupkovitz G., Tischler J., Posch M., Sadzak I., Ramsauer K., Egger G., Grausenburger R., Schweifer N., Chiocca S., Decker T., et al. Negative and positive regulation of gene expression by mouse histone deacetylase 1. Mol. Cell. Biol. 2006;26:7913–7928. doi: 10.1128/MCB.01220-06. [DOI] [PMC free article] [PubMed] [Google Scholar]
- 24.Farcas A.M., Blackledge N.P., Sudbery I., Long H.K., McGouran J.F., Rose N.R., Lee S., Sims D., Cerase A., Sheahan T.W., et al. KDM2B links the Polycomb Repressive Complex 1 (PRC1) to recognition of CpG islands. Elife. 2012;1:e00205. doi: 10.7554/eLife.00205. [DOI] [PMC free article] [PubMed] [Google Scholar]
- 25.Schmitz S.U., Albert M., Malatesta M., Morey L., Johansen J.V., Bak M., Tommerup N., Abarrategui I., Helin K. Jarid1b targets genes regulating development and is involved in neural differentiation. EMBO J. 2011;30:4586–4600. doi: 10.1038/emboj.2011.383. [DOI] [PMC free article] [PubMed] [Google Scholar]
- 26.Maeda I., Okamura D., Tokitake Y., Ikeda M., Kawaguchi H., Mise N., Abe K., Noce T., Okuda A., Matsui Y. Max is a repressor of germ cell-related gene expression in mouse embryonic stem cells. Nat Commun. 2013;4:1754. doi: 10.1038/ncomms2780. [DOI] [PubMed] [Google Scholar]
- 27.Kagey M.H., Newman J.J., Bilodeau S., Zhan Y., Orlando D.A., van Berkum N.L., Ebmeier C.C., Goossens J., Rahl P.B., Levine S.S., et al. Mediator and cohesin connect gene expression and chromatin architecture. Nature. 2010;467:430–435. doi: 10.1038/nature09380. [DOI] [PMC free article] [PubMed] [Google Scholar]
- 28.Li X., Li L., Pandey R., Byun J.S., Gardner K., Qin Z., Dou Y. The histone acetyltransferase MOF is a key regulator of the embryonic stem cell core transcriptional network. Cell Stem Cell. 2012;11:163–178. doi: 10.1016/j.stem.2012.04.023. [DOI] [PMC free article] [PubMed] [Google Scholar]
- 29.Vella P., Scelfo A., Jammula S., Chiacchiera F., Williams K., Cuomo A., Roberto A., Christensen J., Bonaldi T., Helin K., et al. Tet proteins connect the O-linked N-acetylglucosamine transferase Ogt to chromatin in embryonic stem cells. Mol. Cell. 2013;49:645–656. doi: 10.1016/j.molcel.2012.12.019. [DOI] [PubMed] [Google Scholar]
- 30.Li M., He Y., Dubois W., Wu X., Shi J., Huang J. Distinct regulatory mechanisms and functions for p53-activated and p53-repressed DNA damage response genes in embryonic stem cells. Mol. Cell. 2012;46:30–42. doi: 10.1016/j.molcel.2012.01.020. [DOI] [PMC free article] [PubMed] [Google Scholar]
- 31.Freudenberg J.M., Ghosh S., Lackford B.L., Yellaboina S., Zheng X., Li R., Cuddapah S., Wade P.A., Hu G., Jothi R. Acute depletion of Tet1-dependent 5-hydroxymethylcytosine levels impairs LIF/Stat3 signaling and results in loss of embryonic stem cell identity. Nucleic Acids Res. 2012;40:3364–3377. doi: 10.1093/nar/gkr1253. [DOI] [PMC free article] [PubMed] [Google Scholar]
- 32.Fazzio T.G., Huff J.T., Panning B. An RNAi screen of chromatin proteins identifies Tip60-p400 as a regulator of embryonic stem cell identity. Cell. 2008;134:162–174. doi: 10.1016/j.cell.2008.05.031. [DOI] [PMC free article] [PubMed] [Google Scholar]
- 33.Wang C., Lee J.E., Cho Y.W., Xiao Y., Jin Q., Liu C., Ge K. UTX regulates mesoderm differentiation of embryonic stem cells independent of H3K27 demethylase activity. Proc. Natl. Acad. Sci. U.S.A. 2012;109:15324–15329. doi: 10.1073/pnas.1204166109. [DOI] [PMC free article] [PubMed] [Google Scholar]
- 34.Yang Y.W., Flynn R.A., Chen Y., Qu K., Wan B., Wang K.C., Lei M., Chang H.Y. Essential role of lncRNA binding for WDR5 maintenance of active chromatin and embryonic stem cell pluripotency. Elife. 2014;3:e02046. doi: 10.7554/eLife.02046. [DOI] [PMC free article] [PubMed] [Google Scholar]
- 35.Vella P., Barozzi I., Cuomo A., Bonaldi T., Pasini D. Yin Yang 1 extends the Myc-related transcription factors network in embryonic stem cells. Nucleic Acids Res. 2012;40:3403–3418. doi: 10.1093/nar/gkr1290. [DOI] [PMC free article] [PubMed] [Google Scholar]
- 36.Galan-Caridad J.M., Harel S., Arenzana T.L., Hou Z.E., Doetsch F.K., Mirny L.A., Reizis B. Zfx controls the self-renewal of embryonic and hematopoietic stem cells. Cell. 2007;129:345–357. doi: 10.1016/j.cell.2007.03.014. [DOI] [PMC free article] [PubMed] [Google Scholar]
- 37.Nitzsche A., Paszkowski-Rogacz M., Matarese F., Janssen-Megens E.M., Hubner N.C., Schulz H., de Vries I., Ding L., Huebner N., Mann M., et al. RAD21 cooperates with pluripotency transcription factors in the maintenance of embryonic stem cell identity. PLoS One. 2011;6:e19470. doi: 10.1371/journal.pone.0019470. [DOI] [PMC free article] [PubMed] [Google Scholar]
- 38.Goldberg A.D., Banaszynski L.A., Noh K.M., Lewis P.W., Elsaesser S.J., Stadler S., Dewell S., Law M., Guo X., Li X., et al. Distinct factors control histone variant H3.3 localization at specific genomic regions. Cell. 2010;140:678–691. doi: 10.1016/j.cell.2010.01.003. [DOI] [PMC free article] [PubMed] [Google Scholar]
- 39.Ma H., Ng H.M., Teh X., Li H., Lee Y.H., Chong Y.M., Loh Y.H., Collins J.J., Feng B., Yang H., et al. Zfp322a Regulates mouse ES cell pluripotency and enhances reprogramming efficiency. PLoS Genet. 2014;10:e1004038. doi: 10.1371/journal.pgen.1004038. [DOI] [PMC free article] [PubMed] [Google Scholar]
- 40.Langmead B., Trapnell C., Pop M., Salzberg S.L. Ultrafast and memory-efficient alignment of short DNA sequences to the human genome. Genome Biol. 2009;10:R25. doi: 10.1186/gb-2009-10-3-r25. [DOI] [PMC free article] [PubMed] [Google Scholar]
- 41.Zhang Y., Liu T., Meyer C.A., Eeckhoute J., Johnson D.S., Bernstein B.E., Nusbaum C., Myers R.M., Brown M., Li W., et al. Model-based analysis of ChIP-Seq (MACS) Genome Biol. 2008;9:R137. doi: 10.1186/gb-2008-9-9-r137. [DOI] [PMC free article] [PubMed] [Google Scholar]
- 42.Zhu J., Adli M., Zou J.Y., Verstappen G., Coyne M., Zhang X., Durham T., Miri M., Deshpande V., De Jager P.L., et al. Genome-wide chromatin state transitions associated with developmental and environmental cues. Cell. 2013;152:642–654. doi: 10.1016/j.cell.2012.12.033. [DOI] [PMC free article] [PubMed] [Google Scholar]
- 43.Ho J.W., Bishop E., Karchenko P.V., Negre N., White K.P., Park P.J. ChIP-chip versus ChIP-seq: lessons for experimental design and data analysis. BMC Genomics. 2011;12:134. doi: 10.1186/1471-2164-12-134. [DOI] [PMC free article] [PubMed] [Google Scholar]
- 44.Shao Z., Zhang Y., Yuan G.C., Orkin S.H., Waxman D.J. MAnorm: a robust model for quantitative comparison of ChIP-Seq data sets. Genome Biol. 2012;13:R16. doi: 10.1186/gb-2012-13-3-r16. [DOI] [PMC free article] [PubMed] [Google Scholar]
- 45.Heinz S., Benner C., Spann N., Bertolino E., Lin Y.C., Laslo P., Cheng J.X., Murre C., Singh H., Glass C.K. Simple combinations of lineage-determining transcription factors prime cis-regulatory elements required for macrophage and B cell identities. Mol. Cell. 2010;38:576–589. doi: 10.1016/j.molcel.2010.05.004. [DOI] [PMC free article] [PubMed] [Google Scholar]
- 46.Visel A., Minovitsky S., Dubchak I., Pennacchio L.A. VISTA Enhancer Browser–a database of tissue-specific human enhancers. Nucleic Acids Res. 2007;35:D88–D92. doi: 10.1093/nar/gkl822. [DOI] [PMC free article] [PubMed] [Google Scholar]
- 47.He A., Gu F., Hu Y., Ma Q., Ye L.Y., Akiyama J.A., Visel A., Pennacchio L.A., Pu W.T. Dynamic GATA4 enhancers shape the chromatin landscape central to heart development and disease. Nat. Commun. 2014;5:4907. doi: 10.1038/ncomms5907. [DOI] [PMC free article] [PubMed] [Google Scholar]
- 48.Rojas A., Schachterle W., Xu S.M., Black B.L. An endoderm-specific transcriptional enhancer from the mouse Gata4 gene requires GATA and homeodomain protein-binding sites for function in vivo. Dev. Dyn. 2009;238:2588–2598. doi: 10.1002/dvdy.22091. [DOI] [PMC free article] [PubMed] [Google Scholar]
- 49.Bernstein B.E., Mikkelsen T.S., Xie X., Kamal M., Huebert D.J., Cuff J., Fry B., Meissner A., Wernig M., Plath K., et al. A bivalent chromatin structure marks key developmental genes in embryonic stem cells. Cell. 2006;125:315–326. doi: 10.1016/j.cell.2006.02.041. [DOI] [PubMed] [Google Scholar]
- 50.Livyatan I., Harikumar A., Nissim-Rafinia M., Duttagupta R., Gingeras T.R., Meshorer E. Non-polyadenylated transcription in embryonic stem cells reveals novel non-coding RNA related to pluripotency and differentiation. Nucleic Acids Res. 2013;41:6300–6315. doi: 10.1093/nar/gkt316. [DOI] [PMC free article] [PubMed] [Google Scholar]
- 51.Boerboom D., Pilon N., Behdjani R., Silversides D.W., Sirois J. Expression and regulation of transcripts encoding two members of the NR5A nuclear receptor subfamily of orphan nuclear receptors, steroidogenic factor-1 and NR5A2, in equine ovarian cells during the ovulatory process. Endocrinology. 2000;141:4647–4656. doi: 10.1210/endo.141.12.7808. [DOI] [PubMed] [Google Scholar]
- 52.Mizusawa Y., Kuji N., Tanaka Y., Tanaka M., Ikeda E., Komatsu S., Kato S., Yoshimura Y. Expression of human oocyte-specific linker histone protein and its incorporation into sperm chromatin during fertilization. Fertil. Steril. 2010;93:1134–1141. doi: 10.1016/j.fertnstert.2008.11.028. [DOI] [PubMed] [Google Scholar]
- 53.Le Carrour T., Assou S., Tondeur S., Lhermitte L., Lamb N., Rème T., Pantesco V., Hamamah S., Klein B., De Vos J. Amazonia!: an online resource to Google and visualize public human whole genome expression data. Open Bioinformatics J. 2010;10:5–10. [Google Scholar]
- 54.Hsiao L.L., Dangond F., Yoshida T., Hong R., Jensen R.V., Misra J., Dillon W., Lee K.F., Clark K.E., Haverty P., et al. A compendium of gene expression in normal human tissues. Physiol. Genomics. 2001;7:97–104. doi: 10.1152/physiolgenomics.00040.2001. [DOI] [PubMed] [Google Scholar]
- 55.Karmodiya K., Krebs A.R., Oulad-Abdelghani M., Kimura H., Tora L. H3K9 and H3K14 acetylation co-occur at many gene regulatory elements, while H3K14ac marks a subset of inactive inducible promoters in mouse embryonic stem cells. BMC Genomics. 2012;13:424. doi: 10.1186/1471-2164-13-424. [DOI] [PMC free article] [PubMed] [Google Scholar]
- 56.Rais Y., Zviran A., Geula S., Gafni O., Chomsky E., Viukov S., Mansour A.A., Caspi I., Krupalnik V., Zerbib M., et al. Deterministic direct reprogramming of somatic cells to pluripotency. Nature. 2013;502:65–70. doi: 10.1038/nature12587. [DOI] [PubMed] [Google Scholar]
- 57.Dos Santos R.L., Tosti L., Radzisheuskaya A., Caballero I.M., Kaji K., Hendrich B., Silva J.C. MBD3/NuRD Facilitates Induction of Pluripotency in a Context-Dependent Manner. Cell Stem Cell. 2014;15:102–110. doi: 10.1016/j.stem.2014.04.019. [DOI] [PMC free article] [PubMed] [Google Scholar]
- 58.Lu Y., Loh Y.H., Li H., Cesana M., Ficarro S.B., Parikh J.R., Salomonis N., Toh C.X., Andreadis S.T., Luckey C.J., et al. Alternative splicing of MBD2 supports self-renewal in human pluripotent stem cells. Cell Stem Cell. 2014;15:92–101. doi: 10.1016/j.stem.2014.04.002. [DOI] [PMC free article] [PubMed] [Google Scholar]
- 59.Ngondo-Mbongo R.P., Myslinski E., Aster J.C., Carbon P. Modulation of gene expression via overlapping binding sites exerted by ZNF143, Notch1 and THAP11. Nucleic Acids Res. 2013;41:4000–4014. doi: 10.1093/nar/gkt088. [DOI] [PMC free article] [PubMed] [Google Scholar]
- 60.Sridharan R., Gonzales-Cope M., Chronis C., Bonora G., McKee R., Huang C., Patel S., Lopez D., Mishra N., Pellegrini M., et al. Proteomic and genomic approaches reveal critical functions of H3K9 methylation and heterochromatin protein-1gamma in reprogramming to pluripotency. Nat. Cell Biol. 2013;15:872–882. doi: 10.1038/ncb2768. [DOI] [PMC free article] [PubMed] [Google Scholar]
- 61.Koinuma D., Tsutsumi S., Kamimura N., Taniguchi H., Miyazawa K., Sunamura M., Imamura T., Miyazono K., Aburatani H. Chromatin immunoprecipitation on microarray analysis of Smad2/3 binding sites reveals roles of ETS1 and TFAP2A in transforming growth factor beta signaling. Mol. Cell Biol. 2009;29:172–186. doi: 10.1128/MCB.01038-08. [DOI] [PMC free article] [PubMed] [Google Scholar]
- 62.Andersson R., Gebhard C., Miguel-Escalada I., Hoof I., Bornholdt J., Boyd M., Chen Y., Zhao X., Schmidl C., Suzuki T., et al. An atlas of active enhancers across human cell types and tissues. Nature. 2014;507:455–461. doi: 10.1038/nature12787. [DOI] [PMC free article] [PubMed] [Google Scholar]
- 63.Cotney J., Leng J., Oh S., DeMare L.E., Reilly S.K., Gerstein M.B., Noonan J.P. Chromatin state signatures associated with tissue-specific gene expression and enhancer activity in the embryonic limb. Genome Res. 2012;22:1069–1080. doi: 10.1101/gr.129817.111. [DOI] [PMC free article] [PubMed] [Google Scholar]
- 64.Kim T.K., Hemberg M., Gray J.M., Costa A.M., Bear D.M., Wu J., Harmin D.A., Laptewicz M., Barbara-Haley K., Kuersten S., et al. Widespread transcription at neuronal activity-regulated enhancers. Nature. 2010;465:182–187. doi: 10.1038/nature09033. [DOI] [PMC free article] [PubMed] [Google Scholar]
- 65.Kapranov P., Cheng J., Dike S., Nix D.A., Duttagupta R., Willingham A.T., Stadler P.F., Hertel J., Hackermuller J., Hofacker I.L., et al. RNA maps reveal new RNA classes and a possible function for pervasive transcription. Science. 2007;316:1484–1488. doi: 10.1126/science.1138341. [DOI] [PubMed] [Google Scholar]
- 66.Lan X., Witt H., Katsumura K., Ye Z., Wang Q., Bresnick E.H., Farnham P.J., Jin V.X. Integration of Hi-C and ChIP-seq data reveals distinct types of chromatin linkages. Nucleic Acids Res. 2012;40:7690–7704. doi: 10.1093/nar/gks501. [DOI] [PMC free article] [PubMed] [Google Scholar]
- 67.He A., Kong S.W., Ma Q., Pu W.T. Co-occupancy by multiple cardiac transcription factors identifies transcriptional enhancers active in heart. Proc. Natl. Acad. Sci. U.S.A. 2011;108:5632–5637. doi: 10.1073/pnas.1016959108. [DOI] [PMC free article] [PubMed] [Google Scholar]
- 68.Whyte W.A., Bilodeau S., Orlando D.A., Hoke H.A., Frampton G.M., Foster C.T., Cowley S.M., Young R.A. Enhancer decommissioning by LSD1 during embryonic stem cell differentiation. Nature. 2012;482:221–225. doi: 10.1038/nature10805. [DOI] [PMC free article] [PubMed] [Google Scholar]
- 69.Heng J.C., Feng B., Han J., Jiang J., Kraus P., Ng J.H., Orlov Y.L., Huss M., Yang L., Lufkin T., et al. The nuclear receptor Nr5a2 can replace Oct4 in the reprogramming of murine somatic cells to pluripotent cells. Cell Stem Cell. 2010;6:167–174. doi: 10.1016/j.stem.2009.12.009. [DOI] [PubMed] [Google Scholar]
- 70.Guo G., Smith A. A genome-wide screen in EpiSCs identifies Nr5a nuclear receptors as potent inducers of ground state pluripotency. Development. 2010;137:3185–3192. doi: 10.1242/dev.052753. [DOI] [PMC free article] [PubMed] [Google Scholar]
Associated Data
This section collects any data citations, data availability statements, or supplementary materials included in this article.