Abstract
Influenza A viruses (IAV) are zoonotic pathogens that pose a major threat to human and animal health. Influenza virus disease severity is influenced by viral virulence factors as well as individual differences in host response. We analyzed gene expression changes in the blood of infected mice using a previously defined set of signature genes that was derived from changes in the blood transcriptome of IAV-infected human volunteers. We found that the human signature was reproduced well in the founder strains of the Collaborative Cross (CC) mice, thus demonstrating the relevance and importance of mouse experimental model systems for studying human influenza disease.
Recent studies comparing inflammatory responses in mice and humans have reported conflicting results regarding whether or not the transcriptome signature found in human patients can be replicated in mice1,2. In addition, the study itself was limited by the use of a single inbred mouse strain, C57BL/6J, and not investigating responses to acute infections. Another study investigated changes in blood transcriptomes of human volunteers following H1N1 and H3N2 human influenza A virus (IAV) infection and identified a gene expression signature that distinguished non-infected from infected conditions3. The specificity and sensitivity of this signature was subsequently confirmed using another cohort4. Therefore, we studied transcriptomic changes following IAV infections in the founder strains of a genetically highly diverse experimental mouse model, the Collaborative Cross (CC)5. Using the founder strains of the CC, we aimed to address two fundamental questions: How well does the mouse reproduce the human gene signature? How much does genetic diversity influence the profile of this gene signature?
Results
Gene expression in the blood of infected mice reproduces human signature profile
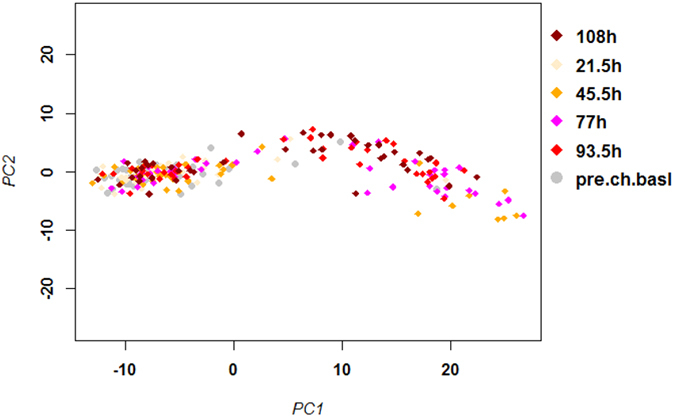
The similarity in overall gene expression changes following IAV infection in humans and mice can be best appreciated by a principal component analysis (PCA). Consistent with previous reports3, we found a separation in infected and control samples from infected human volunteers, in particular at later time points (after 77 hpi) for the 55 (unique genes from Table S1) IAV signature genes (Fig. 1). It should be noted that in our study we did not include the XIST gene, which was part of the original signature gene list (see M&M for details). Several IAV-infected samples grouped with the baseline non-infected controls and did not show an IAV-specific response even at the later times p.i. The phenomenon where infected/treated subjects do not show clearly distinct responses is often observed in human studies. A possible explanation for this effect is most likely the influence of additional environmental factors, life style, diet, health conditions and infection dose; none of which can be well-controlled in human studies.
Figure 1. PCA analysis of signature gene expression values in the blood of human volunteers.

Principle component analysis (PCA) was performed with normalized log2–transformed expression values for the signature genes identified in infected human volunteers (omitting XIST)3. Horizontal and vertical axis represent principle component 1 and 2, respectively. The first two principal components represent 85% and 5%, respectively, of the total variation. Dots represent individual samples from patients at the indicated times p.i. Colors represent the non-infected samples (pre.ch.basal) and samples from different time points p.i. as indicated.
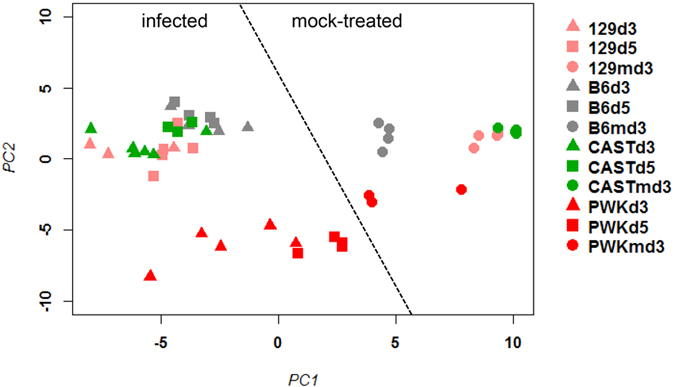
Next, we analyzed changes in gene expression for the human signature genes in the peripheral blood transcriptome of four CC founder strains (C57BL/6J, 129S1/SvlmJ, CAST/EiJ, PWK/PhJ) infected with mouse adapted H3N2 IAV that were published previously by our laboratory6. Forty-five of the human signature genes were represented on the array that was used for the analysis (Table S2). The PCA for these 45 signature genes showed a clear separation of mock-infected control and IAV-infected mice (Fig. 2) in the peripheral blood. It is noteworthy that this separation between infected and non-infected mouse samples was much more distinct compared to the human samples (Fig. 2). Furthermore, also infected PWK/PhJ mice that exhibit very mild symptoms after infection6 were well separated from the non-infected PWK/PhJ control mice6. These results demonstrate that the CC mouse-model can faithfully reproduce the human IAV gene signature in the blood. Therefore, our data validates the mouse IAV-model system as a well-controlled experimental tool for studying human IAV infections.
Figure 2. PCA analysis of gene signature expression values in the blood of CC founder mice.

Principle component analysis (PCA) was performed with normalized log2–transformed gene expression values for the mouse orthologues (Table S2) of the human signature genes (omitting XIST) after IAV infection with 10 FFU H3N2 of mice from four CC founder strains6. Horizontal and vertical axis represent principle component 1 and 2, respectively. The first two principal components represent 54% and 17%, respectively, of the total variation. Dots represent individual samples from controls at day 3 post treatments (labelled md3) or infected mice. Colors represent the different mouse strains. Symbols represent controls and different times p.i.
Analysis of single gene expression changes distinguishes high and low responder individuals
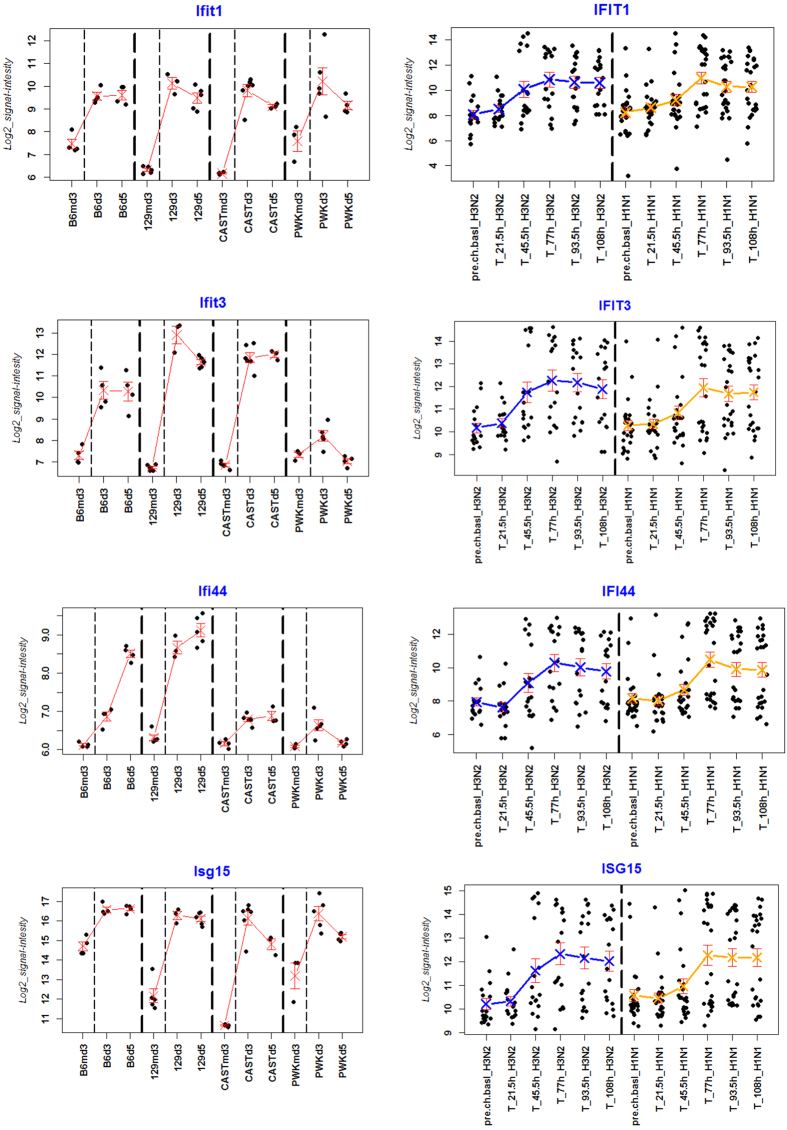
To compare gene expression patterns between human and mouse blood samples for the IAV signature profile in more details, we selected the ten most highly-expressed genes in humans. We compared the mean expression values for these genes in mice and humans (Fig. S1). As an example, expression levels in individual mice and human subjects from four genes are shown in Fig. 3. Although mean values clearly distinguished IAV-infected patients from uninfected controls at later times of infection, a large variation between individual human samples was observed (Fig. 3). In contrast to the individual variation in the human data set, the individual samples in the mouse data set consistently and reproducibly showed similar values at all time points between mice from the same inbred mouse strain. However, strong differences could be observed between individuals from different mouse strains. For example, highly susceptible strains (C57BL/6J, 129S1/SvlmJ, CAST/EiJ) exhibited a strong increase in IFIT3 and IFIT44 expression after infection but only a relatively low increase in expression was observed in the resistant strain PWK/PhJ (Fig. 3). We and others have previously reported that the magnitude of the inflammatory response following IAV infection is largely correlated with viral load as well as genetic background of the mouse-strains examined (reviewed in7). These findings suggest that genetic diversity is a major contributor of the variation in response to infection between individual humans.
Figure 3. Single gene expression values in the blood of mice and human patients for selected genes.
Normalized log2–transformed relative gene expression values of IFIT1, IFIT3, IFI44 and ISG15 in mice (left panel) and humans (right panel). Human data were taken from3, mice data from6. Dots represent values from individual mice and human volunteers. Crosses represent mean expression values per group, bars represent +/− 1 SEM (standard error of mean). Mock-infected control mice are designated ‘md3’, infected mouse groups are labelled ‘d3’ and ‘d5’ representing the time points p.i. Mouse strains: B6: C57BL/6J; 129: 129S1/SvlmJ; CAST: CAST/EiJ; PWK: PWK/PhJ. For human samples, pre.chal.basel’ represents control samples of volunteers before infection and ‘T’ designates samples from infected patients at the indicated time points. Infections were performed in humans with two IAV subtypes, H3N2 and H1N1.
Discussion
In this study, a comparison of IAV gene signature profiles clearly demonstrated that CC founder mice faithfully reproduced the human IAV-signature highlighting them as an ideal model to study human host responses to IAV infections. Although our findings are in contrast to results described by Seok et al.1, who did not find similar responses in mice and humans associated with inflammatory diseases, our findings are supported by the analysis performed by Takao et al.2. Most importantly, our study does not rely on a single mouse strain but rather uses multiple CC founder strains. The approach in our study provides a more dynamic response range that can accommodate the genotypic differences among individuals of a given population.
The PCA analysis for mice and human transcriptome changes revealed a larger variation explained by PC2 in mice than in humans. PC2 in mice separated the different mouse strains according to their susceptibility to infection: C57BL/6J, 129S1/SvlmJ, and CAST/EiJ are highly susceptible whereas PWK/PhJ is very resistant6. We previously reported that the phenotypic responses after IAV infection of CC founder mice, such as body weight loss and survival, are highly heritable6. Because a different mouse strain means a different genetic background, the variation observed for PC2 in mice can be interpreted as an effect that is mainly due to genetic differences. Accordingly, we hypothesize that genetic diversity in humans will also significantly influence the IAV-signature, especially if human patients from different ethnic backgrounds were studied. Therefore, it is important to also consider genetic diversity in future patient studies to provide a more detailed and comprehensive explanation of factors that drive variation in responses to infections in humans.
By evaluating the observed variables (genes) as vectors in a PCA biplot, the magnitude and polarity of each variable’s contribution to the first two principal components can be visualized (data not shown). It revealed that both mouse and human responses along PC1 (the infection response) are largely driven by interferon-response genes (e.g. ISG15, IFIT1). In the human data set, all genes were contributing to PC1 (the polarity of infection response) whereas in the mouse, several genes were also contributing to PC2. We attribute this to the fact that the mouse strains exhibited a high level of genetic diversity whereas the genetic diversity of the human volunteers was fairly homogeneous and composed mainly of Caucasian background (37 Caucasians, one Hispanic, one African American, one Native American, one mixed)3. Thus, we conclude that our results were less driven by species-differences than the genetic make-up of the populations that were studied. This hypothesis can be tested in future human studies using cohorts that include participants of other ethnic origin and then compare the results to the profiles from a larger strain collection of CC mice. Because the genetic architecture of the CC population (with respect to single nucleotide polymorphisms, structural variants, indels) is different from human populations, we may expect some plasticity in the up/down-regulation of single genes in mice. However, it is expected that the same pathways (i.e. interferon pathway, endocytic pathway, etc) and even the same arms of those pathways would be identical to those up/down-regulated in humans. Thus, genes that are regulated in the same fashion in the CC mouse population and a given human cohort may represent genes that are also robustly regulated in genetically diverse human populations. Therefore, studies identifying expression profiles commonly associated with susceptibility and resistance in both species are of great value.
A major weakness in carrying out human studies is typically due to cohorts being too small to sufficiently provide coverage of human genetic variability. This same weakness is also observed in other model systems using outbred and larger size experimental animals such as ferrets and swine. The CC mouse genetic reference mouse-model specifically addresses these limitations. The CC founder mice gave rise to the CC genetic reference population with hundreds of strains in which the parental genomes are segregating5. The ability to carry out well-controlled experiments using multiple mouse strains makes mice an indispensable model system for understanding and profiling responses to IAV infections in humans. Coupled with the large genetic heterogeneity of the CC founder strains and their derivative CC strains, mice will be essential to understand the varying responses to infections between individual humans, the contribution of genetic variation on the host response and the molecular mechanism that regulate these responses.
Material and Methods
Ethics statement
All experiments in mice were carried out in accordance with the approved guidelines. The protocols were approved by an external committee according to the national guidelines of the animal welfare law in Germany (BGBl. I S. 1206, 1313 and BGBl. I S. 1934). The protocol used in these experiments has been reviewed by an ethics committee and approved by the ‘Niedersächsisches Landesamt für Verbraucherschutz und Lebensmittelsicherheit, Oldenburg, Germany’ (Permit Numbers: 33.9.42502-04-051/09 and 3392 42502-04-13/1234).
Human and mouse transcriptome data sets
As data set for the human blood transcriptomes, we used gene expression data from the blood of human volunteers which had been infected with H1N1 and H3N2 IAV by Woods et al.3. The data set was downloaded from GEO (http://www.ncbi.nlm.nih.gov/geo/; GSE52428). For better visibility of the larger data set, we did not represent all groups but selected the most informative ones: one control group (control ‘pre.chal.basel’), an early time point (21.5 hr p.i.), a median (45.5 hr) and three late time points (77, 93.5 and 108 hr p.i., respectively). The later time points represent the stages after infection where IAV signature genes best distinguished infected patients from controls3.
The human influenza signature gene list has been taken from Table S4 from3. This list (Table S1) contains the top 50 genes from the discriminative factors that were obtained after infection of volunteers with H1N1 and H3N2 challenge trials and been ranked by order of individual contribution to the strength of the factor3. We have generated a combined unique gene list from this table that encompasses 55 genes in total.
A first analysis of the human gene expression profiles for the signature genes of the data set from Woods et al.3 revealed that male and female volunteers were represented as two separate groups along PC2 (Fig. S2). This was due to the inclusion of XIST in the signature gene list, a gene only expressed in females. We thus removed XIST from the gene list for further analyses.
The transcriptome data from the blood of four CC founder mice5, C57BL/6J, 129S1/SvlmJ, CAST/EiJ, and PWK/PhJ, has been described in6. Briefly, mice were infected with 10 FFU H3N2 mouse-adapted influenza A virus and blood was prepared at day 3 and day 5 p.i. As controls, mice were mock infected and blood was collected at day 3 post treatments. Whole transcriptome analysis was performed on Agilent’s mouse 4 × 44 k microarrays arrays as described6. The data set has been deposited at GEO (http://www.ncbi.nlm.nih.gov/geo/; GSE74077).
Gene expression analysis
Array data were analyzed using the R software package8. Pre-processing steps of mouse array data included background correction, quantile normalization and annotation using the MmAgilentDesign026655.db9, limma10, and Agi4 × 44PreProcess11 packages. Array data from human infections were downloaded from GEO (http://www.ncbi.nlm.nih.gov/geo/; GSE52428), log2 transformed and quantile normalized before further analysis. Principal component analysis (PCA) was performed using the affycoretools package12.
Additional Information
How to cite this article: Elbahesh, H. and Schughart, K. Genetically diverse CC-founder mouse strains replicate the human influenza gene expression signature. Sci. Rep. 6, 26437; doi: 10.1038/srep26437 (2016).
Supplementary Material
Acknowledgments
This work was supported by intra-mural grants from the Helmholtz-Association (Program Infection and Immunity) a research grant FluResearchNet (No. 01KI07137) from the German Ministry of Education and Research and by a start-up grant from UTHSC awarded to K.S. In addition, the work was supported by a start-up grant from UTHSC awarded to H.E. The funders had no role in study design, data collection and analysis, decision to publish, or preparation of the manuscript.
Footnotes
Author Contributions K.S. analyzed the data. H.E. and K.S. wrote the manuscript.
References
- Seok J. et al. Genomic responses in mouse models poorly mimic human inflammatory diseases. Proc Natl Acad Sci USA 110, 3507–3512, doi: 10.1073/pnas.1222878110 (2013). [DOI] [PMC free article] [PubMed] [Google Scholar]
- Takao K. & Miyakawa T. Genomic responses in mouse models greatly mimic human inflammatory diseases. Proc Natl Acad Sci USA, doi: 10.1073/pnas.1401965111 (2014). [DOI] [PMC free article] [PubMed] [Google Scholar]
- Woods C. W. et al. A host transcriptional signature for presymptomatic detection of infection in humans exposed to influenza H1N1 or H3N2. PLoS One 8, e52198, doi: 10.1371/journal.pone.0052198 (2013). [DOI] [PMC free article] [PubMed] [Google Scholar]
- Zaas A. K. et al. A host-based rt-PCR gene expression signature to identify acute respiratory viral infection. Sci Transl Med 5, 203ra126, doi: 10.1126/scitranslmed.3006280 (2013). [DOI] [PMC free article] [PubMed] [Google Scholar]
- Collaborative Cross Consortium. The genome architecture of the collaborative cross mouse genetic reference population. Genetics 190, 389–401, doi: 10.1534/genetics.111.132639 (2012). [DOI] [PMC free article] [PubMed] [Google Scholar]
- Leist S. R. et al. Influenza H3N2 infection of the collaborative cross founder strains reveals highly divergent host responses and identifies a unique phenotype in CAST/EiJ mice. BMC Genomics 17, 143, doi: 10.1186/s12864-016-2483-y (2016). [DOI] [PMC free article] [PubMed] [Google Scholar]
- Kollmus H., Wilk E. & Schughart K. Systems biology and systems genetics-novel innovative approaches to study host-pathogen interactions during influenza infection. Curr Opin Virol 6C, 47–54, doi: 10.1016/j.coviro.2014.03.008 (2014). [DOI] [PubMed] [Google Scholar]
- R_Core_Team. R: A language and environment for statistical computing. R Foundation for Statistical Computing, Vienna, Austria. URL http://www.R-project.org/ (2013).
- Carlson M. MmAgilentDesign026655.db: Agilent Chips that use Agilent design number 026655 annotation data (chip MmAgilentDesign026655). R package version 2.14.0. URL http://www.bioconductor.org/packages/release/data/annotation/html/MmAgilentDesign026655.db.html (2014).
- Smyth G. K. Linear models and empirical bayes methods for assessing differential expression in microarray experiments. Stat Appl Genet Mol Biol 3, Article 3, doi: 10.2202/1544-6115.1027 (2004). [DOI] [PubMed] [Google Scholar]
- Gentleman R. C. et al. Bioconductor: open software development for computational biology and bioinformatics. Genome Biol 5, R80, doi: 10.1186/gb-2004-5-10-r80 (2004). [DOI] [PMC free article] [PubMed] [Google Scholar]
- MacDonald J. Affycoretools: Functions useful for those doing repetitive analyses with Affymetrix GeneChips. R package version 1.34.0. URL: http://bioconductor.org/packages/release/bioc/html/affycoretools.html (2008).
Associated Data
This section collects any data citations, data availability statements, or supplementary materials included in this article.


