Abstract
We have shown that the in vitro hepatic microsomal metabolism of pyranocoumarin compound decursinol angelate (DA) to decursinol (DOH) exclusively requires cytochrome P450 enzymes (CYP) whereas the conversion of its isomer decursin (D) to DOH can be mediated by CYP and esterase(s). To provide insight into specific isoforms involved, here we show with recombinant human CYP that 2C19 was the most active at metabolizing D and DA in vitro followed by 3A4. With carboxylesterases (CES), D was hydrolyzed by CES2 but not CES1, and DA was resistant to both CES1 and CES2. In human liver microsomal preparation, general CYP inhibitor 1-aminobenzotriazole (ABT) and respective competitive inhibitors for 2C19 and 3A4, (+)-N-3-benzylnirvanol and ketoconazole, substantially retarded the metabolism of DA and, to a lesser extent, of D. In healthy human subjects from a single-dose pharmacokinetic study, 2C19 extensive metabolizer genotype (2C19*17 allele) tended to have less plasma DA AUC0–48h and poor metabolizer genotype (2C19*2 allele) tended to have greater DA AUC0–48h. In mice given a single dose of D/DA, pretreatment with ABT boosted the plasma and prostate levels of D and DA by more than an order of magnitude. Taken together, our findings suggest that CYP isoforms 2C19 and 3A4 may play a crucial role in the first pass liver metabolism of DA and, to a lesser extent, that of D in humans. Pharmacogenetics with respect to CYP genotypes and interactions among CYP inhibitor drugs and D/DA should therefore be considered in designing future translation studies of DA and/or D.
Keywords: decursin, decursinol angelate, decursinol, cytochrome P450, pharmacogenetics, Angelica gigas Nakai
Introduction
Pyranocoumarin isomers decursin (D) and decursinol angelate (DA) (see structures in Fig. 1a) are the predominant chemical components in the ethanol extract of the root of Angelica gigas Nakai (AGN), an herb used as traditional medicine in Korea and other Asian countries. The in vitro and in vivo anti-cancer, neuro-protective and other biological activities of D/DA as well as AGN extracts have been well documented and reviewed (Zhang et al., 2012). Dietary supplements containing AGN root extract are sold for pain relief, memory enhancement (Alzheimer’s disease) and women’s health, especially menopausal symptoms in the United States and globally.
Figure 1.
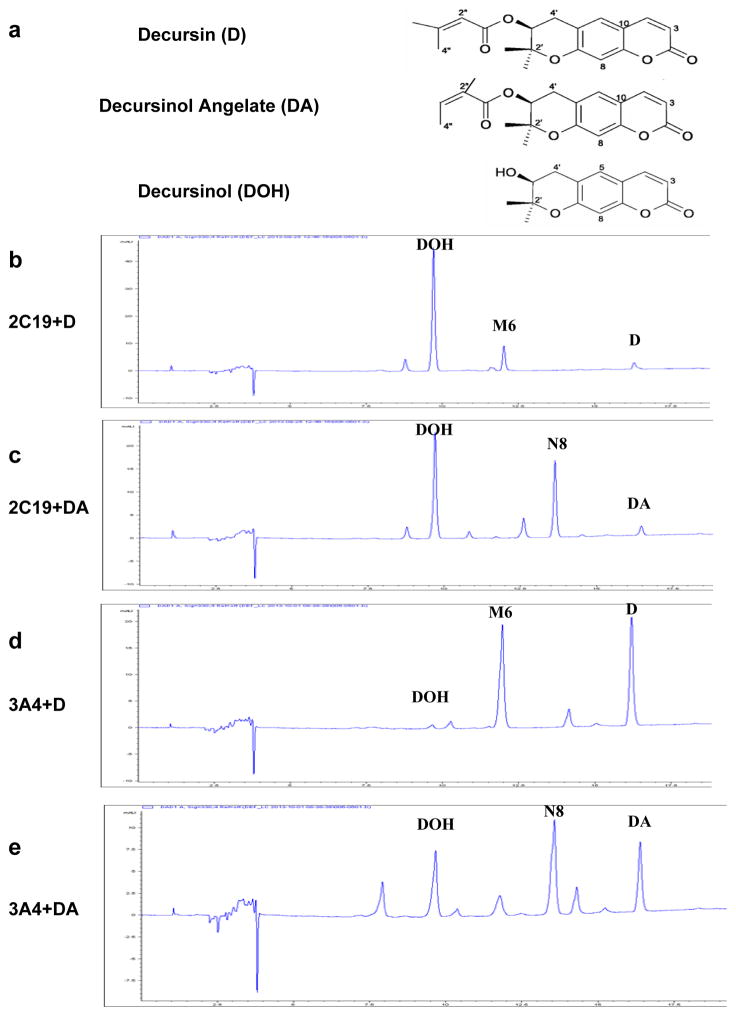
In vitro metabolism of D and DA by recombinant human CYP 2C19 and 3A4 proteins. Panel a, Structures of decursin (D), decursinol angelate (DA) and decursinol (DOH). Panel b, CYP 2C19 metabolism of D. Panel c, CYP 2C19 metabolism of DA. Each reaction system contained 10 pmol/mL 2C19. Panel d, CYP 3A4 metabolism of D. Panel e, CYP 3A4 metabolism of DA. Reaction system contained 100 pmol/mL 3A4. Reactions were terminated after 10 minutes. UV detection wavelength was 330nm for HPLC-chromatograms. M6 and N8 correspond to respective mono-oxygenated metabolite of D and DA in human liver microsome incubation we previously identified (Li et al., 2013a).
We and others have demonstrated that D and DA are rapidly converted to decursinol (DOH, see structure in Fig. 1a) in rodents after oral administration (Li et al., 2012; Park et al., 2012; Li et al., 2013b). Our in vitro metabolism experiments using human and murine liver microsomal preparations have indicated differential enzyme systems involved in the metabolism of D and DA: DA is exclusively metabolized by cytochrome P450 (CYP) enzymes, whereas D is metabolized by CYP and esterase(s) (Li et al., 2013a).
Recently, we performed a single dose pharmacokinetic (PK) study of D/DA in healthy human subjects (Clinicaltrials.gov Identifier NCT02114957). Our data have shown that the PK behavior of D and DA is qualitatively the same between human and rodents (Zhang et al., 2015), thereby strengthening the biological and mechanistic relevance of the rodent models. In the human PK data we noticed much greater variation in the Cmax and AUC0–48h of DA, as much as 60 fold, among subjects than those of D and DOH (Zhang et al., 2015). Since the liver metabolism of DA is exclusively CYP-mediated (Li et al., 2013a), the genetic polymorphism of CYP isoforms might be a contributor to the PK parameter variations.
In the present work, we delineated the specific CYP isoforms and carboxylesterases (CES) in the metabolism of D and DA using in vitro recombinant human enzymes and human liver microsomal (HLM) preparations. We examined possible associations of CYP genotypes with D and DA PK parameters in human subjects. The findings suggest that CYP 2C19 and 3A4 play important roles in the liver first pass metabolism of DA and, to a lesser extent, of D in humans. Using mice as an in vivo model, we assessed the impact of inhibiting CYP on D/DA metabolism and their prostate tissue deposition. The data indicate that the in vivo metabolism of D/DA can be profoundly altered by interactions with a CYP inhibitor drug.
Material and Methods
Reagents and Chemicals
D and DA were first co-purified as a mixture from an ethyl acetate soluble fraction of the AGN extract by silica chromatography (Li et al., 2012; Li et al., 2013b). The D/DA mixture was further purified using HPLC to separate D and DA as previously described (Li et al., 2013a). DOH was prepared by hydrolysis of D/DA mixture as reported previously (Li et al., 2013b). The purity of D, DA and DOH was verified to be higher than 99% by HPLC. Prednisolone (internal standard [IS] for UHPLC-MS/MS), ketoconazole and ethyl acetate were purchased from Sigma-Aldrich Co. (St. Louis, MO). HPLC grade methanol, acetonitrile, (+)-N-3-benzylnirvanol and 1-aminobenzotriazole were from Fisher Scientific (Pittsburgh, PA). B&J brand LC-MS grade water and acetonitrile were purchased from Honeywell (Morristown, NJ). Recombinant human cytochrome P450 (EasyCYP) enzymes 1A2, 2C9, 2C19, 2D6, 3A4 and carboxylesterase 1 (CES1) and CES2 and their respective bactosomes (i.e., proteins expressed by host bacteria with empty vector) were purchased from XenoTech (Lenexa, KS) as a negative control.
Incubations with human cDNA-expressed CES and CYP enzyme isoforms
D or DA was incubated with cDNA-expressed human CYP isoforms, or CES1 or CES2, according to the manufacturer’s instruction. The reaction mixture (0.2 mL) consisted of 10 or 100 pmol/mL CYP enzyme, or 100 μg/mL CES, the substrate (D or DA at 6 μM) and 50 mM potassium phosphate buffer, pH 7.4. The concentration of D and DA was selected based on an estimation of their concentration in the portal vein after intestinal absorption (Park et al., 2012). The NADPH generating system and magnesium chloride were added to the reaction mixture of CYP enzymes with the final concentrations of 1 mM and 5 mM, respectively. The final concentration of methanol was 0.5% (v/v). It has been reported that the activities of CYP isoforms 1A2, 2C9, 2C19, 2D6 and 3A4 were not substantially affected by 1% methanol (Chauret et al., 1998; Busby et al., 1999). At indicated time points, the reactions were terminated by addition of 1500 μL of ice-cold ethyl acetate. The samples were then extracted and analyzed by HPLC-UV and UHPLC-MS/MS as previously described (Li et al., 2013a).
In vitro metabolism in human liver microsomes (HLM) in the presence of CYP inhibitors
Selective CYP inhibitors were added to human liver microsome (HLM) incubations with D or DA. The incubation mixture contained 1 mg/mL HLM, 50 mM potassium phosphate buffer (pH=7.4), 1 mM NADPH and the substrate (D or DA at 6 μM) (Li et al., 2013a). The final concentration of methanol was 0.5% (v/v). Inhibitors used in this study were general CYP inhibitor 1-aminobenzotriazole (ABT) (Balani et al., 2004), competitive inhibitor of CYP isoform 2C19 (+)-N-3-benzylnirvanol (NBN) (Cai et al., 2004) and competitive inhibitor of CYP isoform 3A4 ketoconazole. The stock solutions of inhibitors were made in DMSO and the maximal concentration of DMSO in all experiments was 0.5% (v/v). Preliminary experiments indicated that 0.5% DMSO did not have effect on the conversion of D or DA when incubated with HLM (data not shown). The inhibitor concentration was 1 mM for ABT (Balani et al., 2004), 10 μM for NBN (Zhang et al., 2007; Kazui et al., 2010) and 2 μM for ketoconazole (Daneshmend and Warnock, 1988; Khojasteh et al., 2011). The suicide mechanism-dependent inhibitor ABT was first pre-incubated with HLM in the presence of NADPH for 20 minutes before the substrate was added (Zhang et al., 2009). NBN or ketoconazole was concurrently added with substrate to the reaction mixture. After incubation at 37°C for 1 hour, samples were extracted and quantitated as previously described (Li et al., 2013a). All in vitro metabolism experiments were conducted independently 3 times or more.
Human study and bio-specimens
The IRB protocol for the human study (A12-3742) was approved by TTUHSC IRB committee. The study was registered in Clinicaltrials.gov (Identifier NCT02114957) and the PK data have been reported (Zhang et al., 2015). Peripheral blood mononuclear cells (PBMCs) were isolated from heparinized blood using reagents from QIAamp® RNA Blood Mini kit (QIAGEN, CA, USA).
CYP single nucleotide polymorphism (SNP) genotyping
Genomic DNA was prepared from PBMCs using AllPrep® DNA/RNA/Protein Mini kit (QIAGEN, CA, USA). Single nucleotide polymorphism (SNP) 2C9*2 (3608C>T, rs1799853) and 2C9*3 (42614A>C, rs1057910) were genotyped by PCR-RFLP (Polymerase Chain Reaction Followed by Restriction Fragment Length Polymorphism Assay) as reported by Nasu et al (Nasu et al., 1997). The following SNPs 2C19*2 (19154G>A, rs4244258), 2C19*3 (17948G>A, rs4986893), 2C19*17 (−806C>T, rs12248560), 2D6*4 (1846G>A, rs3892097), 3A4*22 (15389C>T, rs35599367) and 3A5*3 (6986A>G, rs776746) were genotyped using TaqMan genotyping assays (Life Technologies, CA, USA) according to manufacturer instructions. Pharmacokinetic parameters such as Cmax and AUC0–48h were compared among subjects bearing different genotypes of CYP isoforms using GraphPad Prism software (version 6.00).
Animal Experiment
The animal protocol was approved by the Texas Tech University Health Sciences Center Institutional Animal Care and Use Committee (IACUC). Male C57BL/6J mice (8 weeks old) were purchased from The Jackson Laboratory (Bar Harbor, ME, USA). One group of mice were given 3 mg general CYP inhibitor ABT dissolved in 0.2 ml water by oral gavage and the control group of mice were each given 0.2 ml water. Two hours after ABT administration, each mouse was given 6 mg D/DA mixture (approximately 3.6 mg D and 2.4 mg DA) in 0.3 ml of vehicle consisting of 3:6:1:20 ethanol/PEG400/Tween 80/5% Dextrose. Terminal blood samples were taken at either 1 hour or 2 hours post-D/DA dose (n =5 mice per time point). Whole prostate lobes were dissected and snap frozen on dry ice and stored at −80°C until analyses. Prostate was homogenized in 20 volumes of water in an ice bath. Plasma and prostate lysates were extracted with ethyl acetate and their D, DA and DOH were quantitated by our published methods (Li et al., 2012; Li et al., 2013b).
Results
In vitro metabolism of D and DA by recombinant human CESs and CYP isoforms
We did test-tube screening of recombinant human CES1 and CES2 and CYP enzyme isoforms for D and DA metabolism. Neither CES1 nor CES2 converted DA to DOH under the conditions tested (Table 1). On the other hand, CES2, but not CES1, converted D to DOH (Table 1). For the recombinant CYP, we chose five isoforms 1A2, 2C9, 2C19, 2D6 and 3A4, accounting for the metabolism of about 80% of marketed drugs (Zanger and Schwab, 2013). Under incubation condition of NADPH redox cycling at 37 °C for 10 minutes, the potency rank order was 2C19 ≫ 3A4 > 2C9 > 2D6 > 1A2 (inactive) (Table 1).
Table 1.
Relative potency of recombinant human carboxylesterase (CES)1/2 and CYP450 isoforms in metabolism of D and DA in vitro.
| Substrate | Carboxylesterase | CYP Enzyme protein isoforms | ||||||||||
|---|---|---|---|---|---|---|---|---|---|---|---|---|
| CES1 μg/mL | CES2 μg/mL | 1A2 pmol/mL | 2C9 pmol/mL | 2C19 pmol/mL | 2D6 pmol/mL | 3A4 pmol/mL | ||||||
| 100 | 100 | 10 | 100 | 10 | 100 | 10 | 100 | 10 | 100 | 10 | 100 | |
| D | − | +++ | − | − | −/+ | ++ | ++++ | ++++ | −/+ | + | + | ++ |
| DA | − | − | − | − | −/+ | ++ | ++++ | ++++ | −/+ | + | + | +++ |
− no detectable conversion; −/+ less than 5% conversion; + 5~25% conversion; ++ 25~50% conversion; +++ 50~75% conversion; ++++ near 100% conversion to DOH.
More specifically, as little as 10 pmol/mL 2C19 was able to metabolize almost all D or DA substrates within 10 minutes (Fig. 1b,c). The average velocity of 2C19 in the first 10 minutes was 60 pmol D or DA per minute per pmol CYP. In comparison, 3A4 had moderate activity (Fig. 1d,e) with average velocity in the first 10 minutes of 4 and 5 pmol per minute per pmol CYP for D and DA, respectively. Even at 100 pmol/mL, 3A4 was not able to metabolize all substrates within 30 minutes (not shown). These data suggest that 3A4 activity toward D and DA might be much lower than that of 2C19. Although 3A4 was the second-most efficient P450 isoform to convert DA to DOH, its abundance is about ten times higher than 2C19 in human liver (Zanger and Schwab, 2013) and therefore might by mass action also significantly contribute to the metabolism of D and DA in vivo.
In addition, both 2C19 and 3A4 generated metabolite M6 from D (Fig. 1b,d) and N8 from DA (Fig. 1c,e), previously identified as the most abundant metabolites besides DOH from D and DA, respectively, in HLM incubation (Li et al., 2013a). These metabolites were most probably through an addition of one oxygen atom (hydroxylation/epoxidation) to the butenyl side chain of the parent compounds in M6 and N8, and they could be detected in the plasma of mice treated with D and DA by gavage (Li et al., 2013a). In contrast to the above findings with NADPH redox cycling, when incubated in the absence of NADPH, even 2C19 was not able to convert D and DA to DOH or to any of the above metabolites (not shown). This further confirmed that the CYP-catalyzed conversion of D and DA to DOH was oxidative hydrolysis of the side chain.
Effect of CYP inhibitors on in vitro metabolism of D and DA by human liver microsome (HLM)
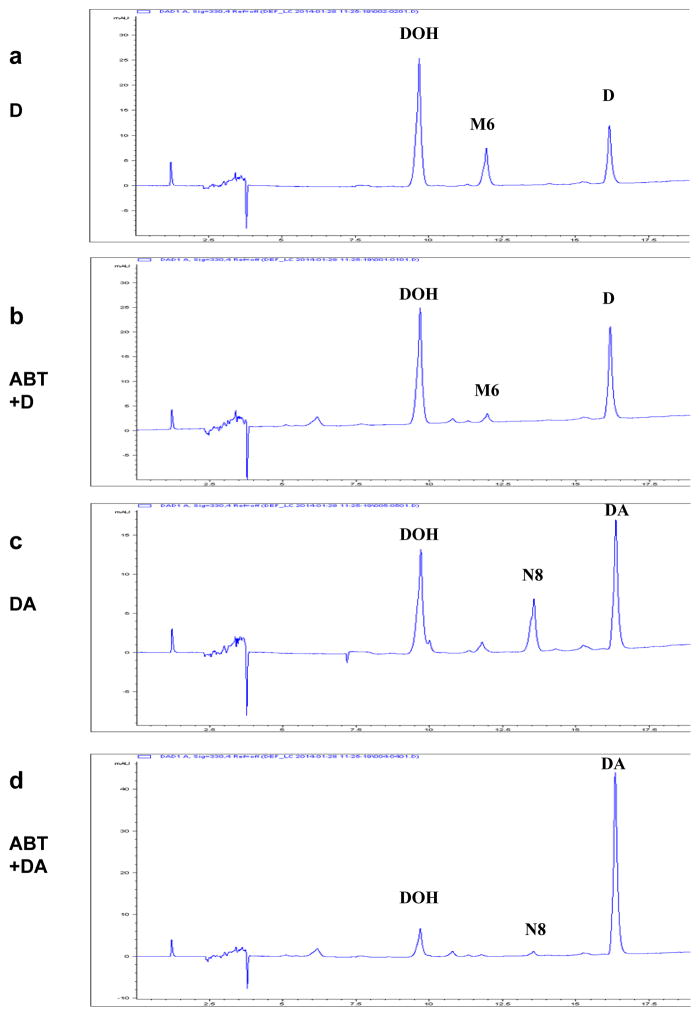
General CYP inhibitor ABT decreased the percentage of D metabolized by HLM, with little effect on the generation of DOH (Fig. 2b vs. a). The main effect of ABT was decreasing the generation of metabolite M6 from D. The finding is consistent with D conversion to DOH by CYP as well as CES2 (Table 1) and our earlier report (Li et al., 2013a), and therefore blocking CYP did not affect the CES hydrolysis of D to DOH. In contrast to D metabolism, ABT almost blocked the in vitro metabolic conversion of DA in HLM incubation, such that there were only minimal amount of DOH and metabolite N8 generated in the presence of ABT (Fig. 2 d vs. c). Although pre-incubation with ABT could not totally inhibit the activities of all CYP enzymes (Linder et al., 2009), the data confirmed our previous conclusion that HLM metabolism of DA was CYP-mediated (Li et al., 2013a). Similar trend was observed in human and mouse liver S9 fraction incubation (not shown).
Figure 2.
Effect of general CYP inhibitor 1-aminobenzotriazole (ABT) on in vitro human liver microsomal (HLM) metabolism of D and DA. Panel a. D with solvent vehicle. Panel b. D with ABT. Panel c. DA with solvent vehicle. Panel d. DA with ABT. HLM was first incubated with ABT (b & d) or vehicle (a & c) for 20 minutes before D or DA was added to the reactions. Reactions were terminated after 60 minutes. UV detection wavelength was 330nm for HPLC-chromatograms. M6 and N8 correspond to respective mono-oxygenated metabolite of D and DA in HLM incubation we previously identified (Li et al., 2013a).
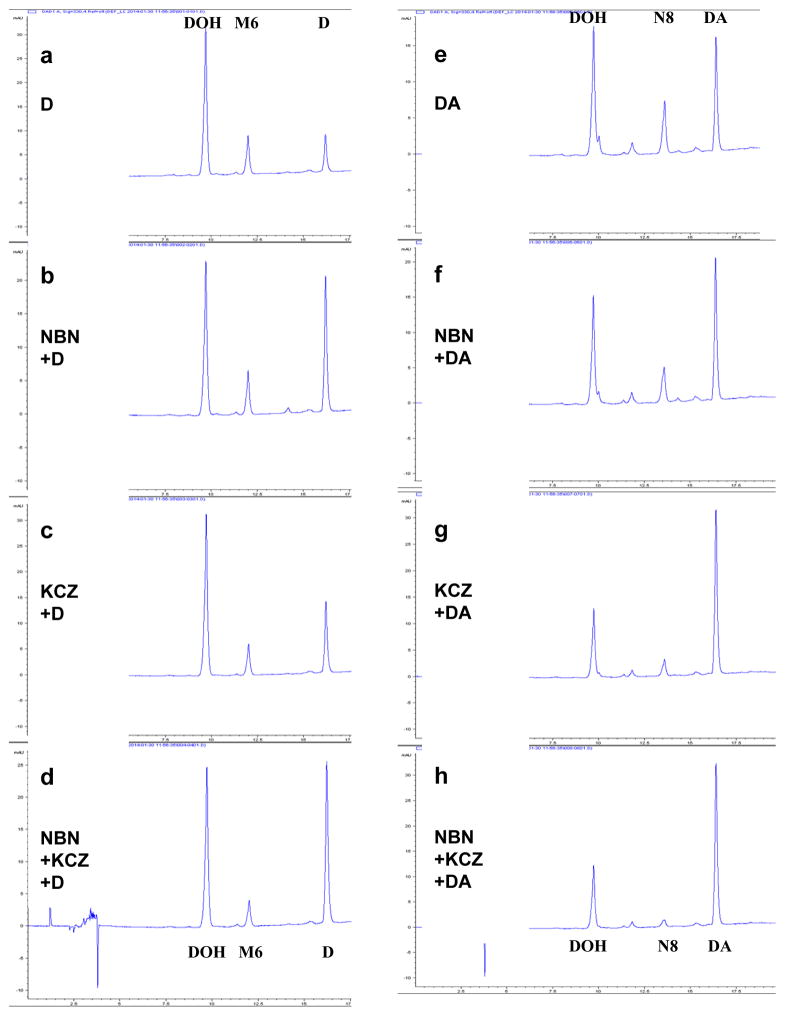
We further investigated the effects of specific inhibitors for 2C19 and 3A4 on the in vitro metabolism of D and DA by HLM. The 2C19 inhibitor NBN retarded the disappearance of D (Fig. 3b vs. a) to a greater extent than that of DA (Fig. 3f vs. e). The 3A4 inhibitor ketoconazole (KCZ) exerted a greater extent of inhibition of DA conversion to DOH and metabolite N8 (Fig. 3g vs. e) than on the disappearance of D (Fig. 3c vs. a). Overall, the two inhibitors acted in an additive manner on the disappearance of D (Fig. 3d) and on the disappearance of DA and the production of N8 and DOH (Fig. 3h). Given that it has been reported that 10 μM NBN or 1 μM ketoconazole were only able to partially inhibit 2C19 and 3A4 activities in HLM by 55% and 59% (determined by corresponding probe reactions), respectively (Linder et al., 2009), the data nevertheless support 2C19 and 3A4 as major CYP isoforms involved in the metabolism of DA and D.
Figure 3.
Effect of competitive CYP 2C19 inhibitor (+)-N-3-benzylnirvanol (NBN) and competitive CYP 3A4 inhibitor ketoconazole (KCZ) on in vitro metabolism of D (Panels a–d) and DA (Panels e–h) by human liver microsome (HLM). D or DA was added to the reactions concurrently with solvent control (a & e), NBN (b & f), ketoconazole (c & g), NBN and ketoconazole (d & h). Reactions were terminated after 60 minutes. UV detection wavelength was 330nm for HPLC-chromatograms. M6 and N8 correspond to respective mono-oxygenated metabolite of D and DA in HLM incubation we previously identified (Li et al., 2013a).
Comparison of human DA PK parameters by racial categories
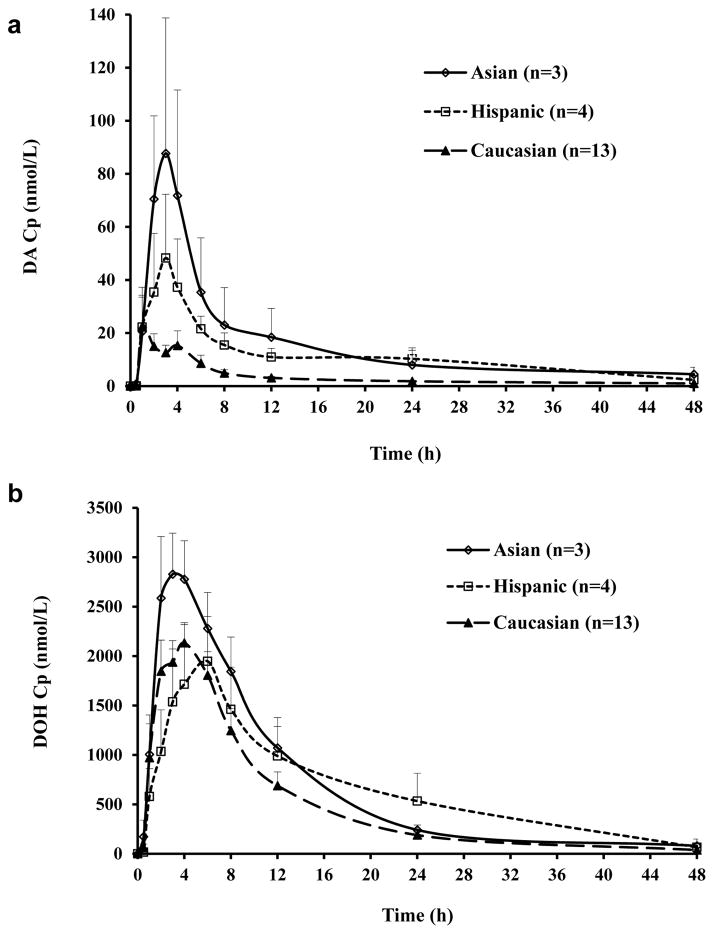
Taking advantage of PK data available from our recently completed human study of D and DA (Zhang et al., 2015), we examined whether racial categories known to vary greatly in CYP isoforms (Mizutani, 2003; Zanger and Schwab, 2013) might correlate with DA PK parameters. There were 13 Caucasians, 4 Hispanics and 3 Asians (India Nationals) in the PK study. Figure 4 showed the mean plasma DA (Fig. 4a) and DOH (Fig. 4b) profiles of subjects in each racial category. Hispanic and Asian subjects seemed to attain higher level of DA in the plasma than Caucasians. Since both the D’Agostino & Pearson omnibus normality test and Shapiro-Wilk normality test indicated that Area Under the Curve (AUC0–48h) data were not normally distributed, we compared the AUC0–48h among three racial groups using non-parametric Kruskal-Wallis test. The result suggested that AUC0–48h of DA was statistically different among three groups (p<0.05). Since the conversion from DA to DOH was exclusively CYP-mediated, and given CYP 2C19 isoform converted D and DA most efficiently among the isoforms tested (Table 1), it is interestingly to note that Asians have more poor-metabolizer (PM) genotypes of 2C19 than Caucasians who have more extensive-metabolizers (EM) (Mizutani, 2003; Zanger and Schwab, 2013) (Table 2) and the Asian subjects had the highest AUC0–48h of DA (Fig. 4a).
Figure 4.
Human plasma concentrations (Cp) of DA (Panel a) and DOH (Panel b) as a function of time by racial categories. Mean ± SEM.
Table 2.
Allele frequencies of CYP SNP polymorphisms: comparison between literature reports and data from our study subjects.
| CYP allele designation | Mutation | refrence SNP ID | Allele frequency (%)
|
|||||
|---|---|---|---|---|---|---|---|---|
| Literature | A12-3742 | |||||||
|
| ||||||||
| Caucasian | Hispanic | Asian | Caucasian (n=13) | Hispanic (n=4) | Asian (n=3) | |||
| CYP2C9*2 | 3608C>T | rs1799853 | 10~17 | 6.5 | 0~2 | 12 | 0 | 0 |
| CYP2C9*3 | 42614A>C | rs1057910 | 6 | N.A. | 2~6 | 8 | 12 | 0 |
| CYP2C19*2 | 19154G>A | rs4244285 | 6~15 | 15 | 22~32 | 12 | 0 | 33 |
| CYP2C19*3 | 17948G>A | rs4986893 | 0~1 | 0~1 | 3~7 | 0 | 0 | 0 |
| CYP2C19*17 | −806C>T | rs12248560 | 21~25 | N.A. | 0~2 | 35 | 0 | 17 |
| CYP2D6*4 | 1846G>A | rs3892097 | 15~25 | 1~10 | 1~10 | 19 | 0 | 0 |
| CYP3A4*22 | 15389C>T | rs35599367 | 2.5~8 | N.A. | 4.3 | 15 | 0 | 0 |
| CYP3A5*3 | 6986A>G | rs776746 | 88~97 | 66~75 | 66~75 | 100 | 75 | 100 |
Because the small number of samples in Asian and Hispanic categories, the results will need to be confirmed with more subjects in the future.
Correlation between CYP genotypes and PK parameters in humans
To seek more insight into CYP status of our study subjects, we genotyped their PBMC DNA for CYP single nucleotide polymorphisms (SNPs) that had been reported to affect the expression and/or activity of corresponding enzyme isoforms (Zanger and Schwab, 2013). Table 2 showed that the allele frequencies of all 8 SNPs were similar between our cohort and the literatures.
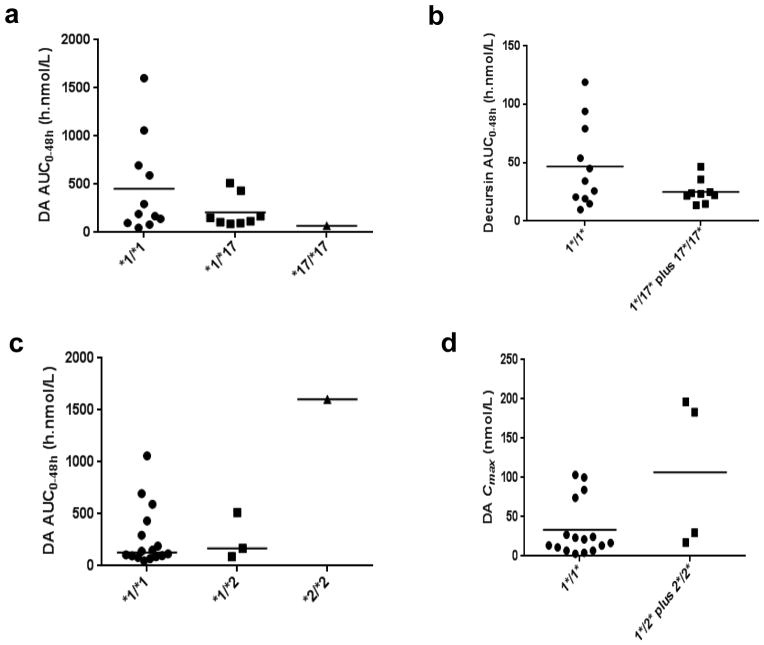
The 2C19*17 allele has been reported to be associated with increased enzyme activity, i.e., extensive metabolizer (EM) and accordingly lower plasma concentrations of imipramine and other drugs (Li-Wan-Po et al., 2010) (Schenk et al., 2010). We found a trend of gene-dose effect of 2C19*17 allele on the plasma AUC0–48h of DA in human subjects (Fig. 5a). The one 2C19*17 homozygote and seven of eight 2C19*17 heterozygotes were Caucasians, with the remaining heterozygote being an Asian of India nationality. The much higher 2C19*17 allele frequency in Caucasians was associated with their lowest mean plasma AUC0–48h of DA among the 3 racial categories (Fig. 4a).
Figure 5.
PK parameter AUC0–48h of DA in healthy human subjects by their CYP SNP genotypes. Panel a, 2C19*17 (extensive metabolizer); Panel b, 2C19*2 (poor metabolizer). Panel c, 2C9*2 (poor metabolizer); Panel d, 2C9*3 (poor metabolizer); Panel e, 2D6*4 (poor metabolizer); Panel f, 3A4*22 (poor metabolizer).
Subjects bearing 2C19*2 and 2C19*3 alleles can be classified as poor metabolizers (PM) (Zanger and Schwab, 2013). In our study, no subject bore the 2C19*3 allele. Three 2C19*2 heterozygotes were all Caucasians. The only 2C19*2 homozygote was an Asian of India nationality, who had the highest plasma AUC0–48h of DA among all 20 subjects (Fig. 5b). Since 2 out of the three 2C19*2 heterozygotes were also 2C19*17 heterozygotes, thus nullifying each other’s activity, a gene-dose effect of 2C19*2 allele was not apparent.
The other 5 SNPs (2C9*2, 2C9*3, 2D6*4, 3A4*22 and 3A5*3) have been reported as PM genotypes (Zanger and Schwab, 2013). However, plasma DA AUC0–48h of subjects bearing these alleles was not higher (Fig. 5c–f). Because 2 out of 4 subjects bearing 2D6*4 allele (Fig. 5e) and 3 out of 4 subjects bearing 3A4*22 allele (Fig. 5f) were also 2C19*17 heterozygotes, the data might reflect an over-powering EM effect of 2C19*17. Another possibility is that except 3A4, most of these CYP isoforms were not active for D and DA metabolism (Table 1). Taken together, 2C19 EM (bearing 2C19*17 allele) tended to have lower plasma DA and D levels whereas 2C19 PM (bearing 2C19*2 allele) tended to have greater plasma DA levels.
Effect of general CYP inhibitor ABT on plasma and prostate D, DA and DOH level in mice
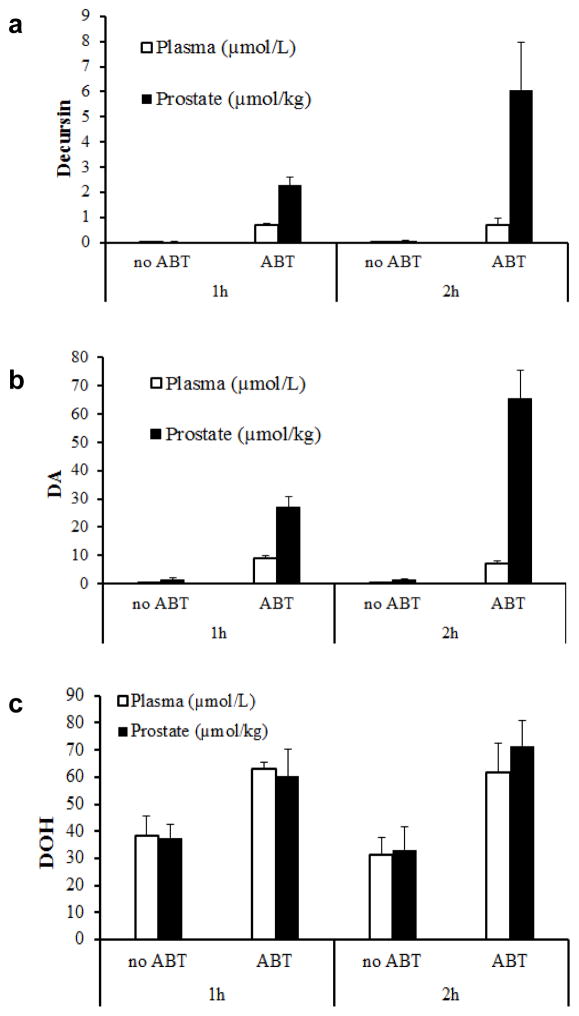
Because the results of the in vitro studies and human CYP SNP-DA PK parameter associations and previous publications (Park et al., 2012; Li et al., 2013a) suggest significant first pass liver metabolism of D/DA in rodents and humans alike, we examined in mice the in vivo impact of inhibiting CYP activity on plasma D, DA and DOH vs. in prostate tissue. We were particularly interested in the D and DA levels in prostate because of our long standing interest in the chemopreventive effect of D/DA against prostate cancer (Jiang et al., 2006; Guo et al., 2007; Zhang et al., 2012; Zhang et al., 2014). We collected blood (plasma) and prostates at 1 and 2 hours after administering D/DA to mice. Without ABT pretreatment, the plasma levels of D and DA at 1 and 2 hours were 0.02 and 0.03 μM for D (Fig. 6a), and 0.33 and 0.23 μM for DA (Fig. 6b). Corresponding prostate tissue contents for 1 and 2 hours were 0.04 and 0.10 μmol/kg for D (Fig. 6a), and 1.52 and 1.35 μmol/kg for DA (Fig. 6b). With ABT pretreatment (~150 mg/kg oral ABT) for 2 h prior to D/DA dosing, the plasma D level was increased by 32 and 26 fold at 1 and 2 hours (0.70 and 0.72 μM) (Fig. 6a), and DA level was increased by 30 folds at both time points (9.11 and 7.06 μM) (Fig. 6b). The prostate D content was increased by 61 fold at both time points (2.29 and 6.06 μmol/kg) (Fig. 6a) and the DA content was increased by 18 and 48 fold at 1 and 2 hours (26.98 and 65.42 μmol/kg) (p<0.05 for both parent compounds, time points and organ sites, n=5) (Fig. 6b). Whereas a reduction of the plasma DOH level and prostate DOH content was anticipated for the ABT-pretreated mice, their observed values were, on the contrary, increased at each time point by ABT by ~1.5–2 fold (Fig. 6c). The results suggest profound interactions among CYP inhibitor drug and D/DA metabolism that could significantly alter systemic and prostate deposition of D, DA and DOH, meriting further future research.
Figure 6.
Effects of oral administration of general CYP inhibitor 1-aminobenzotriazole (ABT) on plasma concentration and prostate content of D, DA and DOH in mice. Panel a, D; Panel b DA; Panel c, DOH. Control mice received water and ABT group received 3 mg ABT gavage per mouse 2 h prior to D/DA dose. Mice were given gastric gavage of 6 mg D/DA mixture (3.6mg D and 2.4 mg DA). Blood and prostate samples were collected 1 or 2 hours after administration of D/DA mixture.
Discussion
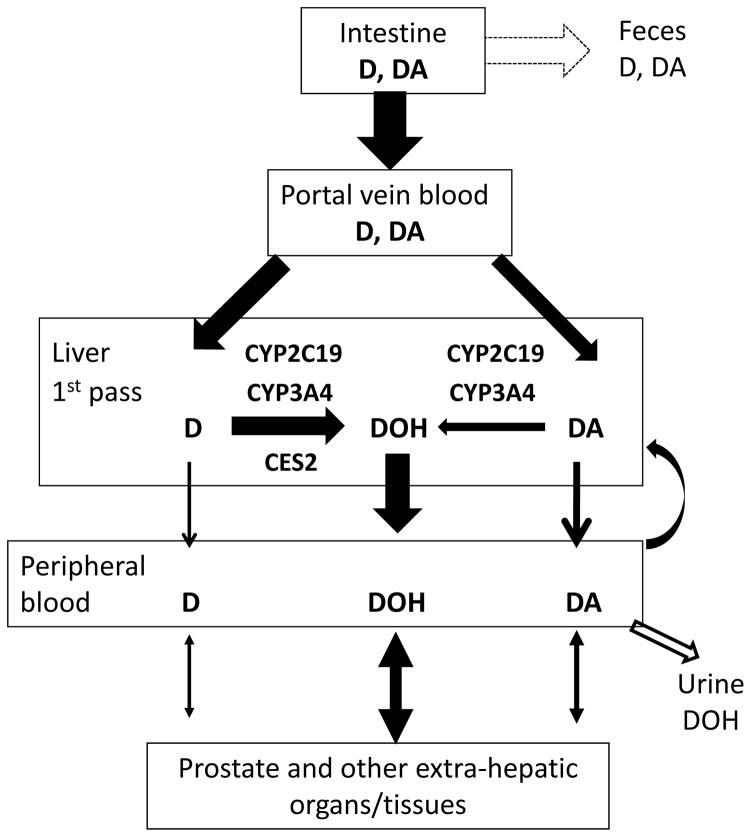
Following up on our previous work (Li et al., 2012; Li et al., 2013a; Li et al., 2013b) and others (Park et al., 2012), we took an integrative approach in the present study to provide novel biochemical and pharmacological insights into the role of CYP in D and DA metabolism and their prostate tissue deposition. Our data, in aggregate, suggest that CYP 2C19 and 3A4 isoforms might play an important role in the first pass liver metabolism of DA and, to a lesser extent, of D in humans, due to the involvement of CES2 in hydrolysis of D to DOH (See Fig. 7 for schematic illustration). The conclusion was supported by our in vitro experiments which showed that recombinant human 2C19 protein metabolized D and DA much more efficiently than other CYP isoforms (Table 1) and Fig. 1. The less dependence of D conversion to DOH on CYP than DA was due to hydrolysis of D by CES2 (Table 1). Data from the CYP inhibitor studies with HLM in the presence of GAPDH redox cycling (Fig. 2, 3) identified mechanistic subtleties with respect to CYP2C19 vs. CYP3A4, but nevertheless, supported their major contributions to the conversion of DA and D to DOH via side-chain hydroxylated intermediate metabolites (Li et al., 2013a). In our human PK study, in spite of small number of subjects, CYP2C19 SNP EM genotype was associated with lower DA AUC0–48h, and vice versa, SNP PM genotype with higher DA AUC0–48h (Fig. 5). Urinary excretion of free DOH accounted for <1% of D/DA ingested in our human subjects (Zhang et al., 2015). The human bioavailability of oral D/DA dietary supplement is at present not known (i.e., fecal D/DA excretion proportion uncertain in Fig. 7). Song and colleagues showed absorption of DOH itself in rats of ~ 45% from comparing AUC-oral dose vs. AUC-i.v. (Song et al., 2011). Our mouse study comparing gavage vs. i.p. injection of D/DA showed much inferior plasma level of D/DA and DOH for the oral route compared to i.p. (~10–15%) (Li et al., 2012). In the rats, when equal moles of D/DA or DOH were given by oral gavage, we found DOH led to a faster attainment of plasma DOH peak (tmax ~ 0.7 h) and much higher peak levels than an equal molar amount administered as D/DA mixture, resulting in ~2.4 fold higher AUC (65012 vs. 27033 h.ng/mL for DOH and D/DA groups, respectively) (Li et al., 2013b). Therefore, the true magnitude of the urinary route for eliminating D/DA-derived DOH from systemic circulation may be higher.
Figure 7.
Schematic illustration of involvement of CYP and CES isoforms in human liver first pass metabolism of D and DA and likely tissue deposition and fates of D, DA and DOH.
The mouse extra-hepatic tissue D, DA and DOH deposition patterns (kidney, lung, prostate, brain, adipose) suggest plasma concentration-driven uptake into and diffusion from these tissues (data not shown). When CYP inhibitor drug ABT was used prior to D/DA oral administration (Fig. 6), dramatic increases of plasma and prostate D and DA at 1 and 2 h post-dosing brought these parent compounds to levels that could be therapeutically meaningful as we have documented the androgen receptor suppression as well as cancer cell cycle arrest actions of D and DA in the single micromolar range (Jiang et al., 2006; Guo et al., 2007). Whereas DOH was expected to be lowered in blood and prostate with inhibiting CYP, we observed instead 1.5–2 fold increase (Fig. 6c). One possible reason could be more D was hydrolyzed to DOH by CES2 when ABT blocked the CYP-mediated conversion of D to other metabolites (Fig. 2b vs. a). It might also result from an ABT-induced enhancement of overall absorption of D and DA from the gastrointestinal tract since ABT could delay gastric emptying in rodents (Stringer et al., 2014), affording more systemic D and DA for conversion to DOH. These possibilities are presently under investigation. Nonetheless, the CYP inhibitor experiment in mouse provided proof of concept for the crucial in vivo role of CYP in D and DA metabolism applicable to humans.
In summary, data presented here from human and mouse models support involvement of 2C19 and 3A4 CYP isoforms in first pass liver D/DA metabolism to DOH and possible interactions of AGN dietary supplements with CYP inhibitor drugs. Pharmacokinetic effects associated with 2C19 genotype have been reported for many marketed drugs such as omeprazole, citalopram, voriconazole, clopidogrel, imipramine and others. In addition, 3A4 plays a major role in the metabolism of clinically used drugs from almost all therapeutic categories. Therefore, pharmacogenetics with respect to these CYP genotypes and interactions among CYP inhibitor drugs and D/DA metabolism should be considered in designing future translation studies of DA, D or AGN dietary supplements.
Acknowledgments
This work was supported, in parts, by National Center for Complementary and Integrative Health (NCCIH/NCCAM) R01 grant AT007395 and TTUHSC School of Pharmacy start-up fund (J. L.), and Laura W. Bush Institute for Women’s Health seed grant (J. Z.). The authors thank School of Pharmacy Faculty member Dr. Reza Mehvar for helpful discussions, Ms. Kito Barrow and Ms. Vi Bui for technical assistance and Michael Melkus, PhD, for help with editing the English text.
Footnotes
Disclosure of Potential Conflicts of Interest: All authors have no personal or financial conflict of interest and have not entered into any agreement that could interfere with our access to the data on the research or on our ability to analyze the data independently, to prepare articles, and to publish them.
References
- Balani SK, Li P, Nguyen J, Cardoza K, Zeng H, Mu DX, Wu JT, Gan LS, Lee FW. Effective dosing regimen of 1-aminobenzotriazole for inhibition of antipyrine clearance in guinea pigs and mice using serial sampling. Drug metabolism and disposition: the biological fate of chemicals. 2004;32:1092–1095. doi: 10.1124/dmd.104.000349. [DOI] [PubMed] [Google Scholar]
- Busby WF, Jr, Ackermann JM, Crespi CL. Effect of methanol, ethanol, dimethyl sulfoxide, and acetonitrile on in vitro activities of cDNA-expressed human cytochromes P-450. Drug metabolism and disposition: the biological fate of chemicals. 1999;27:246–249. [PubMed] [Google Scholar]
- Cai X, Wang RW, Edom RW, Evans DC, Shou M, Rodrigues AD, Liu W, Dean DC, Baillie TA. Validation of (−)-N-3-benzyl-phenobarbital as a selective inhibitor of CYP2C19 in human liver microsomes. Drug metabolism and disposition: the biological fate of chemicals. 2004;32:584–586. doi: 10.1124/dmd.32.6.584. [DOI] [PubMed] [Google Scholar]
- Chauret N, Gauthier A, Nicoll-Griffith DA. Effect of common organic solvents on in vitro cytochrome P450-mediated metabolic activities in human liver microsomes. Drug metabolism and disposition: the biological fate of chemicals. 1998;26:1–4. [PubMed] [Google Scholar]
- Daneshmend TK, Warnock DW. Clinical pharmacokinetics of ketoconazole. Clinical pharmacokinetics. 1988;14:13–34. doi: 10.2165/00003088-198814010-00002. [DOI] [PubMed] [Google Scholar]
- Guo J, Jiang C, Wang Z, Lee HJ, Hu H, Malewicz B, Lee JH, Baek NI, Jeong JH, Kim DK, Kang KS, Kim SH, Lu J. A novel class of pyranocoumarin anti-androgen receptor signaling compounds. Molecular cancer therapeutics. 2007;6:907–917. doi: 10.1158/1535-7163.MCT-06-0231. [DOI] [PubMed] [Google Scholar]
- Jiang C, Lee HJ, Li GX, Guo J, Malewicz B, Zhao Y, Lee EO, Lee JH, Kim MS, Kim SH, Lu J. Potent antiandrogen and androgen receptor activities of an Angelica gigas-containing herbal formulation: identification of decursin as a novel and active compound with implications for prevention and treatment of prostate cancer. Cancer research. 2006;66:453–463. doi: 10.1158/0008-5472.CAN-05-1865. [DOI] [PubMed] [Google Scholar]
- Kazui M, Nishiya Y, Ishizuka T, Hagihara K, Farid NA, Okazaki O, Ikeda T, Kurihara A. Identification of the human cytochrome P450 enzymes involved in the two oxidative steps in the bioactivation of clopidogrel to its pharmacologically active metabolite. Drug metabolism and disposition: the biological fate of chemicals. 2010;38:92–99. doi: 10.1124/dmd.109.029132. [DOI] [PubMed] [Google Scholar]
- Khojasteh SC, Prabhu S, Kenny JR, Halladay JS, Lu AY. Chemical inhibitors of cytochrome P450 isoforms in human liver microsomes: a re-evaluation of P450 isoform selectivity. European journal of drug metabolism and pharmacokinetics. 2011;36:1–16. doi: 10.1007/s13318-011-0024-2. [DOI] [PubMed] [Google Scholar]
- Li-Wan-Po A, Girard T, Farndon P, Cooley C, Lithgow J. Pharmacogenetics of CYP2C19: functional and clinical implications of a new variant CYP2C19*17. British journal of clinical pharmacology. 2010;69:222–230. doi: 10.1111/j.1365-2125.2009.03578.x. [DOI] [PMC free article] [PubMed] [Google Scholar]
- Li L, Zhang J, Shaik AA, Zhang Y, Wang L, Xing C, Kim SH, Lu J. Quantitative Determination of Decursin, Decursinol Angelate, and Decursinol in Mouse Plasma and Tumor Tissue Using Liquid-Liquid Extraction and HPLC. Planta medica. 2012;78:252–259. doi: 10.1055/s-0031-1280384. [DOI] [PubMed] [Google Scholar]
- Li L, Zhang J, Xing C, Kim SH, Jiang C, Lu J. In Vitro Metabolism of Pyranocoumarin Isomers Decursin and Decursinol Angelate by Liver Microsomes from Man and Rodents. Planta medica. 2013a;79:1536–1544. doi: 10.1055/s-0033-1350796. [DOI] [PMC free article] [PubMed] [Google Scholar]
- Li L, Zhang J, Xing C, Kim SH, Lu J. Single Oral Dose Pharmacokinetics of Decursin, Decursinol Angelate, and Decursinol in Rats. Planta medica. 2013b;79:275–280. doi: 10.1055/s-0032-1328202. [DOI] [PubMed] [Google Scholar]
- Linder CD, Renaud NA, Hutzler JM. Is 1-aminobenzotriazole an appropriate in vitro tool as a nonspecific cytochrome P450 inactivator? Drug metabolism and disposition: the biological fate of chemicals. 2009;37:10–13. doi: 10.1124/dmd.108.024075. [DOI] [PubMed] [Google Scholar]
- Mizutani T. PM frequencies of major CYPs in Asians and Caucasians. Drug metabolism reviews. 2003;35:99–106. doi: 10.1081/dmr-120023681. [DOI] [PubMed] [Google Scholar]
- Nasu K, Kubota T, Ishizaki T. Genetic analysis of CYP2C9 polymorphism in a Japanese population. Pharmacogenetics. 1997;7:405–409. doi: 10.1097/00008571-199710000-00011. [DOI] [PubMed] [Google Scholar]
- Park HS, Kim B, Oh JH, Kim YC, Lee YJ. First-pass Metabolism of Decursin, a Bioactive Compound of Angelica gigas, in Rats. Planta medica. 2012;78:909–913. doi: 10.1055/s-0031-1298517. [DOI] [PubMed] [Google Scholar]
- Schenk PW, van Vliet M, Mathot RA, van Gelder T, Vulto AG, van Fessem MA, Verploegh-Van Rij S, Lindemans J, Bruijn JA, van Schaik RH. The CYP2C19*17 genotype is associated with lower imipramine plasma concentrations in a large group of depressed patients. The pharmacogenomics journal. 2010;10:219–225. doi: 10.1038/tpj.2009.50. [DOI] [PubMed] [Google Scholar]
- Song JS, Chae JW, Lee KR, Lee BH, Choi EJ, Ahn SH, Kwon KI, Bae MA. Pharmacokinetic characterization of decursinol derived from Angelica gigas Nakai in rats. Xenobiotica. 2011;41:895–902. doi: 10.3109/00498254.2011.587551. [DOI] [PubMed] [Google Scholar]
- Stringer RA, Weber E, Tigani B, Lavan P, Medhurst S, Sohal B. 1-Aminobenzotriazole modulates oral drug pharmacokinetics through cytochrome P450 inhibition and delay of gastric emptying in rats. Drug metabolism and disposition: the biological fate of chemicals. 2014;42:1117–1124. doi: 10.1124/dmd.113.056408. [DOI] [PubMed] [Google Scholar]
- Zanger UM, Schwab M. Cytochrome P450 enzymes in drug metabolism: regulation of gene expression, enzyme activities, and impact of genetic variation. Pharmacology & therapeutics. 2013;138:103–141. doi: 10.1016/j.pharmthera.2012.12.007. [DOI] [PubMed] [Google Scholar]
- Zhang D, Ly VT, Lago M, Tian Y, Gan J, Humphreys WG, Comezoglu SN. CYP3A4-mediated ester cleavage as the major metabolic pathway of the oral taxane 3′-tert-butyl-3′-N-tert-butyloxycarbonyl-4-deacetyl-3′-dephenyl-3′-N-debenzoyl-4- O-methoxycarbonyl-paclitaxel (BMS-275183) Drug metabolism and disposition: the biological fate of chemicals. 2009;37:710–718. doi: 10.1124/dmd.108.024398. [DOI] [PubMed] [Google Scholar]
- Zhang D, Wang L, Chandrasena G, Ma L, Zhu M, Zhang H, Davis CD, Humphreys WG. Involvement of multiple cytochrome P450 and UDP-glucuronosyltransferase enzymes in the in vitro metabolism of muraglitazar. Drug metabolism and disposition: the biological fate of chemicals. 2007;35:139–149. doi: 10.1124/dmd.106.011932. [DOI] [PubMed] [Google Scholar]
- Zhang J, Li L, Hale T, Chee W, Xing C, Jiang C, Lü J. Single oral dose pharmacokinetics of decursin and decursinol angelate in healthy adult men and women. PLOS One. 2015 doi: 10.1371/journal.pone.0114992. In press. [DOI] [PMC free article] [PubMed] [Google Scholar]
- Zhang J, Li L, Jiang C, Xing C, Kim SH, Lu J. Anti-cancer and Other Bioactivities of Korean Angelica gigas Nakai (AGN) and Its Major Pyranocoumarin Compounds. Anti-cancer agents in medicinal chemistry. 2012;12:1239–1254. doi: 10.2174/187152012803833071. [DOI] [PubMed] [Google Scholar]
- Zhang J, Wang L, Zhang Y, Li L, Tang S, Xing C, Kim SH, Jiang C, Lu J. Chemopreventive effect of Korean Angelica root extract on TRAMP carcinogenesis and integrative “omic” profiling of affected neuroendocrine carcinomas. Molecular carcinogenesis. 2014 doi: 10.1002/mc.22230. [DOI] [PMC free article] [PubMed] [Google Scholar]


