Abstract
Background:
Virtual microscopy and automated processing of cytological slides are more challenging compared to histological slides. Since cytological slides exhibit a three-dimensional surface and the required microscope objectives with high resolution have a low depth of field, these cannot capture all objects of a single field of view in focus. One solution would be to scan multiple focal planes; however, the increase in processing time and storage requirements are often prohibitive for clinical routine.
Materials and Methods:
In this paper, we show that it is a reasonable trade-off to scan a single focal plane and automatically reject defocused objects from the analysis. To this end, we have developed machine learning solutions for the automated identification of defocused objects. Our approach includes creating novel features, systematically optimizing their parameters, selecting adequate classifier algorithms, and identifying the correct decision boundary between focused and defocused objects. We validated our approach for computer-assisted DNA image cytometry.
Results and Conclusions:
We reach an overall sensitivity of 96.08% and a specificity of 99.63% for identifying defocused objects. Applied on ninety cytological slides, the developed classifiers automatically removed 2.50% of the objects acquired during scanning, which otherwise would have interfered the examination. Even if not all objects are acquired in focus, computer-assisted DNA image cytometry still identified more diagnostically or prognostically relevant objects compared to manual DNA image cytometry. At the same time, the workload for the expert is reduced dramatically.
Keywords: Autofocus, cytology, DNA image cytometry, machine learning, virtual microscopy
INTRODUCTION
Computer-assisted image processing of cytological slides can reduce the workload for pathological experts by automating time-consuming steps, and furthermore allows extracting quantitative and therefore reliable biomarkers. As an example, DNA image cytometry exploits, as a biomarker for cancer, the DNA content of morphologically abnormal nuclei measured from digital images. A diagnosis or prognosis is then derived based on the DNA distribution of these nuclei (DNA ploidy analysis).[1] Applications of DNA image cytometry are the identification of cancer cells, the assessment of microscopically suspicious cases in case conventional cytology cannot assign a definite diagnosis (dysplasias and borderline lesions), and grading the malignancy of tumors. Due to its quantitative nature and the fact that the DNA distribution for diagnosis is exclusively derived from nuclei with visual abnormalities, in most cases DNA image cytometry has a higher diagnostic accuracy or prognostic validity compared to conventional cytology.[2,3] A major limitation of this technique, however, was the high interaction time of more than 40 min needed for analyzing one slide manually. This time could be lowered dramatically by applying a virtual microscope for automatically scanning and machine learning solutions for identifying abnormal nuclei.[4,5,6] The task of the expert is then reduced to the verification of objects with very high DNA content (exceeding events) since for these objects one misclassification can already change the diagnosis.
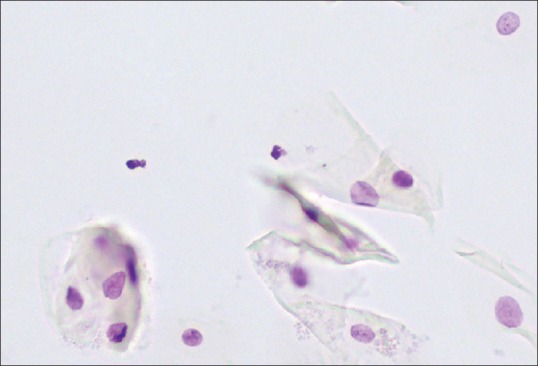
An essential step is the automated digitization of slides. This task, however, is more challenging for cytological slides than for histological ones. Whereas for histology, most of the tissue slices are commonly cut at a thickness between 4 and 6 μm, cytological slides may contain relevant cells within a range of 30 μm.[7] As a high resolution is required for the cytological analysis, the corresponding objectives have a high numerical aperture and a low depth of field.[8] Consequently, it is not possible to acquire all objects in focus by a single focal plane [Figure 1]. As a consequence, defocused objects are included in the analysis.[4]
Figure 1.

Optimally focused scene of an oral smear, as determined by the autofocus procedure. Still, some objects are out of focus
One option to overcome this drawback would be to scan and process multiple focal planes, that is, for each field of view a stack of images is acquired where the z-distance between slide and objective is varied.[9] The drawback of this approach is that every additional focal plane increases the scanning time and file size for the digital slide.[10] The file size can be reduced by merging the multiple planes to a single one, using image information from the most focused plane (extended focus). However, images created this way suffer from a significant degradation in sharpness, and the assessment of important nuclear structures becomes very difficult.[7]
Even if single focal plane scanning cannot acquire images of all objects in focus, this will be the case for almost all of them. Considering the aforementioned disadvantages of multiple focal plane scanning, it is reasonable to examine if single focal plane scanning is still sufficient for a correct clinical outcome. In this case, a few objects will be acquired out of focus. Since neither the correct cell type nor the correct DNA content of defocused objects can be determined, these objects need to be removed from the analysis. In this paper, we present machine learning algorithms for automatically performing this task. We demonstrate that computer-assisted DNA image cytometry where the nuclei have been acquired from a single focal plane, still identifies more cancer-cell positive cases and higher grades of malignancy than manual DNA image cytometry.
MATERIALS AND METHODS
Materials
The specimens employed in this work originate from fine-needle aspirates of serous effusions, oral brush biopsies, or from core-needle biopsies of prostate cancers. The effusion slides were prepared by smearing effusion sediments on the glass slide and air-drying. For the oral slides, cells from brush biopsies were prepared by liquid-based cytology, using alcohol as fixative. The biopsies from prostate-cancers were disintegrated by enzymatic cell separation, centrifuged and deposited on a slide. Subsequently, the slides were stained stochiometrically for DNA according to Feulgen. The different fixation and preparation techniques lead to a different visual appearance of nuclei; therefore, for each type of specimen, individual solutions are required.
We collected three different labeled sets of nuclei for each type of specimen: A gold standard for training machine learning algorithms, a validation set for the optimization of parameters, and another independent test set for the final evaluation of the detection performance. For collection the gold standard, we used a Motic BA600 microscope equipped with ×40 objective (NA = 0.65) and employed the following acquisition protocol. First, an image of a nucleus in focus was acquired. Subsequently, the microscope objective was moved in z-direction in steps of 10 μm, acquiring five further images of this nucleus. By doing so, a focused image and defocused images of the same nucleus at several defocus levels are available. Subsequently, we acquired further validation and test sets by automatically scanning areas of about 0.5 cm × 0.5 cm using the same microscope. To enrich the set with defocused objects, one-third of the focus points were set out of focus by purpose. After acquisition, we manually classified the acquired nuclei into the classes “defocused” and “focused.” Table 1 shows the number of nuclei for each set and type of specimen.
Table 1.
Number of nuclei in the gold standard, validation and test sets

Additional ninety slides, thirty for each type of specimen, were prepared for comparing the performance of manual and computer-assisted DNA image cytometry based on single focal planes.
Methods
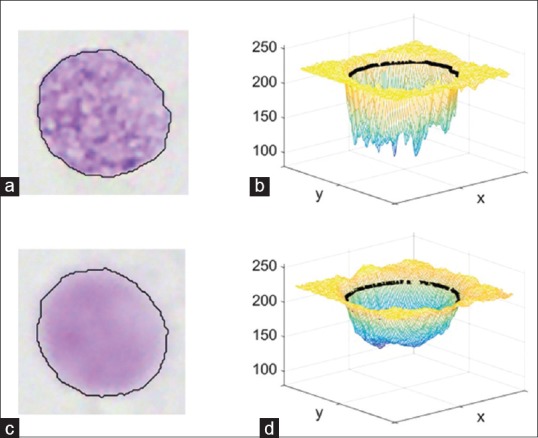
An object which is out of focus is a low pass filtered version of the original object.[11] Figure 2 displays a focused nucleus and its defocused counterpart, as well as three-dimensional intensity plots of the grey images of these nuclei. By visually analyzing these kinds of images, we made the following observations for distinguishing focused and defocused objects:
Figure 2.

Focused and defocused images of the same nucleus (a and c), as well as plots of their gray images (b and d). The black line is the contour found by the segmentation algorithm
Defocused objects have higher intensity values at the boundary of the object
Defocused objects have less variation in the derivatives of pixel intensities
The transition from background to nucleus perpendicular to the nucleus contour is less steep for defocused objects.
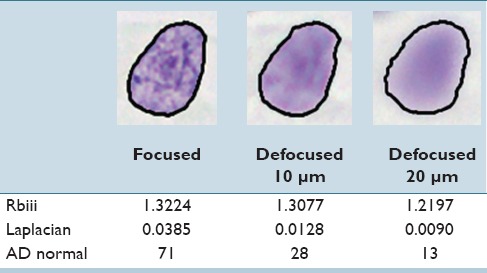
Based on this analysis, we developed three features for quantifying these observations. All features are based on a grey image computed as a weighted combination of the RGB channels (R = 0.299, G = 0.587, B = 0.114). To quantify observation (1), we first define an interior region I of the original segmentation mask S by shrinking down S by iteratively applying morphological erosion until the area is below a percentage P of the original size. The feature value is then computed as the fraction between the mean intensities in S/I and I (feature Rbiii). As for observation (2), we use the mean absolute filter response of a Laplacian filter for measuring the variation in the derivatives within the pixel intensities of the object (feature Laplacian). For defocused objects, it is possible that the segmentation of the nucleus is slightly too small [Figure 2]. Therefore, the segmentation mask S is enlarged up to a percentage P by morphological dilation before computing the feature value. For quantifying the transition from object to background, observation (3), we compute absolute difference of grey values of neighboring pixels along the objects contour normal. We examined different lengths l for the normal vector. The final value of the feature AD normal is the p% quantile of all difference values. Table 2 shows how the values of these features change when an object is moved out of focus.
Table 2.
Change of feature values when acquiring a nucleus in focus or out of focus

All three features have parameters which should be chosen such that they maximize the discriminance of the feature values between focused and defocused objects. We identified these parameters by an exhaustive parameter search on the gold standard dataset, employing the area under curve (AUC) as a separability criterion.[12] For every individual feature, the parameters which yielded the highest AUC are chosen for computing the feature values.
Next, we identified the optimal decision boundary between focused and defocused objects. To this end, we first determined, individually for each type of specimen, the appropriate z-distance from the plane of optimal focus at which an object can be considered as defocused. For every object in the gold standard, several images at increasing defocus levels are available. If the less defocused objects are excluded from the gold standard, this effectively shifts the decision boundary between focused and defocused objects toward more defocused objects and, therefore, decreases the sensitivity for the detection of defocused objects. We tested six different gold standard sets, containing objects with the following z-distances to the plane of optimal focus: 10–50 μm, 20–50 μm, 30–50 μm, 40–50 μm, and 50 μm. At the same time, we examined six different classifiers algorithms (Support Vector Machine, Decision Tree, Random Forest, Neural Network, Adaboost, and k Nearest Neighbor classifier) with a broad range of parameters. Both the tuning of the sensitivity and the choice of the classifier were performed on the validation sets. Classifying a focused nucleus as “defocused” than vice versa, as it might, in the worst case, leads to a false diagnosis. Therefore, we employed a weighted error rate as optimization criterion, for which misclassifying a focused object as defocused is rated with 5 times higher cost than classifying a defocused object as focused. Then, the gold standard and classifier algorithm with the lowest weighted error rate were chosen for training the final classifier and used to classify the test set.
Finally, we evaluated the performance of the developed machine learning solution for identifying defocused objects within the overall system for automated DNA image cytometry and tested the hypothesis that scanning of single focal planes is sufficient for a reliable diagnosis or prognosis. After automated scanning and a segmentation of objects, the defocus classifiers presented in this paper and the nucleus classifiers presented in[4,5,6] were applied in a two-stage classifier cascade. In the first stage, we use the defocus classifier to decide whether an object is focused. Only the focused objects were then handed to the nucleus classifier. The reason for this is that focused and defocused objects mainly differ by texture, whereupon nuclei from different classes mainly differ by morphology. After classification, a pathological expert verified all objects above the exceeding event threshold, and assigned a diagnosis (effusions and oral) or a grading of the malignancy (prostate cancer) based on the existence of DNA-stemlines with abnormal DNA content (DNA-aneuploid stemlines) in the DNA distribution of abnormal nuclei or nuclei with high DNA content (DNA-exceeding events). We compared the diagnoses or grades of automated DNA image cytometry to those of manually processed slides.
RESULTS
Exemplarily, Table 3 shows the results of the optimization of the parameters of the features on the nuclei derived from serous effusions; we found similar parameters for the other two types of specimens. For computing the relationship between boundary and interior intensity, the boundary region is a very thin ring around the contour, the boundary regions account for 5% of the original segmentation mask and the interior region 95%. For the Laplacian feature, it is beneficial to extend the original segmentation mask (+20% added to the original size). The feature AD normal discriminates best if the normal length is 0.18 μm, and the maximum of all absolute pixel differences is used as final feature values.
Table 3.
Results from the parameter optimization of the features for defocus classifier for effusions

As for the identification of the decision boundary from which on an object can be considered as defocused, for nuclei originating from prostate, the optimization selected all objects with a distance of 10–50 μm and more from the plane of focus. For oral and effusions, this distance is slightly higher, starting from 20 μm. From the classifiers algorithms tested, the Support Vector Machine yielded the lowest error rates for all types of specimen.
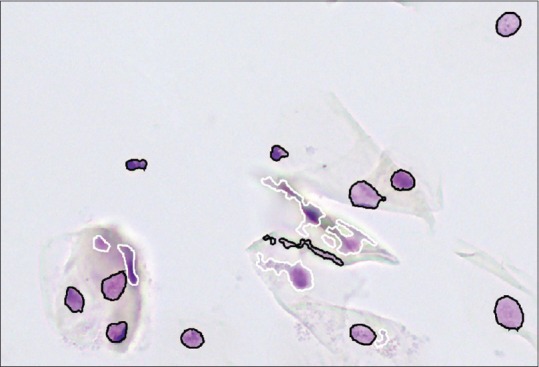
Table 4 shows the application of the optimized classifiers on the data from the test set. The nuclei are classified with correct classification rates of 98.17% (effusions), 99.41% (prostate) and 97.71% (oral). Exemplarily, Figure 3 shows the classification result of the defocus classifier for nuclei originating from brush biopsies of the oral cavity.
Table 4.
Application of the optimized classifiers on the data from the test set

Figure 3.

Field of view from Figure 1, where the nuclei classified as focused have a black contour and the contour of defocused objects is white
From the ninety cases scanned, the diagnoses or grades of malignancy between manual and automated DNA image cytometry coincide for 85 cases. For two cases originating from effusions, for one case from oral and two cases from prostate computer-assisted DNA image cytometry identified suspicious or cancerous nuclei which lead to the diagnosis cancer-cell positive or a higher grade of malignancy. These nuclei which led to a different result were verified by an experienced cytopathologist (A.B.); therefore, we consider these diagnoses or grades as the correct ones. Computer-assisted DNA image cytometry identified in total 978 DNA-exceeding events and 31 diagnostically or prognostically relevant DNA-stemlines, which is considerably higher than the 239 DNA-exceeding events and 29 relevant stemlines identified by manual DNA image cytometry. During the automated scanning, on the average, the system collected 19.418 objects per case and automatically rejected 486 objects (2.50%) because they were classified as defocused.
DISCUSSION AND CONCLUSIONS
In this paper, we demonstrated that for the computer-assisted processing of cytological slides prepared for DNA image cytometry, it is a reasonable trade-off is to scan a single focal plane and automatically reject defocused objects from the analysis. In fact, if restricted to a single focal plane, computer-assisted DNA image cytometry still identified more cancer-cell positive cases and higher grades of malignancy than manual DNA image cytometry. The reason for this is that the machine learning solutions were trained and optimized to reliably identify relevant nuclei based on the quantification of their morphology, but opposed to a human operator do not suffer from fatigue and thus miss less objects. At the same time, the workload for the expert is reduced from manually scanning a slide and visually identifying relevant nuclei to the verification of a few objects with exceeding DNA content – a task which is usually accomplished within 5 min.
In case the scanning is limited to a single focal plane, a few objects are acquired out of focus. If these objects are not identified, they would occur among clinically relevant nucleus classes. Therefore, we have developed classifiers for the automated detection of defocused objects. Across all three types of specimen examined, they achieve a sensitivity of 96.08% and a specificity of 99.63% for the detection of defocused objects. Key factors for reaching such a high detection performance are the development of novel features, the identification of the correct decision boundary between focused and defocused objects, and the systematic optimization of classifier algorithms and their parameters.
Financial Support and Sponsorship
Parts of this work have been funded by Motic Asia, Hong Kong, Windsor House 311 Gloucester Road Causeway Bay.
Conflicts of Interest
Prof. A. Böcking has signed a contract with Motic concerning marketing of the MotiCyte device.
Footnotes
Available FREE in open access from: http://www.jpathinformatics.org/text.asp?2016/7/1/21/181765
REFERENCES
- 1.Haroske G, Baak JP, Danielsen H, Giroud F, Gschwendtner A, Oberholzer M, et al. Fourth updated ESACP consensus report on diagnostic DNA image cytometry. Anal Cell Pathol. 2001;23:89–95. doi: 10.1155/2001/657642. [DOI] [PMC free article] [PubMed] [Google Scholar]
- 2.Remmerbach TW, Mathes SN, Weidenbach H, Hemprich A, Böcking A. Noninvasive brush biopsy as an innovative tool for early detection of oral carcinomas. Mund Kiefer Gesichtschir. 2004;8:229–36. doi: 10.1007/s10006-004-0542-z. [DOI] [PubMed] [Google Scholar]
- 3.Motherby H, Pomjanski N, Kube M, Boros A, Heiden T, Tribukait B, et al. Diagnostic DNA-flow- vs. -image-cytometry in effusion cytology. Anal Cell Pathol. 2002;24:5–15. doi: 10.1155/2002/840210. [DOI] [PMC free article] [PubMed] [Google Scholar]
- 4.Friedrich D, Chen J, Zhang Y, Demin C, Yuan L, Berynskyy L, et al. Berlin, Germany Springer Berlin Heidelberg: 2012. Identification of Prostate Cancer Cell Nuclei for DNA-Grading of Malignancy. Proceedings of Bildverarbeitung für die Medizin. 2012 Mar 18-20. [Google Scholar]
- 5.Friedrich D, Chen J, Zhang Y, Demin C, Yuan L, Berynskyy L, et al. Chicago, USA: 2012. A Pattern Recognition System for Identifying Cancer Cells in Serous Effusions. Proceedings of Pathology Informatics. 2012 Oct 9-12. [Google Scholar]
- 6.Böcking A, Friedrich D, Chen J, Bell A, Würflinger T, Meyer-Ebrecht D, et al. Diagnostic cytometry. In: Mehrotra R, editor. Oral Cytology – A Concise Guide. New York: Springer Science & Business Media; 2013. pp. 125–45. [Google Scholar]
- 7.Lee RE, McClintock DS, Laver NM, Yagi Y. Evaluation and optimization for liquid-based preparation cytology in whole slide imaging. J Pathol Inform. 2011;2:46. doi: 10.4103/2153-3539.86285. [DOI] [PMC free article] [PubMed] [Google Scholar]
- 8.Montalto MC, McKay RR, Filkins RJ. Autofocus methods of whole slide imaging systems and the introduction of a second-generation independent dual sensor scanning method. J Pathol Inform. 2011;2:44. doi: 10.4103/2153-3539.86282. [DOI] [PMC free article] [PubMed] [Google Scholar]
- 9.Wilbur DC. Digital cytology: Current state of the art and prospects for the future. Acta Cytol. 2011;55:227–38. doi: 10.1159/000324734. [DOI] [PubMed] [Google Scholar]
- 10.Donnelly AD, Mukherjee MS, Lyden ER, Bridge JA, Lele SM, Wright N, et al. Optimal z-axis scanning parameters for gynecologic cytology specimens. J Pathol Inform. 2013;4:38. doi: 10.4103/2153-3539.124015. [DOI] [PMC free article] [PubMed] [Google Scholar]
- 11.Darrel T, Wohn K. Ann Arbor, USA: 1988. Pyramid Based Depth from Focus. Proceedings of Computer Vision and Pattern Recognition, 1988 Jun 5-9. [Google Scholar]
- 12.Theodoridis S, Koutroumbas K. 4th ed. Orlando, USA: Academic Press; 2009. Pattern Recognition. [Google Scholar]


