

Abstract
INTRODUCTION
The current number of physicians will not be sufficient to accommodate 30–40 million Americans expected to secure health care coverage with Affordable Care Act (ACA) implementation. One proposed solution is to utilize non-physicians (nurse practitioners [NPs] and physician assistants [PAs]) for chronic disease care delivery. It is not known whether the quality of outpatient cardiology care delivered by non-physicians is comparable to that delivered by physicians.
METHODS
Within the American College of Cardiology’s outpatient PINNACLE® registry, we compared the quality of coronary artery disease (CAD), heart failure (HF), and atrial fibrillation (AF) care delivered by physicians and non-physicians for outpatients with visits between January 1 and December 31, 2012. We performed hierarchical regression with further adjustment for provider gender, number of outpatient visits, and patient’s age, gender, and insurance.
RESULTS
We included 672 providers (540 physicians and 132 non-physicians [114 NPs, 18 PAs]) in 33 practices who cared for 279,770 patients. In adjusted analyses, compliance with most CAD, HF, and AF measures was comparable between physicians and non-physicians, except for a higher rate of beta-blocker use (adjusted rate ratio [RR] 1.10, 95% CI 1.02–1.19), antiplatelet therapy use (RR 1.06, 95% CI 1.02–1.11), and cardiac rehabilitation referral (RR 1.53, 95% CI 1.18–1.98) among CAD patients receiving care from non-physicians compared with physicians. Results were consistent when comparing practices with both physicians and non-physicians (n = 33) and physician-only practices (n = 57).
CONCLUSION
A collaborative care delivery model employing both physicians and non-physicians may deliver a quality of outpatient cardiovascular care comparable to a physician-only model.
Keywords: nurse practitioners, physician assistants, physicians, chronic disease care, cardiovascular disease, performance measures
Introduction
With the implementation of the Affordable Care Act (ACA) [1], about 20 million Americans secured health care coverage between October 1, 2013 and early part of 2014 [2]. The Congressional Budget Office estimates that the number of Americans who will secure coverage as a result of the ACA implementation will likely increase to 34 million in 2016 [3]. A large number of these previously uninsured Americans will likely suffer from many chronic diseases including hypertension, diabetes, and cardiovascular disease (CVD).
The Association of American Medical Colleges estimates that the United States will be short 45,000 primary care physicians and 45,000 specialists by 2020 and that combined total of 90,000 will jump to more than 130,000 by 2025, with a shortage of nearly 65,000 specialist physicians [4–5]. An aging US population (especially those above age 65 years) with a high prevalence of chronic diseases will put further pressure on access to physician providers. Complicating this is the projection that nearly one-third of all physicians will retire in the next decade just as more Americans have access to health care [6].
One of the proposed ways to deal with this is to allow non-physicians (i.e. nurse practitioners [NPs] and physician assistants [PAs]) to function independently. Although this non-traditional but innovative model of health care delivery has been proposed, the contemporary clinical effectiveness of this model is not known. Prior studies comparing the clinical effectiveness of chronic disease management between NPs and physicians were mostly performed in single, academic institutions [7–14]. In addition, all of these studies were performed in primary care practices [7–14]. Therefore, the generalizability and the applicability of those findings to medical specialties like cardiology are unknown.
Our aim was to determine whether the quality of CVD care provided by non-physicians is comparable to that provided by physicians in a national sample of cardiology practices. As a secondary aim, we also determined whether there are any differences in the quality of care provided by practices employing both physicians and non-physicians compared with physician-only practices.
Methods
Cohort Development
We utilized the American College of Cardiology (ACC)’s PINNACLE (Practice Innovation and Clinical Excellence) Registry® for the current study. PINNACLE® is the first, prospective U.S. based outpatient cardiac quality improvement registry with voluntary participation from both academic and non-academic cardiology practices throughout the United States [15–17]. Participation in this initiative is voluntary with patient data collected at the point of care for a variety of cardiovascular conditions, including coronary artery disease (CAD), heart failure (HF), and atrial fibrillation (AF). Data for each ACC, American Heart Association (AHA), and American Medical Association-Physician Consortium for Performance Improvement (PCPI) performance measures for CAD, HF, and non-valvular AF were collected either in paper or electronic format [18–20]. Quality control was ensured by the use of a standard data collection tool with written definitions, uniform data entry and transmission requirements, and data quality checks [17, 21].
Study Population (Figure 1)
Figure 1. Flow diagram of study participants and exclusions.
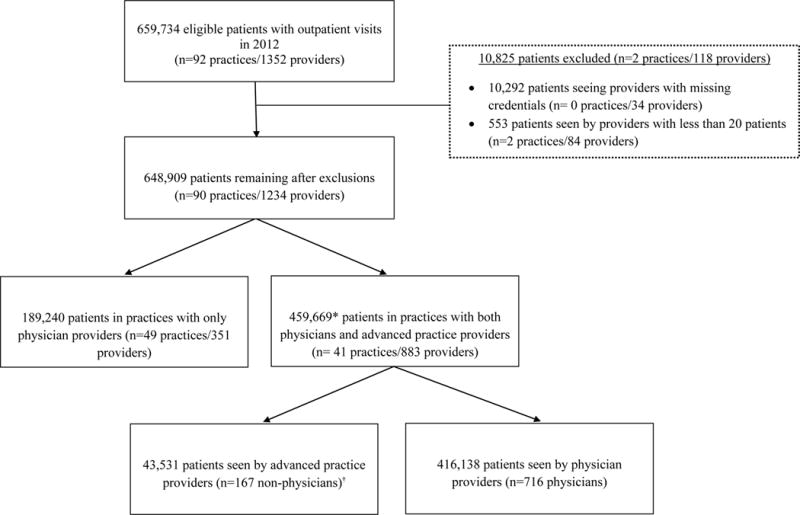
*n for primary analyses, †advanced practice providers comprised of 141 nurse practitioners and 26 physician assistants
For the purpose of current analyses, we evaluated CAD, HF, or AF patients enrolled in the PINNACLE registry with an outpatient cardiology clinic visit between January 1 2012 and December 31, 2012 among 94 US practices. For each patient visit, the National Provider Identifier (NPI) number of the treating practitioner was collected at the point of care. The NPI number was searched within the National Plan and Provider Enumeration System (NPPES) database to identify the provider category (physician or non-physician) [22]. Each patient was then assigned to either a physician or a non-physician (NP or PA) provider.
We first identified 978,130 patients enrolled in the PINNACLE registry with an outpatient visit in 2012. We than excluded patients (n= 318,396) who did not have CAD, HF or AF, and 10,292 patients who saw providers with missing credentials. We further excluded 48,779 patients who saw both physician and non-physician providers, 45,691 patients who saw more than two providers, and 975 patients because they saw providers with less than 20 CAD, HF, or AF patients in the year 2012. With these exclusions, our study cohort included 553,997 patients receiving care in 90 practices with 1189 providers. Out of these, 279,770 patients were receiving care in practices with both physicians and non-physicians, whereas, 274,227 patients were receiving care in physician-only practices. Our primary analyses compared 16,057 patients receiving care from a non-physician with 263,713 patients receiving care from physicians in practices with both physicians and non-physicians. We also performed exploratory analyses comparing patients receiving care in practices with physicians and non-physicians (n = 279,770) versus patients receiving care in physician only practices (n= 274,227). It should be noted that there were no patients receiving care in practices with only non-physician providers.
Outcome and analyses
Our outcome of interest included compliance with CAD, HF, or AF measures among eligible patients as per the ACC/AHA/PCPI performance measures [18–20]. For CAD, these measures included beta-blocker use in CAD patients with prior myocardial infarction (MI), antiplatelet use, smoking cessation screening and intervention, cardiac rehabilitation referral, symptoms and activity assessment, angiotensin converting enzyme inhibitor (ACE-I) or angiotensin receptor blocker (ARB) use in CAD patients with left ventricular (LV) ejection fraction (EF) <40%, lipid lowering therapy, and blood pressure assessment. We also evaluated the proportion of CAD patients meeting all eligible measures among the above mentioned CAD performance measures. For HF, the performance measures included ACE-I/ARB use, beta-blocker use among patients with LV EF<40%, and the use of both ACE-I or ARB and beta-blocker in patients with LV EF<40%. For AF, we assessed the use of anticoagulation (warfarin, dabigatran, or rivaroxaban) in patients with non-valvular AF and CHADS2 score ≥2. For each measure, patients were excluded from the denominator for an individual performance measure if they had a documented contraindication to that particular therapy (e.g., beta-blocker use after myocardial infarction in a patient with hypotension; patient refusal to take warfarin for atrial fibrillation).
We first compared demographic and clinical characteristics of patients receiving care from physician and non-physician providers using chi-square statistic or Student’s t-test for categorical and continuous variables, respectively. In the primary analyses, we compared compliance with each of the 8 individual CAD performance measures (as well as compliance with all eligible CAD measures) between non-physician and physician providers. The unit of analysis was the individual provider. The numerator for these rates was the total number of patients seen by a provider (physician or a non-physician) that met the performance measure (at any visit over the 12-month study period) and the denominator was the total number of patients seen by a provider group eligible for that performance measure. To assess the association between provider type and performance rate, we constructed three-level (with patients nested within practitioners and practitioners nested within clinic sites) hierarchical models, adjusted for number of total outpatient visits over 1-year of follow up, and patient’s age, gender, and insurance type. Modified Poisson models were utilized to estimate rate ratio [23, 24]. For these analyses, the physician provider category was used as the referent category. The resultant rate ratios therefore can be interpreted as the rate of compliance with a performance measure among non-physician providers divided by the rate of compliance with a performance measure among physician providers, adjusted for practice characteristics, provider gender, number of outpatient visit over 1-year, and patient’s age, gender, and insurance. Similar analyses were performed for the HF measures and AF measure.
We also performed exploratory analyses comparing compliance with CAD, HF or AF measures among practices with both physicians and non-physicians (33 practices with 279,770 patients) and practices with physician-only providers (57 practices with 274,227 patients). These analyses were performed at the level of individual practice. The resultant rate ratios can be interpreted as the rate of compliance with a performance measure among practices with both physician and non-physicians divided by the rate of compliance with a performance measure among practices with physician-only providers adjusted for provider gender, number of outpatient visits, and patient’s age, gender, and insurance. All analyses were performed using SAS version 9.3 (SAS Institute, Cary, North Carolina).
Results
Our primary analyses (Figure 1) included 279,770 patients receiving care in practices with both physician and non-physician providers. Of these patients, a total of 263,713 patients were receiving care from 540 physician providers and 16,057 patients were receiving care from 132 non-physician providers (114 NPs, 18 PAs). The number of patients with CAD, HF, or AF was 251,065, 78,939, and 79,481, respectively.
Baseline characteristics of patients receiving care from physician and non-physician providers are shown in Table 1. Patients receiving care from non-physicians were slightly older, more often of female gender and African American race, and had a higher prevalence of diabetes. They were less likely to have private insurance, less likely to use tobacco and had a lower prevalence of CHADS2 score ≥2 (among AF patients) compared with patients receiving care from physician providers. Patient receiving care from non-physician providers had a slightly lower number of visits in the 12 months prior to their index visit. Although most of these differences were statistically significant given the large sample size, absolute differences were numerically small.
Table 1.
Comparison of baseline characteristics among patients who received care from physician and non-physician providers
| Characteristic | Patients seeing non-physician providers n = 16057 | Patients seeing physician providers n = 263713 | p |
|---|---|---|---|
|
| |||
| Age, mean/SD | 68.9/13.6 | 68.3/13.4 | <.0001 |
|
| |||
| Gender | |||
| Males, n (%) | 9032 (56.3) | 153219 (58.1) | <.0001 |
| Females, n (%) | 7023 (43.7) | 110482 (41.9) | |
|
| |||
| Race | |||
| Whites, n (%) | 9029 (89.9) | 175705 (92.8) | |
| Blacks, n (%) | 820 (8.2) | 10259 (5.4) | <.0001 |
| Others, n (%) | 199 (2.0) | 3432 (1.8) | |
|
| |||
| Insurance | <.0001 | ||
| No insurance, n (%) | 1009 (6.3) | 16782 (6.4) | |
| Private, n (%) | 8366 (52.1) | 145122 (55.0) | |
| Public, n (%) | 4156 (25.9) | 82505 (31.3) | |
| Unknown, n (%) | 2526 (15.7) | 19304 (7.3) | |
|
| |||
| Number of visits in 12 months prior to index visit, mean/SD | 1.4/0.9 | 1.6/1.0 | <.0001 |
|
| |||
| Tobacco use (current) | <.0001 | ||
| No, n (%) | 8752 (54.5) | 180985 (68.6) | |
| Yes, n (%) | 2519 (15.7) | 42862 (16.3) | |
| Unknown, n (%) | 4786 (29.8) | 39866 (15.1) | |
|
| |||
| Diabetes, n (%) | 5115 (31.9) | 74004 (28.1) | < 0.001 |
|
| |||
| Hypertension, n (%) | 14230 (88.6) | 233377 (88.5) | 0.629 |
|
| |||
| Low-density lipoprotein cholesterol | 88.3/35.2 | 87.3/33.9 | 0.017 |
|
| |||
| CHADS2 score ≥ 2 (among patients with atrial fibrillation) | 5137 (83.6) | 62404 (85.1) | 0.001 |
|
| |||
| NYHA | |||
| 1 | 1082 (63.2) | 17238 (65.4) | |
| 2 | 490 (28.6) | 7092 (26.9) | 0.328 |
| 3 | 127 (7.4) | 1850 (7.0) | |
| 4 | 13 (0.8) | 180 (0.7) | |
SD, standard deviation; CHADs2 score for stroke risk assessment in atrial fibrillation (congestive heart failure, hypertension, age ≥75 years, diabetes mellitus, stroke); NYHA, New York Heart Association Functional Classification of heart failure
Comparison of compliance with CAD performance measures among non-physician and physician providers is described in Table 2, along with the unadjusted and adjusted rate ratios. Numerically, the performance on most of these measures was comparable between non-physician and physician providers. In adjusted analyses, non-physician providers were more likely to meet the performance measures of beta-blocker use, antiplatelet use, and cardiac rehabilitation referral among their CAD patients compared with physician providers. Importantly, compliance with all eligible CAD measures was low for both provider categories (9.4% and 10.7% for non-physician and physician providers, respectively), which was not statistically different.
Table 2.
Comparison of compliance with coronary artery disease measures among patients receiving care from non-physician and physician providers
| Provider category |
Rate ratio (unadjusted) [Physician providers as referent category] |
Rate ratio (adjusted)# [Physician providers as referent category] |
||
|---|---|---|---|---|
| Non-physician providers n = 132 (13753 patients) | Physician providers n = 540 (237312 patients) | |||
| Beta-blocker use in CAD patients with prior MI | 77.5 ± 16.0 | 76.0 ± 14.5 | 1.03 (0.99–1.07) | 1.10 (1.02–1.19) |
| Antiplatelet use in CAD patients | 76.6 ± 14.5 | 78.1 ± 14.3 | 0.98 (0.95–1.02) | 1.06 (1.02–1.11) |
| Smoking cessation (screening and intervention) in CAD patients | 44.2 ± 40.9 | 45.3 ± 36.6 | 1.00 (0.80–1.27) | 1.07 (0.90–1.27) |
| Cardiac rehabilitation referral in CAD patients | 9.7 ± 15.4 | 6.2 ± 9.2 | 1.78 (1.29–2.45) | 1.53 (1.18–1.98) |
| Symptom and activity assessment in CAD patients | 25.9 ± 38.1 | 26.9 ± 36.6 | 1.05 (0.59–1.89) | 1.14 (0.84–1.53) |
| ACE-I/ARB in CAD patients with LV EF<40% | 72.1 ± 15.3 | 72.0 ± 11.9 | 1.00 (0.96–1.04) | 1.02 (0.99–1.06) |
| Lipid-lowering in CAD patients | 76.4 ± 14.6 | 78.3 ± 12.4 | 0.98 (0.94–1.01) | 1.03 (0.99–1.07) |
| Blood pressure assessment in CAD patients | 94.6 ± 9.9 | 97.3 ± 7.4 | 1.03 (0.99–1.07) | 0.98 (0.96–1.01) |
| All above CAD performance measures met in eligible patients | 9.4 ± 16.7 | 10.7 ± 16.8 | 0.93 (0.60–1.73) | 0.93 (0.73–1.20) |
rate ratio = rate for compliance with a performance measure among non-physician providers /rate of compliance with a performance measure among physician providers
adjusted for practice, provider gender, number of outpatient visits, and patient’s age, gender, insurance
CAD, coronary artery disease; MI, myocardial infarction; LVEF, left ventricular ejection fraction; ACE-I, angiotensin converting enzyme inhibitor; ARB, angiotensin receptor blocker
Comparison of compliance with HF and AF measures is described in Table 3. For HF, there were no differences in performance measure rates for ACE-I/ARB and beta-blocker use or both measures between non-physicians and physicians. Similarly, anticoagulant use among high-risk AF patients with CHADS2 score ≥2 (although low for both provider categories) was not different between provider type.
Table 3.
Comparison of compliance with heart failure and atrial fibrillation measures among patients receiving care from non-physician and physician providers
| Provider category |
Rate ratio* (unadjusted) [Physician providers as referent category] |
Rate ratio (adjusted)# [Physician providers as referent category] |
||
|---|---|---|---|---|
| Non-physician providers n = 132 (5037 patients) | Physician providers n = 540 (73902 patients) | |||
| ACE-I/ARB use in patients with LVEF<40% | 81.2 ± 25.1 | 79.5 ± 20.2 | 0.98 (0.89–1.07) | 1.02 (0.97–1.06) |
| Beta-blocker use in patients with LVEF<40% | 91.1 ± 17.4 | 92.2 ± 12.7 | 0.99 (0.93–1.05) | 0.98 (0.96–1.01) |
| Both HF measures performance measures met | 77.8 ± 27.2 | 76.7 ± 21.3 | 0.99 (0.92–1.08) | 1.02 (0.98–1.07) |
| Non-physician providers n = 132 (6148 patients) | Physician providers n = 540 (73333 patients) | Rate ratio* (unadjusted) [Physician providers as referent category] | Rate ratio (adjusted)# [Physician providers as referent category] | |
| Anticoagulant use in AF patients with CHADS2 score ≥2 | 55.3 ± 19.2 | 59.5 ± 16.2 | 0.89 (0.82–0.96) | 0.99 (0.93–1.06) |
rate ratio = rate for compliance with a performance measure among non-physician providers /rate of compliance with a performance measure among physician providers
adjusted for practice, provider gender, number of outpatient visits, and patient’s age, gender, insurance
ACE-I, angiotensin converting enzyme inhibitor; ARB, angiotensin receptor blocker; HF, heart failure; AF, atrial fibrillation; CHADs2 score for stroke risk assessment in atrial fibrillation (congestive heart failure, hypertension, age ≥75 years, diabetes mellitus, stroke)
We also performed exploratory analyses at the practice-level comparing practices with both physician and non-physicians with physician-only practices. These analyses showed that among patients with CAD (Table 4) or HF or AF (Table 5), there were no significant differences in compliance with performance measures among practices with both physicians and non-physicians (33 practices with 279,770 patients) compared with physician-only practices (57 practices with 274,227 patients).
Table 4.
Comparison of compliance with coronary artery disease performance measures between practices with both physician and non-physician providers and physician-only practices
| Practice category |
Rate ratio* (unadjusted) [Physician- only practices as referent category] |
Rate ratio (adjusted)# |
||
|---|---|---|---|---|
| Physician-only practices n = 57 | Practices with both physicians and non-physicians n = 33 | |||
| Beta-blocker use in CAD patients with prior MI | 77.3 ± 14.4 | 74.6 ± 10.9 | 1.00 (0.92–1.08) | 1.04 (0.95–1.13) |
| Antiplatelet use in CAD patients | 76.6 ± 17.3 | 77.4 ± 12.9 | 1.03 (0.93–1.15) | 1.05 (0.95–1.16) |
| Smoking cessation (screening and intervention) in CAD patients | 44.2 ± 34.5 | 48.8 ± 31.5 | 1.38 (0.77–2.48) | 1.37 (0.76–2.47) |
| Cardiac rehabilitation referral in CAD patients | 14.2 ± 27.6 | 7.1 ± 8.2 | 1.18 (0.45–3.10) | 1.29 (0.48–3.45) |
| Symptom and activity assessment in CAD patients | 33.9 ± 43.2 | 24.9 ± 36.4 | 0.64 (0.13–3.23) | 0.64 (0.13–3.20) |
| ACE-I/ARB in CAD patients with LV EF<40% | 72.4 ± 15.3 | 71.6 ± 12.0 | 1.005 (0.92–1.09) | 1.02 (0.94–1.11) |
| Lipid-lowering in CAD patients | 80.5 ± 12.9 | 78.0 ± 10.9 | 0.98 (0.91–1.06) | 1.00 (0.93–1.07) |
| Blood pressure assessment in CAD patients | 95.6 ± 11.3 | 97.0 ± 5.3 | 1.03 (0.96–1.10) | 1.03 (0.96–1.10) |
| All above CAD performance measures met in eligible patients | 20.4 ± 29.1 | 10.9 ± 17.8 | 0.69 (0.17–2.84) | 0.69 (0.17–2.81) |
rate ratio = rate for compliance with a performance measure among practices with both physician and non-physicians /rate of compliance with a performance measure practices with only physician providers
adjusted for provider gender, number of outpatient visits, and patient’s age, gender, insurance
CAD, coronary artery disease; MI, myocardial infarction; LVEF, left ventricular ejection fraction; ACE-I, angiotensin converting enzyme inhibitor; ARB, angiotensin receptor blocker
Table 5.
Comparison of compliance with heart failure and atrial fibrillation performance measures between practices with both physician and non-physician and physician-only practices
| Practice category |
Rate ratio* (unadjusted) [Physician only practices as referent category] |
Rate ratio (adjusted)# |
||
|---|---|---|---|---|
| Physician-only practices n = 57 | Practices with both physicians and non-physicians n = 33 | |||
| ACE-I/ARB use in patients with LVEF<40% | 79.2 ± 13.6 | 79.8 ± 11.3 | 1.03 (0.96–1.10) | 1.04 (0.97–1.10) |
| Beta-blocker use in patients with LVEF<40% | 90.7 ± 10.2 | 92.1 ± 7.6 | 1.01 (0.97–1.06) | 1.02 (0.98–1.07) |
| Both HF measures performance measures met | 75.2 ± 15.6 | 76.5 ± 13.7 | 1.04 (0.96–1.13) | 1.05 (0.97–1.14) |
| Anticoagulant use in AF patients with CHADS2 score ≥2 | 58.4 ± 19.0 | 59.2 ± 13.8 | 1.08 (0.90–1.30) | 1.12 (0.93–1.35) |
rate ratio = rate for compliance with a performance measure among practices with both physician and non-physicians /rate of compliance with a performance measure practices with only physician providers
adjusted for provider gender, number of outpatient visits, and patient’s age, gender, insurance
ACE-I, angiotensin converting enzyme inhibitor; ARB, angiotensin receptor blocker; HF, heart failure; AF, atrial fibrillation; CHADs2 score for stroke risk assessment in atrial fibrillation (congestive heart failure, hypertension, age ≥75 years, diabetes mellitus, stroke)
Discussion
In these analyses from the ACC PINNACLE® registry, several observations can be made. First, the quality of outpatient CVD care delivered by non-physicians was comparable to that of physician providers on most measures, and was even marginally better for non-physician providers on some CAD measures. Second, the quality of outpatient CVD care delivered by practices with both physicians and non-physicians was comparable to that delivered by physician-only practices. Lastly, compliance with global CAD performance measures (i.e. all eligible measures) was low for both provider categories.
Our findings indicate that a collaborative care delivery model which employs both physicians and non-physicians can provide a care quality that is at least comparable to a physician-only model. This is important as millions of Americans access care under the ACA [1, 2]. Our results show that the use of non-physician providers to improve health care access for these Americans is a viable option as far as meeting basic outpatient CVD performance metrics is concerned. It is important to note that our results do not apply to inpatient clinical settings where both complexity and dynamics of care are likely different from the outpatient setting.
Our results also have policy implications. First, there has been a debate regarding the scope of practice laws governing non-physician providers. Despite calls from the Institute of Medicine [25] and the Federal Trade Commission [26–28] to address the scope-of-practice laws (which fall under the purview of states); these laws remain restrictive. For example, only 16 states and the District of Columbia allow advanced practice NPs to independently diagnose, treat, and refer patients and prescribe medications without physician supervision. Nine states limit non-physician provider independence by not allowing them to prescribe medications, and 24 states require physician oversight of NPs at all levels (diagnosis, treatment, and medication prescription) [29]. Our results provide objective data to inform these discussions and should be reassuring that the quality of uncomplicated outpatient CVD care is comparable between non-physicians and physicians, and between practices with both non-physicians and physicians compared with physician-only practices.
Our results may have implications in terms of how ACA is implemented. The Title V of the ACA (pages 1244–1500) [1] calls for increasing the supply of the health care workforce via support from federal grants in education, training, and continuous education activities. Although Title V broadly calls for an increase in government funding for physicians, PAs, nurses, and NPs, specific allocation of funds among these various constituents is not described. Instead, the ACA calls for the creation of a National Health Care Workforce Commission to guide Congress, the President, States, and Localities by making recommendations on the appropriate use of these resources based on research evaluating effectiveness of various care models. Our results indicate that the potential return on investment of these funds for training and education of both non-physicians in addition to physicians will likely expand the network of clinicians who can meet the expected growing shortage for chronic disease care.
Our findings that only one in 10 patients with CAD met all eligible CAD measures (whether they receive care from non-physicians or physicians) is concerning and has been described in prior literature [30]. As these performance measures were created to include treatments shown to improve both cardiovascular morbidity and mortality, our results highlight a need to improve global performance on all eligible measures in patients with CAD.
Several factors should be accounted for while interpreting our study findings. These analyses only assessed one aspect of the quality of care – compliance with established performance measures for cardiac disease. It is quite possible that there could be differences between non-physicians and physicians when other domains of quality of care (e.g. safety, efficiency or patient-centeredness) are assessed. Our study assessed outpatient CVD care for patients receiving care in cardiology practices enrolled in the ACC PINNACLE® registry. These results therefore, may not apply to other cardiology or primary care practices. For some measures (e.g. aspirin therapy), over the counter use of medications not captured in the patient’s medical record could have lead to an under-ascertainment. Lastly, these analyses do not account for collaboration between physician and non-physician providers that can happen in a practice. On the other hand, this collaborative care model between non-physicians and physicians is something that would be desirable as more patients seek access to health care.
Conclusion
A collaborative care delivery model employing both physicians and non-physicians may deliver quality of outpatient CVD care comparable to a physician-only model. These results have implications for how resources are allocated for cardiovascular care delivery as more Americans access care under the ACA. Only one in 10 patients with CAD regardless of the provider type met all eligible performance measures. These results highlight a need to improve global performance on all eligible measures in CAD patients.
Acknowledgments
Funding
Dr. Chan is supported by funding (K23HL102224 and R01HL123980) from the National Heart Lung and Blood Institute.
Sources of funding: Dr. Virani is supported by a Department of Veterans Affairs Health Services Research and Development (HSR&D) Service Career Development Award (09-028), American Heart Association Beginning Grant-in-Aid, and the American Diabetes Association Clinical Science and Epidemiology award. Dr. Chan receives funding (1R01HL123980) from the NHLBI.
Footnotes
Disclosures: none
The views expressed in this article are those of the authors and do not necessarily represent the views of the Department of Veterans Affairs or the American College of Cardiology.
References
- 1.http://www.hhs.gov/healthcare/rights/law. Accessed February 12, 2015
- 2.Blumenthal D, Collins SR. Health care coverage under the Affordable Care Act—a progress report. New England Journal of Medicine. 2014;371(3):275–281. doi: 10.1056/NEJMhpr1405667. [DOI] [PubMed] [Google Scholar]
- 3.Insurance Coverage Provisions of the Affordable Care Act – CBO’s January 2015 Baseline. Washington, DC: Congressional Budget Office; Jan, 2015. http://www.cbo.gov/sites/default/files/cbofiles/attachments/43900-2015-01-ACAtables.pdf. Accessed February 17, 2015. [Google Scholar]
- 4.https://www.aamc.org/download/153160/data/physician_shortages_to_worsen_without_increases_in_residency_tr.pdf Accessed February 12, 2015
- 5.U.S. Department of Health and Human Services, Health Resources and Services Administration. Exhibit 51, Baseline FTE Supply Projects of Active Physicians, and Exhibit 52, Baseline Physician Requirements Projections. 2008 Dec; http://bhpr.hrsa.gov/healthworkforce/reports/physwfissues.pdf Accessed February 12, 2015.
- 6.Help Wanted: More US Doctors Projections Indicate America Will Face Shortage of MDs by 2020 AAMC Center for Workforce Studies. 2010 Sep 27; https://www.aamc.org/download/82874/data/helpwanted.pdf. Accessed February 17, 2015.
- 7.Lenz ER, Mundinger MO, Hopkins SC, Lin SX, Smolowitz JL. Diabetes care processes and outcomes in patients treated by nurse practitioners or physicians. Diabetes Educ. 2002 Jul-Aug;28(4):590–8. doi: 10.1177/014572170202800413. [DOI] [PubMed] [Google Scholar]
- 8.Mundinger MO, Kane RL, Lenz ER, Totten AM, Tsai WY, Cleary PD, Friedewald WT, Siu AL, Shelanski ML. Primary care outcomes in patients treated by nurse practitioners or physicians: a randomized trial. JAMA. 2000 Jan 5;283(1):59–68. doi: 10.1001/jama.283.1.59. [DOI] [PubMed] [Google Scholar]
- 9.Sox HC. Independent primary care practice by nurse practitioners. JAMA. 2000 Jan 5;283(1):106–8. doi: 10.1001/jama.283.1.106. [DOI] [PubMed] [Google Scholar]
- 10.Knudtson N. Patient satisfaction with nurse practitioner service in a rural setting. J Am Acad Nurse Pract. 2000 Oct;12(10):405–12. doi: 10.1111/j.1745-7599.2000.tb00146.x. [DOI] [PubMed] [Google Scholar]
- 11.Moody NB, Smith PL, Glenn LL. Client characteristics and practice patterns of nurse practitioners and physicians. Nurse Pract. 1999 Mar;24(3):94–96. 99–100, 102–3. [PubMed] [Google Scholar]
- 12.Aparasu RR, Hegge M. Autonomous ambulatory care by nurse practitioners and physician assistants in office-based settings. J Allied Health. 2011 Fall;30(3):153–59. [PubMed] [Google Scholar]
- 13.Hooker RS, McCaig LF. Use of physician assistants and nurse practitioners in primary care, 1995–1999. Health Aff (Millwood) 2001 Jul-Aug;20(4):231–38. doi: 10.1377/hlthaff.20.4.231. [DOI] [PubMed] [Google Scholar]
- 14.Lenz ER, Mundinger MO, Kane RL, Hopkins SC, Lin SX. Primary care outcomes in patients treated by nurse practitioners or physicians: two-year follow-up. Med Care Res Rev. 2004 Sep;61(3):332–51. doi: 10.1177/1077558704266821. [DOI] [PubMed] [Google Scholar]
- 15.Hira RS, Kennedy K, Nambi V, Jneid H, Alam M, Basra SS, Ho M, Deswal A, Ballantyne CM, Petersen LA, Virani SS. Frequency and Practice-Level Variation in Inappropriate Aspirin Use for the Primary Prevention of Cardiovascular Disease: Insights From the National Cardiovascular Disease Registry’s Practice Innovation and Clinical Excellence Registry. J Am Coll Cardiol. 2015 Jan 20;65(2):111–21. doi: 10.1016/j.jacc.2014.10.035. [DOI] [PubMed] [Google Scholar]
- 16.Chan PS, Maddox TM, Tang F, Spinler S, Spertus JA. Practice-level variation in warfarin use among outpatients with atrial fibrillation (from the NCDR PINNACLE program) Am J Cardiol. 2011 Oct 15;108(8):1136–40. doi: 10.1016/j.amjcard.2011.06.017. [DOI] [PMC free article] [PubMed] [Google Scholar]
- 17.Chan PS, Oetgen WJ, Buchanan D, Mitchell K, Fiocchi FF, Tang F, Jones PG, Breeding T, Thrutchley D, Rumsfeld JS, Spertus JA. Cardiac performance measure compliance in outpatients: the American College of Cardiology and National Cardiovascular Data Registry’s PINNACLE (Practice Innovation And Clinical Excellence) program. J Am Coll Cardiol. 2010 Jun 29;56(1):8–14. doi: 10.1016/j.jacc.2010.03.043. [DOI] [PMC free article] [PubMed] [Google Scholar]
- 18.American College of Cardiology Foundation/American Heart Association/American Medical Association–Physician Consortium for Performance Improvement. Chronic stable coronary artery disease. Chicago, IL: American Medical Association; 2005. Clinical performance measures. http://www.metcare.com/_pdf/cadmeasures.pdf. Accessed February 17, 2015. [Google Scholar]
- 19.Bonow RO, Bennett S, Casey DE, Jr, Ganiats TG, Hlatky MA, Konstam MA, Lambrew CT, Normand SL, Piña IL, Radford MJ, Smith AL, Stevenson LW, Bonow RO, Bennett SJ, Burke G, Eagle KA, Krumholz HM, Lambrew CT, Linderbaum J, Masoudi FA, Normand SL, Ritchie JL, Rumsfeld JS, Spertus JA. ACC/AHA clinical performance measures for adults with chronic heart failure: a report of the American College of Cardiology/American Heart Association Task Force on Performance Measures (Writing Committee to Develop Heart Failure Clinical Performance Measures) endorsed by the Heart Failure Society of America. J Am Coll Cardiol. 2005 Sep 20;46(6):1144–78. doi: 10.1016/j.jacc.2005.07.012. [DOI] [PubMed] [Google Scholar]
- 20.Estes NA, 3rd, Halperin JL, Calkins H, Ezekowitz MD, Gitman P, Go AS, McNamara RL, Messer JV, Ritchie JL, Romeo SJ, Waldo AL, Wyse DG, Bonow RO, DeLong E, Goff DC, Jr, Grady K, Green LA, Hiniker A, Linderbaum JA, Masoudi FA, Piña IL, Pressler S, Radford MJ, Rumsfeld JS. ACC/AHA/Physician Consortium 2008 Clinical Performance Measures for Adults with Nonvalvular Atrial Fibrillation or Atrial Flutter: a report of the American College of Cardiology/American Heart Association Task Force on Performance Measures and the Physician Consortium for Performance Improvement (Writing Committee to Develop Clinical Performance Measures for Atrial Fibrillation) Developed in Collaboration with the Heart Rhythm Society. J Am Coll Cardiol. 2008 Feb 26;51(8):865–84. doi: 10.1016/j.jacc.2008.01.006. [DOI] [PubMed] [Google Scholar]
- 21.Messenger JC, Ho KK, Young CH, Slattery LE, Draoui JC, Curtis JP, Dehmer GJ, Grover FL, Mirro MJ, Reynolds MR, Rokos IC, Spertus JA, Wang TY, Winston SA, Rumsfeld JS, Masoudi FA, NCDR Science and Quality Oversight Committee Data Quality Workgroup The National Cardiovascular Data Registry (NCDR) data quality brief: the NCDR data quality program in 2012. J Am Coll Cardiol. 2012 Oct 16;60(16):1484–8. doi: 10.1016/j.jacc.2012.07.020. [DOI] [PubMed] [Google Scholar]
- 22.National Plan and Provider Enumeration System (No date) [Online]. Available: http://https://nppes.cms.hhs.gov/NPPES/Welcome.do.
- 23.Zou G. A modified poisson regression approach to prospective studies with binary data. Am J Epidemiol. 2004;159:702–6. doi: 10.1093/aje/kwh090. [DOI] [PubMed] [Google Scholar]
- 24.Greenland S. Model-based estimation of relative risks and other epidemiologic measures in studies of common outcomes and in case-control studies. Am J Epidemiol. 2004;160:301–5. doi: 10.1093/aje/kwh221. [DOI] [PubMed] [Google Scholar]
- 25.Institute of Medicine. The future of nursing: leading change, advancing health. Washington, DC: National Academies Press; 2010. http://www.thefutureofnursing.org/IOM-Report. Accessed February 17, 2015. [PubMed] [Google Scholar]
- 26.Federal Trade Commission. Letter from DeSanti SS, Farrell J, Feinstein RA to Jeanne Kirkton, Missouri House of Representatives. 2012 Mar 27; [Google Scholar]
- 27.Letter from DeSanti SS, Farrell J, Feinstein RA to Gary Odom, Tennessee House of Representatives. 2011 Sep 28; Idem. [Google Scholar]
- 28.Letter from Gavil AI, Feinstein RA, Shelanski H to Theresa Conroy, Connecticut House of Representatives. 2013 Mar 19; Idem. [Google Scholar]
- 29.Iglehart JK. Expanding the role of advanced nurse practitioners–risks and rewards. N Engl J Med. 2013 May 16;368(20):1935–41. doi: 10.1056/NEJMhpr1301084. [DOI] [PubMed] [Google Scholar]
- 30.Bandeali SJ, Gosch K, Alam M, Kayani WT, Jneid H, Fiocchi F, Wilson JM, Chan PS, Deswal A, Maddox TM, Virani SS. Coronary Artery Disease Performance Measures and Statin Use in Patients with Recent Percutaneous Coronary Intervention or Recent Coronary Artery Bypass Grafting (From the NCDR® PINNACLE Registry) Am J Cardiol. doi: 10.1016/j.amjcard.2015.01.532. In press. [DOI] [PubMed] [Google Scholar]