Abstract
Catering the hydrogel manufacturing process toward defined viscoelastic properties for intended biomedical use is important to hydrogel scaffolding function and cell differentiation. Silk fibroin hydrogels may undergo “physical” cross-linking through β-sheet crystallization during high pressure carbon dioxide treatment, or covalent “chemical” cross-linking by genipin. We demonstrate here that time-dependent mechanical properties are tunable in silk fibroin hydrogels by altering the chronological order of genipin cross-linking with β-sheet formation. Genipin cross-linking before β-sheet formation affects gelation mechanics through increased molecular weight, affecting gel morphology, and decreasing stiffness response. Alternately, genipin cross-linking after gelation anchored amorphous regions of the protein chain, and increasing stiffness. These differences are highlighted and validated through large amplitude oscillatory strain near physiologic levels, after incorporation of material characterization at molecular and micron length scales.
Keywords: silk fibroin, genipin, high pressure carbon dioxide, large amplitude oscillatory strain, porous hydrogel
Graphical Abstract

1. INTRODUCTION
In the past 30 years, engineered tissues have been researched as permanent treatments for many disorders.1,2 Tissue engineering implants require mimicry of tissue: chemically,3,4 mechanically,4–7 and morphologically, to best aid tissue growth. Both decellularized matrix,4,8,9 and novel biomaterials have been successful in developing new tissues. Although decellularized matrices are advantageous in mimicking intended tissue, lab synthesized materials may still be a best option due to availability, storage, and cost. Hydrogels excel at mimicking tissue due to highly viscoelastic mechanical properties and nutrient transport capabilities.10–12 High porosity and hydrophilicity both aid in nutrient transport, especially peptide and protein-based drugs, through swelling and reduced adsorption, 13 leading to higher efficiencies. Due to the wide range of tissues requiring replacement, tunable hydrogels are ideal candidates for tissue engineering scaffolding.
Although mechanical replacement of tissue has long been an emphasis in implantation medicine and tissue engineering, research in the past decade has shown that the cell interaction with scaffold mechanics is equally important. Tissue and implant mechanics have been shown as characteristic features in many disease pathologies14 and as critical factors to regulate cell activity,15,16 such as stem cell fate.6,7,17 Material stiffness may affect cells through cell deformation caused by matrix strain via cell adhesion sites,6,7,15,16,18–22 where the time scale of strain loading is dependent on tissue use and location. Physiologic loading varies in frequency from static, to ~0.05 Hz in the small intestine, to ~1 Hz in the circulatory system, and to varied levels in orthopedics. The static environment, however, is most frequently used in examining cell activity,6,7,15,16 which shows cell response over extended time scales.23,24 Stiffness of viscoelastic materials across a range of time scales offers frequency-dependent response for cells. Viscoelasticity of hydrogels measured by large amplitude oscillatory strain (LAOS) determines material response in application, and provides insight into contribution of microstructure to material stiffness response.25,26 Mechanical properties of hydrogels and tissues are dependent on hierarchical material organization, ranging from molecular structures to microstructures.27,28 By characterizing material hierarchies of different length scales, we may gain more comprehensive understanding of hydrogel viscoelasticity, and thus develop new methods of tuning time-dependent properties.
Silk fibroin hydrogels are a versatile material, capable of excellent cell attachment and control of material properties. Silk fibroin derived from domesticated silk worms (Bombyx mori) is a long chain protein (~375 kDa) with Glycine, Alanine, Serine, and Tyrosine consisting of 90% of their primary structure. These form repeat units, contributing to β-sheet secondary structures with hydrophobic side groups on their surface, leading to intra- and intermolecular, close-packed crystallization structures,29–31 acting as “physical” cross-links, resulting in stable gel structures. These gels can be highly porous and exhibit excellent cell attachment and viability.12 Fibroin gelation may occur through reduction of solution pH until the molecule isoelectric point is reached, and resulting nucleation and crystallization of the protein.32 Fibroin stiffness is heavily reliant on secondary and quaternary protein structures, and the overall content of β-sheet crystals within the gel.30,31,33 The morphology of gel microstructure,27,28,34 and resulting pore connectivity,34,35 also contribute material stiffness response.
In addition to crystallization or physical cross-link through β- sheet formation, silk fibroin can be chemically cross-linked. Genipin, due to its low cytotoxicity and ease of use, is a common chemical cross-linker.36–40 It contains a bicyclic, fused ring structure of pentane and dihydropyran rings, and covalently bonds to primary amine structures,41 often forming dimer bridges during cross-linking.42,43 Primary amines are available at the protein N-terminus and 2% of fibroin amino acid side groups,44,45 allowing additional, but limited, tailoring of material by chemical cross-link formation.41 Additionally, genipin cross-linking (GCX) was shown to increase fibroin “physical” cross-linking by β-sheet crystallization in both electro-spinning,37 ultrasonication gelation,46 and film castings. 47 Genipin reactivity is proportional to its concentration, cross-linking temperature, and time,38,39,48 but is reduced at low pH,42 allowing for control over cross-link density. Increased stiffness from changes in chemical cross-link density by genipin content could be quantifiable by coloration changes,41 primary amine content,46,49 and fluorescence.43
Though crystallization and genipin cross-linking are both employed in previous studies to manufacture fibroin hydrogels, no studies have been attempted to examine the impact of the sequence of using both processes for manufacturing. 37,40,45–47,50 Combining crystallization with chemical cross-linking may provide more control over hydrogel properties such as mechanical stiffness, viscoelastic ratio, and gel microstructure. However, the chemical cross-linking process is reliant on contact between two primary amine groups and the genipin molecule, which is limited by low primary amine amounts in fibroin and restricted diffusion and chain mobility within the hydrogel with β-sheet crystals. Additionally, the reaction would be limited by low pH of the solution during the gelation process of crystal formation. Therefore, optimizing cross-linking potential would be reliant on material phase transition and its relation to the order of cross-linking treatments; the chronology of these two processes can greatly influence the stiffness and morphology of fibroin gel.
This paper examines the interaction between chemical cross-linking and crystallization in the formation of fibroin hydrogels. We have previously developed high pressure carbon-dioxide treatment (PCT) to decrease solution pH for β-sheet crystal formation in silk fibroin, which improved gel structure when compared to common citric acid titration methods.51 We also characterized silk fibroin materials chemically cross-linked with genipin.37,46,50 Bulk gel strength, stiffness, degradation rate, and swelling properties are highly reliant on cross-link density. 38,39,52 Incorporation of these separate effects would allow for control over gel structures and properties. Cell response and activity may be improved and/or dependent on control of hydrogel scaffolding material properties over various time and length scales. By characterizing gel material properties at the molecular and micron length scales, and comparing to modeled viscoelastic modulus, we may better interpret tunability of genipin/fibroin gels. Herein, we characterize how tunability of genipin/fibroin hydrogel frequency response and viscoelastic moduli are dependent on the order of cross-linking treatments.
2. MATERIALS AND METHODS
2.1. Materials
Bombyx mori polyhybrid silkworms were bred and selected by Centro Sperimentale di Gelsibachicoltura (Como, Italy). Silk cocoons were kindly supplied by Cooperativa Sociolario (Como, Italy). Lithium Bromide salt (LiBr) was purchased from Fluka Chemicals (Buchs, Switzerland) and Genipin was obtained from Waco Chemicals (Neuss, Germany). Other reagents, buffers, and salts were purchased from Sigma-Aldrich (St. Louis, MO, USA) and used without further purifications.
2.2. Preparation of Silk Fibroin Solution
Silk fibroin solutions in water were prepared according to Kim et al.,53 with limited modifications. First, Bombyx mori cocoons were degummed to remove sericin proteins; silk cocoons were treated twice in alkaline water baths at 98 °C for 1.5 h with concentrations of 1.1 and 0.4 g/L Na2CO3, respectively. Degummed silk was then washed several times in deionized (DI) water and dried at room temperature (RT) to obtain pure silk fibroin fibers. Fibroin fibers were then dissolved in 9.3 M LiBr (2 g of fibroin in 10 mL of LiBr solution) at 65 °C for 2.5 h. The solution was then dialyzed against DI water for 3 days at RT in a Slide- A-Lyzer dialysis cassette (3.5K MWCO, Pierce, Rockford, IL, USA) to remove the LiBr salt, and subsequently filtered through a ceramic filter foam (porosity <5 μm) to eliminate impurities. Protein concentration was determined using a NanoDrop ND-1000 spectrophotometer (Nanodrop Tech Wilmington, DE, USA), and concentration was adjusted to 4%w/v. Fibroin solution was then frozen in liquid nitrogen and stored at −80 °C until use. Frozen solution was later thawed at RT, refiltered to remove any aggregate formation, and concentration was adjusted to 3% to obtain working fibroin solutions. For all solutions except control, genipin was added to obtain a 1 mM concentration within the 3% fibroin solution.
2.3. Hydrogel Formation
2.3.1. High Pressure CO2 Reactor
Fixed volumes (240 μL) of initial fibroin solution were pipetted into custom-made polytetrafluoroethylene (Teflon) cylindrical molds (8 mm diameter × 5 mm depth) and placed within a stainless steel high pressure reaction vessel (BR-300, Berghof Products + Instruments, Eningen, Germany). The temperature of the reactor was controlled through an electrical heating jacket run by a BDL-3000 temperature controller (Berghof). CO2 gas was introduced in the reactor and pressurized at a working pressure of 60 bar through a high performance liquid chromatography (HPLC) pump (Model 426, Alltech, Deerfield, IL, USA).
2.3.2. Fibroin Gelation
Genipin was activated to chemically crosslink neighboring fibroin molecules by heat-treating samples at 37 °C for a minimum of 24 h. To prevent GCX reactions during PCT, temperature during the treatment was held at room temperature, unless otherwise noted. Control samples were fabricated at 37 °C during PCT, consistent with previous work.51 Co-cross-linked (CCX) samples were treated at 37 °C during PCT, allowing for maximum genipin activation during the physical cross-linking process. All other gels underwent heat treatment for 24 or 48 h, before (Pre24CX, Pre48CX) or after (Post24CX) PCT. After gel formation, samples were immediately submerged in 5 mL of DI water, and stored at 4 °C. DI was changed after 24 h to remove any residual, unreacted genipin from gels. Any samples visibly fractured or damaged during the gel removal process from the mold were removed from mechanical testing.
2.3.3. Modeling CO2 Diffusion
Diffusion of CO2 into the fibroin solution and the resulting pH was modeled using coefficient values determined by Duan et al.,54–56 and the pH model of CO2 in fibroin solution derived by Floren et al.51 Resulting concentrations were discerned for 60 bar and temperatures of 20, 22, 25, and 37 °C. Modeling shows higher concentration equilibrium at lower temperatures, and therefore faster diffusion of CO2 into the fibroin solution. These values concur with tables listed in Duan et al.55,56 Resulting pH was between 1.5 and 4, where gelation occurs through fibroin reaching the isoelectric point, and a plateau region in gelation times.32
2.4. Molecular Structure
2.4.1. Determination of Amino Acid Composition by RP-HPLC
The amino acid content of frozen fibroin samples was determined with Waters AccQ-Fluor Reagent Kit using the AccQ-Tag amino acid analysis method (WatersCorp., Milford, MA, USA). Briefly, fibroin-based hydrogels and solutions, without genipin, were frozen in liquid nitrogen and freeze-dried using a Lio-5P lyophilizer (5Pascal, Milan, Italy). About 5 mg of lyophilized fibroin was hydrolyzed with 6 N HCl at 114 ± 2 °C in a silicone oil bath for 24 h. Air-dried hydrolysates were later reconstituted with 20 mM HCl to obtain a solution at a concentration in the range 4–200 pmol and then derivatized with Water AccQ Flour Reagent to obtain stable amino acid. The amino acid content was determined by reverse phase high performance liquid chromatography (RP-HPLC) using a AccQTag column (Waters Corp) with a gradient of Waters AccQ-Tag Eluent A, Milli-Q water, and acetonitrile (HPLC grade) at a flow rate of 1 mL/min. The amino acids were detected with Jasco UV-1570 detector set (Jasco, Bouguenais, France) at 254 nm. The chromatograms obtained were compared with waters amino acid hydrolysate standards to identify single amino acid residues.
2.4.2. Molecular Weight Measurement by GPC
Gel permeation chromatography (GPC) analysis of the fibroin samples was conducted with a Shodex SB-805HQ column (Shodex OH pak, Showa Denko, Munich, Germany). Freeze-dried fibroin-based hydrogels and solutions were redissolved in 9.3 M LiBr at 65 °C for 0.5 h. The obtained fibroin solutions were dialyzed against DI water at RT and diluted with eluent solution (3 M Urea, 0.02 M Tris HCl, 0.15 M NaCl, pH 7.5) to obtain a protein concentration in the range of 0.5–0.8 mg/mL. The chromatography system was operated with a flow rate of 1 mL/min at 27 ± 1 °C and elution was detected with a Jasco UV-1570 detector set (Jasco, Bouguenais, France) at 224 nm. The calibration curve was obtained with Low/High Molecular Weight Gel Filtration Calibration Kit (GE Healthcare Europe, Freiburg, Germany).
2.4.3. Determination of Genipin Cross-Linking Activity by Confocal Microscopy
Previous literature shows GCX content is fluorescent with the excitation peak at 590 nm and emission peak at 630 nm.43 Increased fluorescence from GCX formation occurs due to increased π-bonding within the genipin bicyclic, fused ring structure after opening of the dihydropyran ring.41–43,45 Further increase in π- bonding and genipin concentration may occur in genipin dimerization during cross-linking, and is a commonly proposed mechanism of genipin cross-linking,42,43 including to fibroin.45
Lyophilized gels were rehydrated using DI for 24 h. Maximum GCX efficiency was measured by Control gels immersed in 15 mM glycine solution and 1 mM genipin for 24 h at 37 °C. Samples were removed from DI and separated on a single chamber slide, partitions removed, and a second glass slide placed over the samples to ensure homogeneous surface depth. Samples were then imaged using confocal microscopy (Nikon Corporation, Chiyoda, Tokyo, Japan). Genipin was excited by means of a diode pumped solid state laser (561 ± 0.5 nm, Melles Griot). Emission band collected ranged from 616 to 658 nm, with the gain set to maximize emission intensity without saturation for the gel with the highest emission intensity, and kept constant for all the others. Images where collected using a 20× Plan Flu objective with 2× scanning zoom (40× total, 4.97 μm/pixel resolution). The microscope pinhole was opened maximally to permit high PMT sensitivity, even with low emitting samples, and from the thickest optical section possible (7.83 μm), with a dwell time of the laser equal to 12.6 μs/voxel. After maximum emission intensity was determined within the sample set, program settings were maintained as a method of comparing between samples. Max GCX allows the determination of the overall GCX efficiency. Summation of emission intensity over the given area was recorded and converted to numerical byte values for each pixel in a 64 × 64 matrix. Images were analyzed using NIS-Elements Viewer (Nikon Corporation), and emission intensities were determined with ImageJ (NIH, Bethesda, MD, USA).
2.4.4. Determination of Chemical Cross-Linking Density by Ninhydrin Assay
Ninhydrin assay was used to determine active genipin content.49 Ninhydrin reacts with active NH2 groups, producing a visible purple color, detectable at a 570 nm wavelength by a spectrophotometer. By comparing ninhydrin content between control and variable gel samples, genipin bonding conditions may be determined. To ensure protein primary structures in samples were preserved, samples were first flash frozen by submerging in liquid nitrogen, and subsequently lyophilized at temperature of −50 °C and pressure of 5 mmHg for no less than 24 h. Ninhydrin (Sigma-Aldrich) solution of 0.35% w/v in ethanol (>96%) was added to lyophilized samples to a concentration of approximately 5 mg/mL, and heated at 90 °C for 30 min under mild shaking. Blank and glycine control solutions underwent the same treatment. After cooling down, optical absorbance of each solution was measured at 570 nm using a microplate reader (Tecan Group AG, Männendorf, Switzerland); each solution was measured in triplicate. Change in primary amine available was calculated as
| (1) |
where NHNsample is the color intensity presented by ninhydrin assay performed on the variable sample, and NHNcntrl is the color intensity presented by the control gel.
2.4.5. Determination of Physical Cross-Linking Density by Fourier Transform Infrared Spectroscopy
Protein secondary structures were determined through Fourier transform infrared spectroscopy (FTIR) Spectrum One (PerkinElmer, Waltham, MA, USA) with Zinc Selenide crystal. Two additional samples were compared with Control samples: Amorphous sample is fibroin solution that has not undergone PCT, and Genipin sample is 3% fibroin that has undergone 1 mM genipin cross-linking for 48 h without undergoing PCT. To preserve protein secondary structure, samples were lyophilized, then placed in FTIR sampling surface and compressed until a minimum force of 100 N was reached. Sample spectra were averaged over 4 scans, ranging from 650 to 4000 cm−1 at a resolution of 4 cm−1.
2.5. Microstructure Visualization
2.5.1. Scanning Electron Microscopy Imaging
Imaging of samples was obtained using a scanning electron microscope (Quanta 200 FESEM). Prior to imaging, lyophilized cross sections were sputter coated (Biorad SC500, Hemel Hempstead, UK) with a thin layer of gold or platinum/palladium mixture.
2.5.2. Confocal Microscopy Imaging
It is difficult to image hydrogel microstructure without altering gel structure using lyophilization or environmental SEM. Therefore, wet gel samples were stained with Rho 123, a fluorescent small molecule capable of penetrating bulk gel material, and then imaged with confocal microscopy. Samples were placed in Rho 123 solution at 4 °C for 24 h for staining, and then put in DI at 4 °C for 72 h to remove the dye from pores. Gels were then placed on glass slides for confocal imaging.
2.5.3. Image Analysis
Images were analyzed both quantitatively and qualitatively. Pore dimension was determined using ImageJ. Results were compared across gel sample sets, and between same sample sets across different imaging modes (Confocal vs SEM). Qualitative analysis was done by comparing morphology and gel structure across gel sample types.
2.6. Mechanical Properties
2.6.1. Swelling Ratio
Gels were submerged in DI for a minimum of 24 h and stored at 4 °C. Before mass measurement, samples were brought to room temperature and weighed. Subsequently, samples were submerged in liquid nitrogen and lyophilized. Dried samples were then weighed, and the swelling ratio was determined with the equation below:
| (2) |
Where mwet is the mas of the fully hydrated sample, and mdry is the mass of the lyophilized sample.
2.6.2. Mechanical Response
Large amplitude oscillatory strain (LAOS) in compression was performed to establish the viscous and elastic properties of the material. Frequency sweep of cyclic, uniaxial compression testing was used to determine approximate location of the transition frequency (ω), first harmonic storage modulus (E1′), and first harmonic loss modulus (E1″) of samples. Samples were placed between horizontal, quartz slides attached to both the base fixture and driving piston of a mechanical testing machine. (Bose, Eden Prairie, MN, USA) The driving plate was brought into contact with the gel, and DI was placed around the gel, with surface tension allowing DI to maintain its integrity for the duration of the test. Subsequently, an average strain of 25% was applied in compression and the system allowed to reach equilibrium. Dynamic strain was then oscillated at peak-to-peak amplitude of 20% strain, chosen from previous studies,20–22,57 and in vivo examples.58,59 Oscillation frequencies ranged from 2.202 × 10⁻³ to 1 Hz, where a plateau was reached. Data was recorded after 4 s of preconditioning of the sample for each frequency.
Data was analyzed using Wolfram Mathematica (Wolfram Research, Champaign, Illinois, USA). Discrete Fourier-transform was taken of both strain and stress data. Complex modulus (E1*) of the first harmonic was discerned from stress and strain response at the dominant frequency. Stress data curves were additionally smoothed through convolution with the normalized Gaussian kernel. Bandwidth varied with data frequency. Resulting smoothed curves were plotted against strain data to measure and visualize hysteresis curves, as well as overall stiffness response (E).
3. RESULTS AND DISCUSSIONS
Results from the study have shown significant changes in the material structure and gel property among all the silk fibroin gels, with the presence of genipin as well as the order of cross-linking treatment.
3.1. Physical Appearance of Gels
Because genipin is known to produce a distinct blue coloration after GCX occurs while fibroin aggregation produces a white and/or cloudy liquid, the physical appearance of the gels suggests the status of protein aggregation and cross-linking. Thus, we first studied the physical appearances of both the solution and the gels of the genipin/fibroin solution. All the fibroin and genipin/fibroin solutions were initially transparent with no coloration. The minimal primary amine content in fibroin, and genipin concentration in solution would necessitate increased reaction kinetics to initiate significant GCX formation between fibroin molecules. To test this, fibroin and genipin/fibroin solutions were compared after 24, 36, and 48 h at both 20 °C (room temperature or RT) and 37 °C. Genipin/fibroin solutions held at RT after a period of 24 h indicated no color changes or noticeable increases in solution turbidity. After a period of 36 and 48 h at RT, they showed a faint blue coloration, with minimal aggregation or no visible increases in turbidity. Minimal aggregation and coloration ensured chemical cross-linking is confined to the heat treatment (at 37 °C) step. Fibroin and genipin/fibroin solutions held at 37 °C still did not exhibit visible turbidity and remained a liquid after 24 or 48 h. But the genipin/fibroin solutions showed a medium blue color after 24 h, and turned into a darker blue coloration after 48 h. The color changes in the solutions correlated well with the corresponding gel samples: Pre48CX and Pre24CX gels both showed blue coloration, with a darker color in Pre48CX, whereas the Control, CCX, and Post24CX gels did not exhibit color changes, all showing white and translucent. Figure 1 summarizes the results with preparation protocols and representative pictures of the gels.
Figure 1.
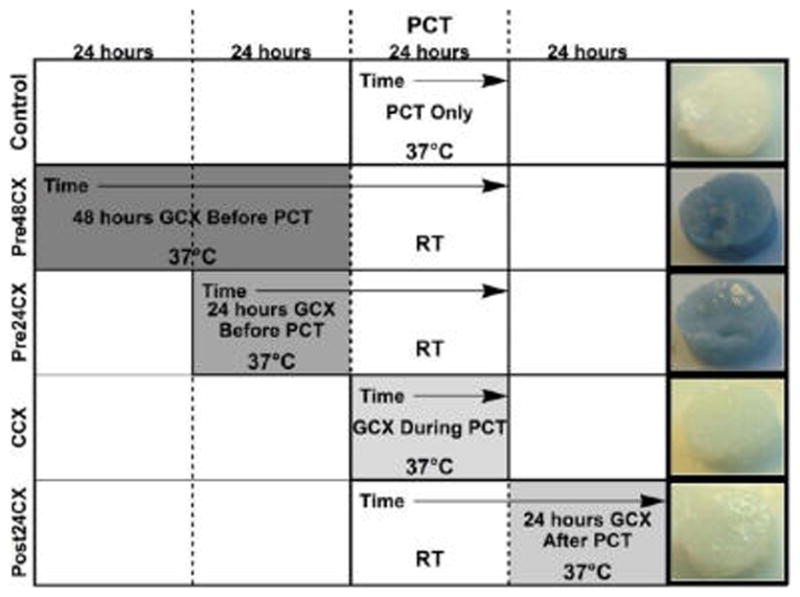
Preparation protocols and physical appearances of the gel samples. All samples were prepared from 3% w/v concentration of silk fibroin. The protocols show the order and degree of genipin cross-linking (GCX) with shaded blocks. Processing temperature during each 24 h block is listed, along with the cumulative time of processing. Herein, the control gels were from pure fibroin solution with 24 h PCT-induced crystallization, whereas all the other samples contained 1 mM concentration of genipin. Representative pictures of gels illustrating sample coloration and shape are shown on the right.
3.2. Molecular Structure
Results from RP-HPLC did not show significant alterations in the protein amino acid composition and therefore minimal difference in protein primary structure, among different gels.44 The protein secondary and quaternary structures showed no difference when compared to the control. All the gels showed high concentration of intermolecular β-sheet cross-linking, with no variation in the peak locations or intensities.
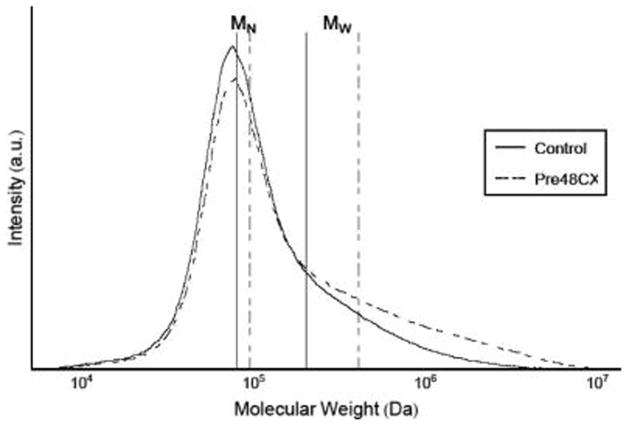
Results from GPC showed significant increases in both number-average and weight-average molecular weights (MN and MW, respectively) for Pre48CX, when compared to control gels. As illustrated with the Pre48CX curve, the GCX formation presented a distribution more skewed toward higher molecular weights, with both MW and MN higher than control gels (Figure 2).
Figure 2.
Gel permeation chromatography results, showing an increase in both MN and MW for gels with genipin cross-linking before gelation.
To understand further the GCX mechanism in changing the molecular structure, confocal microscopy was used to image GCX fluorescent signals. Results demonstrate significant increases of fluorescence emission in all GCX gels, when compared to control gels (Figure 3). The GCX concentration in Pre48CX and Pre24CX correlates with the cross-linking time.
Figure 3.
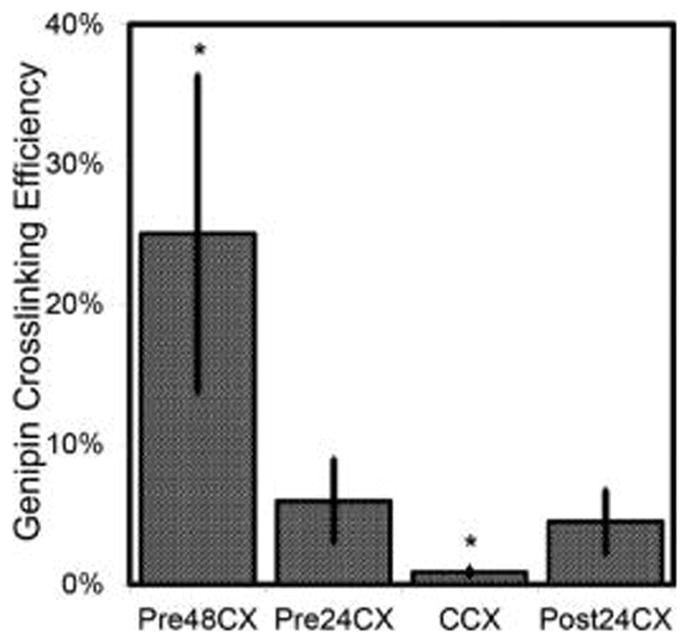
Genipin fluorescence emission results. Lyophilized and rehydrated samples were examined for genipin cross-linking (GCX) efficiencies, illustrated with the average intensities from confocal images. Results show the fluorescent signals from all the cross-linked gels are statistically (p < 0.10) different from control. Also, Pre48CX and CCX show statistically significant (p < 0.10) differences from all other cross-linked gels (labeled with “*”).
To examine the genipin activity along single fibroin chains, ninhydrin assay was used. Results demonstrate significant decreases in primary amine groups for all GCX samples compared to the Control (Figure 4). Results do not correlate with confocal fluorescence data.
Figure 4.
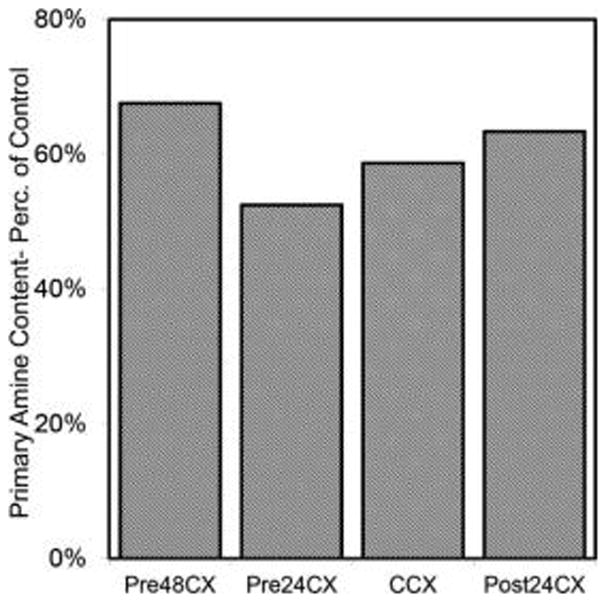
Primary amine sites quantified by ninhydrin assay. Results show the fraction of primary amine quantity in GCX gels (y-axis), when compared to control gels. All gels show decreased fraction in primary amine groups. Higher reduction in primary amine groups suggests increased genipin reactivity at bonding sites along single fibroin chains, rather than reaction between two fibroin molecules.
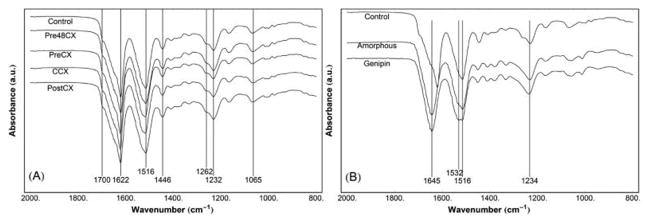
To characterize changes in major functional groups among gels, FTIR was used. Infrared spectroscopy results show that the presence of genipin or the order of cross-linking treatment did not induce any changes in peak locations or intensities (Figure 5A). Resulting peaks were typical for fibroin hydrogels, as previously shown by our lab.46,51 Specifically, all results showed the peaks representing strong, intermolecular β-sheet structures (1622 cm−1, amide I30), weak β-sheet structures (1700 cm−1, amide I30), and peak shift for tyrosine side chains (1516 cm−1, amide II31); peaks representing α-helix structures (1656–1662 cm−1, amide I30), random coils (1640–1655 cm−1, amide I;30 1540 cm−1, amide II31), turns (1663–1696 cm−1, amide I30), or side chain residues (1605–1615 cm−1, amide I30) were not present. In comparison, FTIR results of amorphous fibroin that did not undergo PCT with or without GCX (Figure 5B) showed peaks at 1645 cm−1 (random coil) and 1516 cm−1 (Tyr side chains). Amorphous fibroin after GCX showed an additional peak at 1532 cm−1, which may result from in-plane deformation of genipin bicyclic, fused ring structure.60 In summary, lyophilized silk solution without PCT-induced crystallization indicated no β-sheet formation, even after 48 h of GCX.
Figure 5.
Infrared spectra (FTIR) showing similar peak patterns among gel samples treated with PCT. (A) All gels presented high similarity in all major peaks of FTIR spectra, which showed the tight, intermolecular β-sheet crystals (1622 cm−1) and weaker β-sheet structures (1700 cm−1) of fibroin. (B) Lyophilized fibroin solutions without or with genipin cross-linking, undergoing no PCT gelation, are compared to the Control with PCT gelation. Both fibroin solutions present random coil (1645 cm−1) and tyrosine side chain peak shift (1516 cm−1), common in amorphous fibroin. Additionally, there is a peak at 1532 cm−1 in fibroin with genipin cross-linking, possibly resulting from in-plane deformation of the genipin bicyclic, fused ring structure.
3.3. Microstructure from SEM and Confocal Imaging
SEM images show that the gel microstructure changes with the cross-linking order. Two types of morphology were found in SEM images (Figure 6). Control gels and gels with GCX during or after PCT (CCX and Post24CX) exhibit porous microstructure with limited connectivity between pores. Low connectivity between pores is determined by decreased concentration of connected perforations, as illustrated with blue circles in Figure 7. Contrarily, gels with GCX before PCT show more fibrous morphology and higher pore connectivity. Morphology changes were more drastic in Pre48CX.
Figure 6.
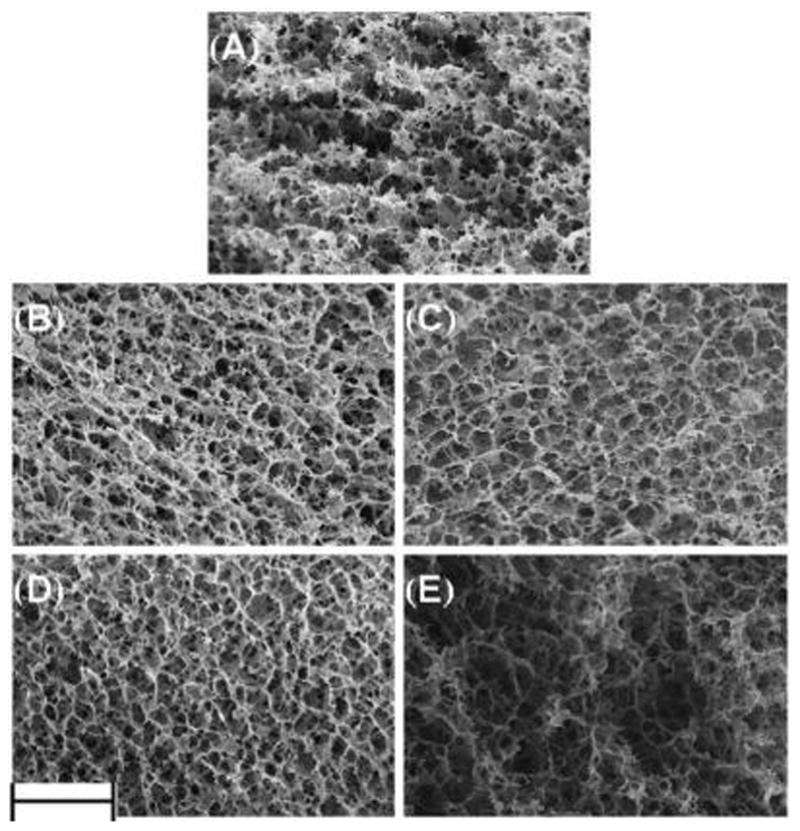
SEM micrographs showing the gel microstructure and morphology. (A) Control gel showed uniform pores with limited connectivity. (B) Pre48CX gels presented greater average pore size and more fibrous structure with high connectivity. (C) Pre24CX gels presented even larger pores with connectivity lower than Pre48CX. (D) CCX gels slightly increased pore size and connectivity when compared to the Control. (E) Post24CX gels presented little change in morphology from the Control. Scale bar equals 10 μm.
Figure 7.
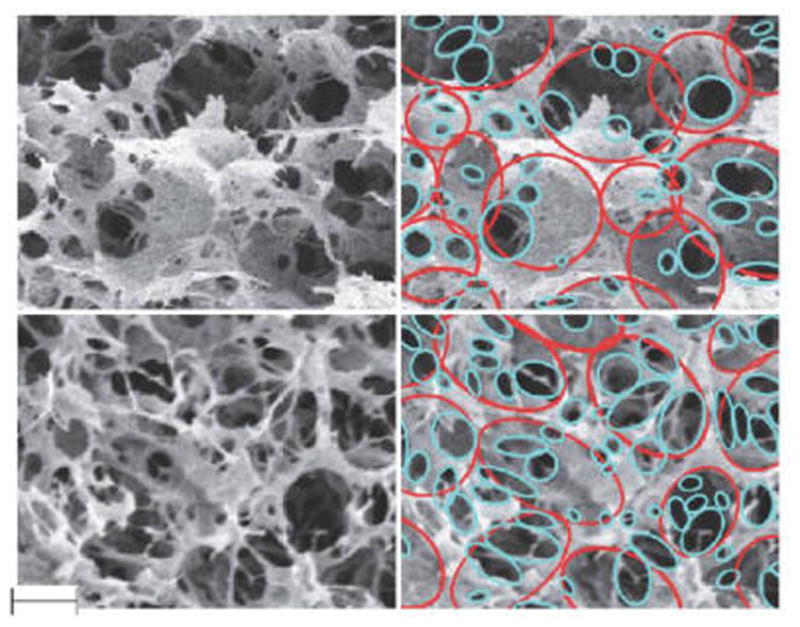
Comparison of Control (top) and Pre48CX (bottom) microstructures. The images on the right panel illustrate analysis of pore changes in the pore structure (red) and connecting perforation (blue). Scale bar equals 3 μm.
Confocal imaging results supported SEM findings by showing evenly distributed pores of uniform size within the saturated, wet gel (Figure 8). No changes were found along the depth of the gel, indicating homogeneous gel formation.
Figure 8.
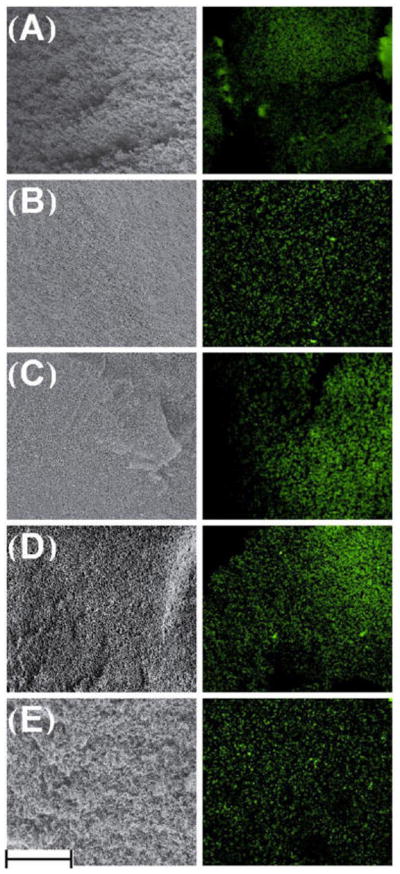
SEM (left) and confocal microscopy (right) images, showing the gels in dry and wet environments, respectively. These correlated images demonstrate that the gel microstructure retained after hydration. Confocal imaging was performed by illuminating pores with Rhodamine 123. (A) Control; (B) Pre48CX; (C) Pre24CX; (D) CCX; (E) Post24CX. Scale bar equals 100 μm.
3.4. Mechanical Properties
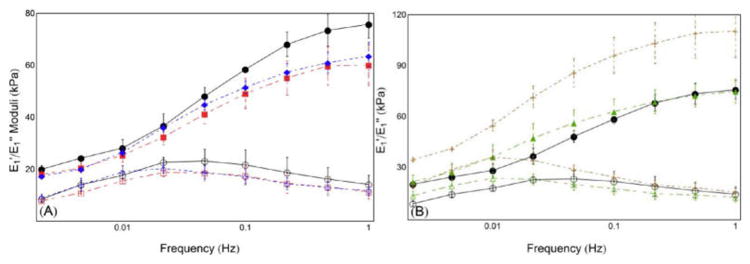
Mechanical testing results showed significant differences among all the gels (Figure 9). Gel stiffness was inversely correlated with pore connectivity visualized from SEM images. It was found that gels with GCX occurring during or after PCT (CCX and Post24CX) augmented stiffness whereas Pre48CX and Pre24CX gels showed decreased stiffness.
Figure 9.
Storage (E1′) and loss (E1″) moduli as functions of frequency. Results in control gels indicate decreased overall stiffness at lower frequencies. Additionally, E1″ appears lower than E1′ for all frequency values, and appears decreasing at similar or faster rate than E1′. (A) Comparison of Control (n = 3), Pre48CX (n = 3), and Pre24CX (n = 3) shows decreased stiffness for both E1′ and E1″ at all frequencies. (B) Post24CX (n = 2) shows increased stiffness compared to Control, whereas CCX (n = 4) shows lower transition frequency. Key: ●○, Control E1′ E1″; ■□, Pre48CX E1′ E1″; ◆ ◇, Pre24CX E1′ E1″; ▲△, CCX E1′ E1″; ++, Post24CX E1′ E1″.
Gel mechanical behaviors show significant changes in storage and loss modulus. Low frequency response indicated decreased stiffness with pre-PCT gelation GCX formation (Pre48CX, Pre24CX), and greater stiffness with GCX after PCT-induced gelation (Post24CX), when compared to Control (Figure 9).
E1′ and E1″ reveal typical viscoelastic response of gels, with lower and upper plateau regions at lower and higher frequencies, respectively, separated by a transition region. Values for E1″ show similar results to E1′ across all samples when compared to control. Interestingly, E1″ decreases with lower frequencies at a rate equal to or greater than that of E1′, which indicate that the material always acts as an elastic solid within the environmental constraints placed on the material.
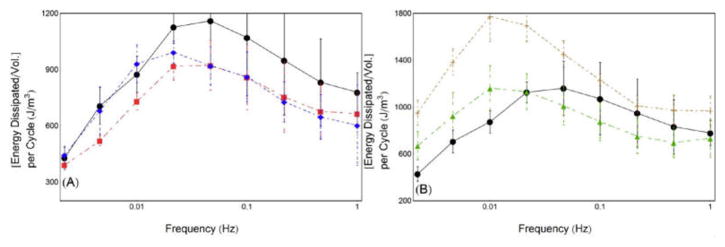
Energy dissipation curves indicate significant energy loss at all frequencies for all gels. Gels with GCX pre-PCT gelation show decreased energy dissipation, while GCX after PCT shows much greater energy dissipation values. All energy dissipation values correspond well with E1″ values (Figure 10). Both Post24CX and CCX gels showed a distinct peak shift to lower transition frequency, also corresponding to shifts seen in E1′.
Figure 10.
Energy dissipation per cycle was calculated from hysteresis curves, and plotted against frequency. (A) Comparisons of Control (n = 3), Pre48CX (n = 3), Pre24CX (n = 3) show decreased energy dissipation in GCX cross-linked gels. (B) Comparisons of Control, CCX (n = 4), and Post24CX (n = 2) show increased energy dissipation from Post24CX gels, and peak shift to lower transition frequency. Key: ●, Control; ■, Pre48CX; ◆, Pre24CX; ▲, CCX; +, Post24CX.
4. DISCUSSION
Herein, we show order of GCX formation with PCT-induced gelation through β-sheet crystallization affects SF hydrogel morphology, and resulting material properties with physiologic, high amplitude dynamic loading. Significant differences between sample loss and storage moduli are shown, which become greater at higher frequencies. GCX occurrence pre- PCT presents more fibrous morphology and decreased stiffness at higher frequencies. Occurrence of GCX during the PCT phase showed minimal effect. Alternately, GCX after PCT shows similar morphology, with increased stiffness at all frequencies. Furthermore, this stiffness response approximates gel response in different applications.
Silk fibroin that undergoes PCT-induced gelation forms highly hydrated, porous hydrogels,51 through induction of β- sheet crystallization. All samples within this study correspond with this previous data, with stable, homogeneous, porous gels forming as seen in SEM and confocal microscopy data (Figures 7 and 9). Reported stiffness data ranges from 15 to 60 kPa for low applied strain rates (~0.3%/s), which corresponds with similar strain rates in our study ( f = 0.015 Hz). Additionally, FTIR spectra show no significant changes between gels (Figure 5), indicating high levels of gel crystallinity between samples.30,31,51 Covalent cross-linking before PCT leads to more fibrous morphology, and decreased stiffness response. The microstructure changes, taken in conjunction with changes in MW distributions by GCX formation, suggest differences in nucleation rates among the gels. Previous studies in polymer formation indicate decreased nucleation times,61,62 and changed morphology,61–63 in bimodal polymer distributions. Although previous studies most frequently indicate chemical cross-linking increases material stiffness,38,39,43 and morphology change,39 testing is performed in the linear range. The fibrous morphology and greater pore connectivity may be responsible for decreased E1′ values.34,35 This decreased stiffness would also account for decreased energy dissipation, due to minimal elastic storage, and corresponds with decreased E1″ values.
Covalent cross-linking after PCT (PostCX) leads to much greater stiffness response, while maintaining similar morphology to Control. Although GCX occurring postgelation has been shown previously, molecular structure during GCX treatment was not fully crystallized,40 possibly allowing more amorphous chain movement. Furthermore, β-sheet content was increased after GCX formation,40 confusing mechanical response between GCX and higher crystallinity.
Taken together, results from ninhydrin assay, fluorescence emission, and physical appearance of gels suggest that genipin bonding to fibroin molecules occurs at low efficiency. After PCT-induced crystallization, amorphous chain groups are immobile, making primary amines less available for bonding, thereby diminishing GCX formation. Genipin bonding to a single fibroin molecule decreases primary amine content as measured by ninhydrin (Figure 4),41,49,50 whereas fluorescence (Figure 3) shows the greatest increase with genipin dimer bridge formation due to additional π-bonds within the bicyclic fused, ring structure.42,43,45 Therefore, mismatch between these two data sets indicates partial, but not complete, GCX formation in Post24CX gels. The first reaction to occur in genipin bonding to a primary amine group is the opening of the dihydropyran ring within the fused ring structure, thereby causing one additional π-bond to form.41 Therefore, fluorescence would increase without creating blue pigmentation of full GCX formation. Of the two-part genipin reaction, this was shown to occur first,41 and would increase fluorescence, thereby creating a disparity between fluorescence and pigmentation. This may explain the similarity in fluorescence, but disparity in coloration between Pre24CX and Post24CX gels.
Stiffness response in Post24CX samples showed significant differences. GCX formation after gelation would cause partial formation of a polymer network within the amorphous region, reducing molecular motion, and increasing stiffness response. This increased stiffness response may also be seen in increased E1″ values, and corresponding increased energy dissipation as seen in Figure 10. Peak shifts toward longer relaxation times (1/f), present in both CCX and Post24CX energy dissipation and first harmonic moduli plots, may result from amorphous network cross-linking.64
Previously, genipin cross-linking has been studied with fibroin, though the sequential order between GCX and gelation was not examined.40,45–47,50 Dynamic mechanical response with physiologic, nonlinear strain was also not examined in these previous studies. Large compressive strain deformation amplifies stiffness response from morphological structure26,65 and permeability within poroviscoelastic solids.35 This may be derived from Poisson’s ratio causing volumetric changes between the solid and fluid phases of the material, resulting in fluid flux, and corresponding pressure from fluid drag (see the Supporting Information, S1). Application of a nonlinear strain would therefore highlight morphological changes, resulting in higher permeability, and material response under physiologic strains.
Material tunability allows broader application, and may improve scaffold design. Morphology plays an important role in cell activity through cell attachment66 and nutrient transport. 10–12 Additionally, both microstructure27,28,34 and connectivity34,35 affect matrix stiffness, an important contributor to cell interaction and activity.14–16 Material stiffness and its response to applied strain additionally play a role in cell differentiation.6,7,17–19 Herein, we show that stiffness response within the frequency spectrum may be controlled by changing order of GCX formation and PCT-induced gelation in SF hydrogels.
5. CONCLUSIONS
The order of GCX and PCT during formation of SF hydrogels has significant effects, and is capable of “tuning” a gel microstructure. Through alteration of both chemical (GCX) and physical (PCT) cross-linking, we may affect either the viscoelastic range or overall stiffness of the material.
GCX formation before PCT results in decreased stiffness response at higher frequencies due to greater pore connectivity34,35 (Figure 8). The underlying cause is probably greater skewing and spread of SF molecular weight distribution (Figure 3) before PCT, leading to morphological changes.61–63 In comparison to Control, the microstructure is most responsible for hydrogel stiffness response, with both Pre48CX and Pre24CX gels showing decreased E1′ and E1″ values. Here we illustrate GCX pre-PCT gelation alters the microstructure, with minimal molecular structure changes.
GCX formation after PCT causes anchoring of amorphous SF entanglements, causing much greater stiffness response at all loading frequencies. Increased stiffness occurred in Post24CX gels compared to Control (Figure 10) across all frequency values, for both E1′ and E1″. Visually, SEM images of Post24CX indicated the greatest similarity with control gels, indicating that GCX augments stiffness of the control molecular and morphology structures. Though gels with GCX formation pre- PCT show much higher cross-linking concentration, GCX after entanglement would create polymer networks within the amorphous region of the fibroin. Here we see that the microstructure is similarly formed compared to Control, but with major changes to molecular mechanics within the material.
Acknowledgments
The authors thank Lorenzo Moschini for his help in high pressure liquid chromatography, and gel permeation chromatography data acquisition and analysis, and acknowledge funding sources including NHLBI (HL119371 to W.T.).
ABBREVIATIONS
- CCX
Gels with concurrent genipin cross-linking with gelation
- DI
Deionized water
- E1′
First harmonic storage modulus
- E1″
First harmonic loss modulus
- E*
Complex modulus
- FTIR
Fourier-transform infrared spectroscopy
- GCX
Genipin cross-link
- GPC
Gel permeation chromatography
- LAOS
Large amplitude oscillatory strain
- PCT
High pressure carbon dioxide treatment
- Pre48CX
Gels with genipin cross-linking 48 h pregelation
- Pre24CX
Gels with genipin cross-linking 24 h pregelation
- Post24CX
Gels with 24 h of genipin cross-linking after gelation
- RP-HPLC
Reverse phases-high performance liquid chromatography
- SEM
Scanning electron microscopy
Footnotes
Author Contributions
The paper was written through contributions of all authors. All authors have given approval to the final version of the paper.
Notes
The authors declare no competing financial interest.
Supporting Information
Description of stress response resulting from fluid flux in porous hydrogel. The Supporting Information is available free of charge on the ACS Publications website at DOI: 10.1021/ acsami.5b02308.
References
- 1.van der Lei DB, Wildevuur CRH, Nieuwenhuis P, Blaauw EH, Dijk F, Hulstaert CE, Molenaar I. Regeneration of the Arterial Wall in Microporous, Compliant, Biodegradable Vascular Grafts after Implantation into the Rat Abdominal Aorta. Cell Tissue Res. 1985;242(3):569–578. doi: 10.1007/BF00225423. [DOI] [PubMed] [Google Scholar]
- 2.Bartels HL, van der Lei B. Small-Calibre Vascular Grafting into the Rat Abdominal Aorta with Biodegradable Prostheses. Lab Anim. 1988;22(2):122–126. doi: 10.1258/002367788780864556. [DOI] [PubMed] [Google Scholar]
- 3.Aumailley M, Timpl R. Attachment of Cells to Basement Membrane Collagen Type IV. J Cell Biol. 1986;103(4):1569–1575. doi: 10.1083/jcb.103.4.1569. [DOI] [PMC free article] [PubMed] [Google Scholar]
- 4.Dahl SLM, Kypson AP, Lawson JH, Blum JL, Strader JT, Li Y, Manson RJ, Tente WE, DiBernardo L, Hensley MT, Carter R, Williams TP, Prichard HL, Dey MS, Begelman KG, Niklason LE. Readily Available Tissue-Engineered Vascular Grafts. Sci Transl Med. 2011;3(68):68ra9–ra68ra9. doi: 10.1126/scitranslmed.3001426. [DOI] [PubMed] [Google Scholar]
- 5.Stewart SF, Lyman DJ. Effects of a Vascular Graft/Natural Artery Compliance Mismatch on Pulsatile Flow. J Biomech. 1992;25(3):297–310. doi: 10.1016/0021-9290(92)90027-x. [DOI] [PubMed] [Google Scholar]
- 6.Engler AJ, Sen S, Sweeney HL, Discher DE. Matrix Elasticity Directs Stem Cell Lineage Specification. Cell. 2006;126(4):677–689. doi: 10.1016/j.cell.2006.06.044. [DOI] [PubMed] [Google Scholar]
- 7.Wingate K, Bonani W, Tan Y, Bryant SJ, Tan W. Compressive Elasticity of Three-Dimensional Nanofiber Matrix Directs Mesenchymal Stem Cell Differentiation to Vascular Cells with Endothelial or Smooth Muscle Cell Markers. Acta Biomater. 2012;8(4):1440–1449. doi: 10.1016/j.actbio.2011.12.032. [DOI] [PMC free article] [PubMed] [Google Scholar]
- 8.Chen X, Knight DP, Shao Z, Vollrath F. Regenerated Bombyx Silk Solutions Studied with Rheometry and FTIR. Polymer. 2001;42(25):09969–09974. [Google Scholar]
- 9.Badylak SF, Nerem RM. Progress in Tissue Engineering and Regenerative Medicine. Proc Natl Acad Sci U S A. 2010;107(8):3285–3286. doi: 10.1073/pnas.1000256107. [DOI] [PMC free article] [PubMed] [Google Scholar]
- 10.Drury JL, Mooney DJ. Hydrogels for Tissue Engineering: Scaffold Design Variables and Applications. Biomaterials. 2003;24(24):4337–4351. doi: 10.1016/s0142-9612(03)00340-5. [DOI] [PubMed] [Google Scholar]
- 11.Peppas NA, Bures P, Leobandung W, Ichikawa H. Hydrogels in Pharmaceutical Formulations. Eur J Pharm Biopharm. 2000;50(1):27–46. doi: 10.1016/s0939-6411(00)00090-4. [DOI] [PubMed] [Google Scholar]
- 12.Vepari C, Kaplan DL. Silk as a Biomaterial. Prog Polym Sci. 2007;32(8–9):991–1007. doi: 10.1016/j.progpolymsci.2007.05.013. [DOI] [PMC free article] [PubMed] [Google Scholar]
- 13.Wahlgren M, Arnebrant T. Protein Adsorption to Solid Surfaces. Trends Biotechnol. 1991;9(1):201–208. doi: 10.1016/0167-7799(91)90064-o. [DOI] [PubMed] [Google Scholar]
- 14.Ingber D. Mechanobiology and Diseases of Mechanotransduction. Ann Med. 2003;35(8):564–577. doi: 10.1080/07853890310016333. [DOI] [PubMed] [Google Scholar]
- 15.Wang H-B, Dembo M, Wang Y-L. Substrate Flexibility Regulates Growth and Apoptosis of Normal but Not Transformed Cells. Am J Physiol: Cell Physiol. 2000;279(5):C1345–C1350. doi: 10.1152/ajpcell.2000.279.5.C1345. [DOI] [PubMed] [Google Scholar]
- 16.Guo W, Frey MT, Burnham NA, Wang Y. Substrate Rigidity Regulates the Formation and Maintenance of Tissues. Biophys J. 2006;90(6):2213–2220. doi: 10.1529/biophysj.105.070144. [DOI] [PMC free article] [PubMed] [Google Scholar]
- 17.Guilak F, Cohen DM, Estes BT, Gimble JM, Liedtke W, Chen CS. Control of Stem Cell Fate by Physical Interactions with the Extracellular Matrix. Cell Stem Cell. 2009;5(1):17–26. doi: 10.1016/j.stem.2009.06.016. [DOI] [PMC free article] [PubMed] [Google Scholar]
- 18.Simmons CA, Matlis S, Thornton AJ, Chen S, Wang C-Y, Mooney DJ. Cyclic Strain Enhances Matrix Mineralization by Adult Human Mesenchymal Stem Cells via the Extracellular Signal- Regulated Kinase (ERK1/2) Signaling Pathway. J Biomech. 2003;36(8):1087–1096. doi: 10.1016/s0021-9290(03)00110-6. [DOI] [PubMed] [Google Scholar]
- 19.Sen B, Xie Z, Case N, Ma M, Rubin C, Rubin J. Mechanical Strain Inhibits Adipogenesis in Mesenchymal Stem Cells by Stimulating a Durable B-Catenin Signal. Endocrinology. 2008;149(12):6065–6075. doi: 10.1210/en.2008-0687. [DOI] [PMC free article] [PubMed] [Google Scholar]
- 20.Kim B-S, Nikolovski J, Bonadio J, Mooney DJ. Cyclic Mechanical Strain Regulates the Development of Engineered Smooth Muscle Tissue. Nat Biotechnol. 1999;17(10):979–983. doi: 10.1038/13671. [DOI] [PubMed] [Google Scholar]
- 21.Howard AB, Alexander RW, Nerem RM, Griendling KK, Taylor WR. Cyclic Strain Induces an Oxidative Stress in Endothelial Cells. Am J Physiol: Cell Physiol. 1997;272(2):C421–C427. doi: 10.1152/ajpcell.1997.272.2.C421. [DOI] [PubMed] [Google Scholar]
- 22.Lee DA, Bader DL. Compressive Strains at Physiological Frequencies Influence the Metabolism of Chondrocytes Seeded in Agarose. J Orthop Res. 1997;15(2):181–188. doi: 10.1002/jor.1100150205. [DOI] [PubMed] [Google Scholar]
- 23.Bao G, Suresh S. Cell and Molecular Mechanics of Biological Materials. Nat Mater. 2003;2(11):715–725. doi: 10.1038/nmat1001. [DOI] [PubMed] [Google Scholar]
- 24.Wottawah F, Schinkinger S, Lincoln B, Ananthakrishnan R, Romeyke M, Guck J, Käs J. Optical Rheology of Biological Cells. Phys Rev Lett. 2005;94(9) doi: 10.1103/PhysRevLett.94.098103. [DOI] [PubMed] [Google Scholar]
- 25.Guan J, Porter D, Vollrath F. Thermally Induced Changes in Dynamic Mechanical Properties of Native Silks. Biomacromolecules. 2013;14(3):930–937. doi: 10.1021/bm400012k. [DOI] [PubMed] [Google Scholar]
- 26.Hyun K, Wilhelm M, Klein CO, Cho KS, Nam JG, Ahn KH, Lee SJ, Ewoldt RH, McKinley GH. A Review of Nonlinear Oscillatory Shear Tests: Analysis and Application of Large Amplitude Oscillatory Shear (LAOS) Prog Polym Sci. 2011;36(12):1697–1753. [Google Scholar]
- 27.Discher DE. Tissue Cells Feel and Respond to the Stiffness of Their Substrate. Science. 2005;310(5751):1139–1143. doi: 10.1126/science.1116995. [DOI] [PubMed] [Google Scholar]
- 28.Saha K, Keung AJ, Irwin EF, Li Y, Little L, Schaffer DV, Healy KE. Substrate Modulus Directs Neural Stem Cell Behavior. Biophys J. 2008;95(9):4426–4438. doi: 10.1529/biophysj.108.132217. [DOI] [PMC free article] [PubMed] [Google Scholar]
- 29.Bini E, Knight DP, Kaplan DL. Mapping Domain Structures in Silks from Insects and Spiders Related to Protein Assembly. J Mol Biol. 2004;335(1):27–40. doi: 10.1016/j.jmb.2003.10.043. [DOI] [PubMed] [Google Scholar]
- 30.Hu X, Kaplan D, Cebe P. Determining Beta-Sheet Crystallinity in Fibrous Proteins by Thermal Analysis and Infrared Spectroscopy. Macromolecules. 2006;39(18):6161–6170. [Google Scholar]
- 31.Hu X, Shmelev K, Sun L, Gil E-S, Park S-H, Cebe P, Kaplan DL. Regulation of Silk Material Structure by Temperature- Controlled Water Vapor Annealing. Biomacromolecules. 2011;12(5):1686–1696. doi: 10.1021/bm200062a. [DOI] [PMC free article] [PubMed] [Google Scholar]
- 32.Ayub Haider Z, Arai M, Hirabayashi K. Mechanism of the Gelation of Fibroin Solution. Biosci Biotechnol Biochem. 1993;57(11):1910–1912. [Google Scholar]
- 33.Keten S, Xu Z, Ihle B, Buehler MJ. Nanoconfinement Controls Stiffness, Strength and Mechanical Toughness of β-Sheet Crystals in Silk. Nat Mater. 2010;9(4):359–367. doi: 10.1038/nmat2704. [DOI] [PubMed] [Google Scholar]
- 34.Hollister SJ. Porous Scaffold Design for Tissue Engineering. Nat Mater. 2005;4(7):518–524. doi: 10.1038/nmat1421. [DOI] [PubMed] [Google Scholar]
- 35.Mak AF. The Apparent Viscoelastic Behavior of Articular Cartilage—The Contributions From the Intrinsic Matrix Viscoelasticity and Interstitial Fluid Flows. J Biomech Eng. 1986;108(2):123–130. doi: 10.1115/1.3138591. [DOI] [PubMed] [Google Scholar]
- 36.Yao C. Preparation of Networks of Gelatin and Genipin as Degradable Biomaterials. Mater Chem Phys. 2003;83(2–3):204–208. [Google Scholar]
- 37.Silva SS, Maniglio D, Motta A, Mano JF, Reis RL, Migliaresi C. Genipin-Modified Silk-Fibroin Nanometric Nets. Macromol Biosci. 2008;8(8):766–774. doi: 10.1002/mabi.200700300. [DOI] [PubMed] [Google Scholar]
- 38.Madhavan K, Belchenko D, Motta A, Tan W. Evaluation of Composition and Crosslinking Effects on Collagen-based Composite Constructs. Acta Biomater. 2010;6(4):1413–1422. doi: 10.1016/j.actbio.2009.09.028. [DOI] [PubMed] [Google Scholar]
- 39.Bi L, Cao Z, Hu Y, Song Y, Yu L, Yang B, Mu J, Huang Z, Han Y. Effects of Different Cross-Linking Conditions on the Properties of Genipin-Cross-Linked Chitosan/Collagen Scaffolds for Cartilage Tissue Engineering. J Mater Sci Mater Med. 2011;22(1):51–62. doi: 10.1007/s10856-010-4177-3. [DOI] [PubMed] [Google Scholar]
- 40.Xiao W, Liu W, Sun J, Dan X, Wei D, Fan H. Ultrasonication and Genipin Cross-Linking to Prepare Novel Silk Fibroin-Gelatin Composite Hydrogel. J Bioact Compat Polym. 2012;27(4):327–341. [Google Scholar]
- 41.Butler MF, Ng Y-F, Pudney PD. Mechanism and Kinetics of the Crosslinking Reaction between Biopolymers Containing Primary Amine Groups and Genipin. J Polym Sci, Part A: Polym Chem. 2003;41(24):3941–3953. [Google Scholar]
- 42.Mi F-L, Shyu S-S, Peng C-K. Characterization of Ring- Opening Polymerization of Genipin and pH-Dependent Cross- Linking Reactions between Chitosan and Genipin. J Polym Sci, Part A: Polym Chem. 2005;43(10):1985–2000. [Google Scholar]
- 43.Sundararaghavan HG, Monteiro GA, Lapin NA, Chabal YJ, Miksan JR, Shreiber DI. Genipin-Induced Changes in Collagen Gels: Correlation of Mechanical Properties to Fluorescence. J Biomed Mater Res, Part A. 2008;87A(2):308–320. doi: 10.1002/jbm.a.31715. [DOI] [PubMed] [Google Scholar]
- 44.Marsh RE, Corey RB, Pauling L. An Investigation of the Structure of Silk Fibroin. Biochim Biophys Acta. 1955;16:1–34. doi: 10.1016/0006-3002(55)90178-5. [DOI] [PubMed] [Google Scholar]
- 45.Wang L, Wang Y, Qu J, Hu Y, You R, Li M. The Cytocompatibility of Genipin-Crosslinked Silk Fibroin Films. J Biomater Nanobiotechnol. 2013;04(03):213–221. [Google Scholar]
- 46.Sun W, Incitti T, Migliaresi C, Quattrone A, Casarosa S, Motta A. Genipin-Crosslinked Gelatin-Silk Fibroin Hydrogels for Modulating the Behaviour of Pluripotent Cells: Modulating the Behaviour of Pluripotent Cells. J Tissue Eng Regen Med. 2014 doi: 10.1002/term.1868. [DOI] [PubMed] [Google Scholar]
- 47.Motta A, Barbato B, Foss C, Torricelli P, Migliaresi C. Stabilization of Bombyx Mori Silk Fibroin/Sericin Films by Cross-linking with PEG-DE 600 and Genipin. J Bioact Compat Polym. 2011;26(2):130–143. [Google Scholar]
- 48.Nickerson MT, Patel J, Heyd DV, Rousseau D, Paulson AT. Kinetic and Mechanistic Considerations in the Gelation of Genipin-Crosslinked Gelatin. Int J Biol Macromol. 2006;39(4–5):298–302. doi: 10.1016/j.ijbiomac.2006.04.010. [DOI] [PubMed] [Google Scholar]
- 49.Foss C, Merzari E, Migliaresi C, Motta A. Silk Fibroin/ Hyaluronic Acid 3D Matrices for Cartilage Tissue Engineering. Biomacromolecules. 2013;14(1):38–47. doi: 10.1021/bm301174x. [DOI] [PubMed] [Google Scholar]
- 50.Silva SS, Motta A, Rodrigues MT, Pinheiro AFM, Gomes ME, Mano JF, Reis RL, Migliaresi C. Novel Genipin- Cross-Linked Chitosan/Silk Fibroin Sponges for Cartilage Engineering Strategies. Biomacromolecules. 2008;9(10):2764–2774. doi: 10.1021/bm800874q. [DOI] [PubMed] [Google Scholar]
- 51.Floren ML, Spilimbergo S, Motta A, Migliaresi C. Carbon Dioxide Induced Silk Protein Gelation for Biomedical Applications. Biomacromolecules. 2012;13(7):2060–2072. doi: 10.1021/bm300450a. [DOI] [PubMed] [Google Scholar]
- 52.Eichenbaum JW. Trends in Cataract Surgery. Bull N Y Acad Med. 1992;68(3):367. [PMC free article] [PubMed] [Google Scholar]
- 53.Kim U-J, Park J, Joo Kim H, Wada M, Kaplan DL. Three- Dimensional Aqueous-Derived Biomaterial Scaffolds from Silk Fibroin. Biomaterials. 2005;26(15):2775–2785. doi: 10.1016/j.biomaterials.2004.07.044. [DOI] [PubMed] [Google Scholar]
- 54.Duan Z, Møller N, Weare JH. An Equation of State for the CH4-CO2-H2O System: I. Pure Systems from 0 to 1000° C and 0 to 8000 bar. Geochim Cosmochim Acta. 1992;56(7):2605–2617. [Google Scholar]
- 55.Duan Z, Sun R. An Improved Model Calculating CO2 Solubility in Pure Water and Aqueous NaCl Solutions from 273 to 533 K and from 0 to 2000 bar. Chem Geol. 2003;193(3–4):257–271. [Google Scholar]
- 56.Duan Z, Sun R, Zhu C, Chou I-M. An Improved Model for the Calculation of CO2 Solubility in Aqueous Solutions Containing Na+, K+, Ca2+, Mg2+, Cl−, and SO4 2−. Mar Chem. 2006;98(2–4):131–139. [Google Scholar]
- 57.Park S, Hung CT, Ateshian GA. Mechanical Response of Bovine Articular Cartilage under Dynamic Unconfined Compression Loading at Physiological Stress Levels. Osteoarthritis Cartilage. 2004;12(1):65–73. doi: 10.1016/j.joca.2003.08.005. [DOI] [PubMed] [Google Scholar]
- 58.Fung YC, Liu SQ. Strain Distribution in Small Blood Vessels with Zero-Stress State Taken into Consideration. Am J Physiol: Heart Circ Physiol. 1992;262(2):H544–H552. doi: 10.1152/ajpheart.1992.262.2.H544. [DOI] [PubMed] [Google Scholar]
- 59.Kalath S, Tsipouras P, Silver FH. Non-invasive Assessment of Aortic Mechanical Properties. Ann Biomed Eng. 1986;14(6):513–524. doi: 10.1007/BF02484469. [DOI] [PubMed] [Google Scholar]
- 60.Suryani, Liu Y-L. Preparation and Properties of Nanocomposite Membranes of Polybenzimidazole/Sulfonated Silica Nanoparticles for Proton Exchange Membranes. J Membr Sci. 2009;332(1–2):121–128. [Google Scholar]
- 61.Krumme A, Lehtinen A, Viikna A. Crystallisation Behaviour of High Density Polyethylene Blends with Bimodal Molar Mass Distribution 1. Basic Characteristics and Isothermal Crystallisation. Eur Polym J. 2004;40(2):359–369. [Google Scholar]
- 62.Song S, Wu P, Ye M, Feng J, Yang Y. Effect of Small Amount of Ultra High Molecular Weight Component on the Crystallization Behaviors of Bimodal High Density Polyethylene. Polymer. 2008;49(12):2964–2973. [Google Scholar]
- 63.Emri I, von Bernstorff BS. The Effect of Molecular Mass Distribution on Time-Dependent Behavior of Polyamides. J Appl Mech. 2006;73(5):752–757. [Google Scholar]
- 64.Glatz-Reichenbach JK, Sorriero L, Fitzgerald JJ. Influence of Cross-linking on the Molecular Relaxation of an Amorphous Copolymer near Its Glass-Transition Temperature. Macromolecules. 1994;27(6):1338–1343. [Google Scholar]
- 65.Lockett FJ. Nonlinear Viscoelastic Solids. Academic Press; New York: 1972. [Google Scholar]
- 66.Arnold M, Cavalcanti-Adam EA, Glass R, Blümmel J, Eck W, Kantlehner M, Kessler H, Spatz JP. Activation of Integrin Function by Nanopatterned Adhesive Interfaces. Chem Phys Chem. 2004;5(3):383–388. doi: 10.1002/cphc.200301014. [DOI] [PubMed] [Google Scholar]


