

Abstract
BACKGROUND
Elderberry (Sambucus spp.) fruit are used for food and dietary supplements in Europe and North America, and contain large amounts of cyanidin-based anthocyanins and other phenolics that may benefit human health.
OBJECTIVES
Information on the effect of both genotype and production environment on elderberry juice characteristics is needed in order to optimize production of quality food and dietary supplements.
METHODS
The characteristics of elderberry fruits relative to genetic and production environment were evaluated from 12 American elderberry genotypes at three U.S. sites (two in Missouri and one in Oregon) over three growing seasons. Additional genotypes of American and European elderberry were studied at the Oregon site.
RESULTS
Location, genotype, and growing season influenced pH, soluble solids, titratable acidity, total phenolics, and total anthocyanins. Elderberries grown in Oregon were consistently higher in acidity than those grown in Missouri. Differences in acidity and anthocyanin with environment were dependent on genotype. Non-acylated anthocyanins and flavonol-glycosides were more influenced by location than by genotype.
CONCLUSION
‘Bob Gordon’ and ‘Adams 2’ genotypes, which are good producers in diverse environments, were significantly higher in total phenolic and total anthocyanin contents in all locations, and may be good selections for producing juices, wines, or health products.
Keywords: Sambucus, medicinal, berry quality, anthocyanin, phenolics
1. Introduction
Most elderberries are small red, blue, or black fruit produced on large shrubs or small trees. Elderberries are well known in Europe, where the species Sambucus nigra L. (syn. S. nigra L. subsp. nigra) is well established in cultivation. In the eastern U.S. and Canada, the cultivation and domestication of the native American elderberry, S. canadensis L. (syn. S. nigra L. subsp. canadensis [L.] Bolli), is nascent e.g., [3, 4, 6, 7, 21]. American elderberry has been used traditionally to produce jams, jellies, syrups, juices, and wines, and elderberry consumers are more health conscious than regular consumers [2, 5, 12]. It is difficult to gauge U.S. commercial interest in S. canadensis fruit, although elderberry dietary supplements are top selling products in Europe and North America [2, 9].
European and American elderberries have purported health benefits, including anti-inflammatory, antibacterial and antiviral properties [1, 17, 24], and the pigments offer use as food colorants [5]. In elderberry, anthocyanins are derivatives of cyanidin-glycosides [10, 13, 22, 23]. While not found in S. nigra, acylated forms of cyanidin-glycosides are common in S. canadensis, comprising 50% or more of total anthocyanins [10, 14]. Acylated anthocyanins are prized for imparting color shelf stability to food products [10]. Both elderberry species contain hydroxycinnamic acids (caffeolyquinic acids) and flavonol-glycosides (quercetin-based) as the dominant non-anthocyanin polyphenolics [10]. Relative contents of anthocyanins and other polyphenolics have been shown to vary with genotype and growing season at single production locations in the northwestern and central U.S. [10, 15, 20].
In work published from the same elderberry orchards as the present study [7], productivity of a number of S. canadensis and S. nigra genotypes differed greatly among diverse climates (northwestern and midwestern U.S), and two genotypes that maintained high productivity in all locations were released as named cultivars [3, 4]. As part of this same large production study, berries were collected from plants each year for detailed laboratory analysis. Fruit composition analysis is presented in this study to compare the diverse elderberry genotypes grown in three production environments across multiple growing seasons.
2. Materials and methods
2.1. Plant material
Plantings of 12 S. canadensis genotypes were established in 2003 at three locations: University of Missouri’s Southwest Research Center at Mt. Vernon; Missouri State University’s State Fruit Experiment Station at Mountain Grove (abbreviated Mtn. Grove); and the USDA-ARS North Farm in the Willamette Valley near Corvallis, Oregon (OR). These locations represent the Southern Plains area and the Pacific Northwest area of the United States.
The plantings of the S. canadensis genotypes common to all three sites were established in a completely randomized design at each site, with 12 genotypes, four field-plot replications per genotype (some with fewer replications at Corvallis), and sampled in the form of a repeated measure over time (three years). An additional 23 S. canadensis and three S. nigra genotypes at Corvallis were planted among the other plots, included between one and four replications, and were also sampled as repeated measures over time (two years). Details on these plantings, including geography, soils, climate, establishment, plant/row spacing, management, yields, and the elderberry genotypes used are provided in Finn et al. [7]. The genotypes ‘Gordon B’ and ‘Wyldewood 1’ studied in Finn et al. [7], Lee and Finn [10], and Thomas et al. [20] have been subsequently named ‘Bob Gordon’ and ‘Wyldewood’, respectively [3, 4]. Berries from the 12 genotypes grown at all three sites were harvested in 2004, 2005, and 2006. Fruit from the additional genotypes at Corvallis was harvested in 2004 and 2005 only. All fruit was harvested at peak ripeness, placed in labeled plastic freezer bags, immediately frozen, and held at −20°C until analyzed at the USDA-ARS Wes Watkins Agricultural Research Laboratory at Lane, OK. All samples were analyzed within four months of harvest.
2.2. Fruit compositional analysis
Fruit samples of about 50 g were destemmed and thawed. Samples were pureed 1:1 wt/volume with double distilled (dd) water using a blender cup, then ground with a homogenizer equipped with a shear blade generator (Brinkmann Instruments, Westbury, NY). Aliquots of 0.5 ml puree were used to determine soluble solids concentration (SSC) using a digital refractometer (ATAGO USA, Bellevue, WA), and 10 ml were used to determine pH. Another 10 ml aliquot of puree was mixed with 90 ml dd water and titrated to an endpoint pH of 8.2 with 0.1 N sodium hydroxide by pH electrode. Titratable acidity (TA) expressed as citric acid was then calculated. The ratio of SSC/TA was calculated to determine the relative balance of sugars and acid.
2.3. Determination of total phenolic and anthocyanin contents, and bioactive compounds
An additional 0.5 g of puree was extracted using 10 ml of solvent (60% methanol, 3 % formic acid (95%), 37% distilled water) and filtered through Whatman no. 1 filter paper (GE Healthcare, Pittsburgh, PA) to remove seeds and fiber. Clarified extracts were used to determine total phenolic content (gallic acid equivalents; GAE) according to Singleton and Rossi [18]. In brief, one ml extract was mixed with one ml of 0.25 N Folin-Ciocalteau reagent in a glass 15 ml test tube, vortexed, let stand 3 min. One ml of sodium carbonate (1 N) was added to tube, vortexed, let stand 7 min, followed by addition of 7 ml distilled water. Reaction mixtures were held in the dark at room temperature (20–25°C) for 2 hours then absorbance measured by spectrophotometer (Shimadzu UV-Vis 160, Columbia, MD) at 765 nm using a gallic acid standard curve for quantification.
Total anthocyanin content (cyanidin-3-glucoside equivalents; C3GE) was determined by the pH differential method [11] using clarified extracts from above. Here, 1 ml of extract was added to 4 ml of pH 1.0 potassium chloride buffer (0.025 M) and 1 ml extract added to 4 ml of pH 4.5 sodium acetate buffer (0.4 M) into test tubes, capped, shaken, and held at room temperature for 1 hour. Absorbance at 520 and 700 nm (haze) were measured by spectrophotometer.
A subset of S. canadensis fruit samples (‘Adams 2’ and ‘Bob Gordon’ genotypes from 2005) was subjected to further analysis by high performance liquid chromatography (HPLC) with diode array detection. Individual polyphenolics other than anthocyanins (referred to as polyphenolics to be concise and easily distinguishable from total phenolic values) and anthocyanins were analyzed as described in Lee and Finn [10]. Hydroxycinnamic acids were expressed in chlorogenic acid, flavonol-glycosides in quercetin-3-rutinoside, and anthocyanins in cyanidin-3-glucoside (all three compounds from Sigma-Aldrich Co., St Louis, MO). Peak identifications did not differ from Lee and Finn [10].
2.4. Statistical analysis
Data were analyzed by univariate analysis of variance (general linear model) (SAS Institute, Cary, NC) to determine interactions among experimental treatments, and means separated by least significant difference test at the p ≤ 0.05 level. Pearson’s correlation coefficients were used to determine correlations among fruit characteristics; those characteristics that were highly correlated (>0.5) were subjected to linear regression to determine relationships.
3. Results and discussion
3.1. Environmental and genotype effects on composition
Means of variables (year, genotype, location) are presented in Table 1; all variable interactions were highly significant (p ≤ 0.01). Soluble solids content and TA were higher in Oregon fruit but total phenolics and anthocyanins content were lower compared to those of the Missouri locations. Among Missouri-grown fruit, those from Mt. Vernon had higher pH, SSC, SSC/TA, total phenolic content and lower TA compared to Mtn. Grove. The Mt. Vernon site had significantly lower fruit yields but larger individual berries compared with those from Mtn. Grove [7], perhaps due to less-than-ideal soil fertility at Mt. Vernon. Differences in fruit characteristics due to growing season only (across the 12 genotypes and the three diverse sites) were generally inconsistent across the three years. All sites were irrigated, which should have reduced moisture stress in year-to-year environmental effects. Among genotypes, TA was least in ‘Johns’, ‘Highway O’, and ‘Votra’ (Table 1). ‘Johns’ was also lowest in total phenolic and anthocyanin content but highest in SSC/TA. Among years of harvest, genotypes harvested in 2006 averaged the highest SSC, SSC/TA, total anthocyanins and total phenolics. Wild S. canadensis accessions selected from the midwestern U.S. and grown in Ohio, had generally lower levels of total phenolics (mean 390 mg/100 g) compared with levels across our three-location study (overall mean 595 mg/100 g), but were similar in levels of total anthocyanins [15].
Table 1.
Comparisons of fruit composition of 12 American elderberry genotypes harvested from two Missouri (MO) and one Oregon (OR) sites in 2004–2006
| Variable | n | pH | SSCz (%) | TA (g/100 ml citric acid) | SSC/TA | Total phenolics (mg/100 g GAE) | Total anthocyanins (mg/100 g C3GE) |
|---|---|---|---|---|---|---|---|
| Location (L) | |||||||
| Corvallis, OR | 64 | 4.81 by | 12.0 a | 0.63 a | 19.2 b | 542.8 c | 196.6 b |
| Mtn. Grove, MO | 190 | 4.80 b | 9.9 c | 0.58 b | 16.7 c | 593.6 b | 258.5 a |
| Mt. Vernon, MO | 176 | 5.08 a | 11.6 b | 0.44 c | 25.3 a | 614.4 a | 258.6 a |
| Genotype (GT) | |||||||
| Adams 2 | 42 | 4.91 cd | 11.6 ab | 0.63 a | 20.0 cd | 713.9 a | 300.0 b |
| Bob Gordon | 41 | 4.86 de | 11.1 b | 0.59 ab | 19.6 de | 648.6 b | 334.5 a |
| Competition 5 | 35 | 4.73 f | 12.2 a | 0.64 a | 20.3 cd | 609.2 d | 223.6 d |
| Eridu 1 | 35 | 4.77 ef | 11.3 b | 0.63 a | 18.5 ef | 642.4 bc | 327.5 a |
| Gordon E | 36 | 4.82 def | 11.3 b | 0.52 cd | 22.8 ab | 587.1 e | 246.2 c |
| Harris 4 | 35 | 4.84 def | 9.9 d | 0.62 a | 17.1 g | 615.7 cde | 300.2 b |
| Highway O | 29 | 5.20 a | 9.3 e | 0.50 de | 19.1 de | 603.9 de | 315.2 ab |
| Johns | 39 | 5.17 a | 10.4 c | 0.45 e | 24.9 a | 438.8 h | 99.5 e |
| Netzer | 38 | 4.91 cd | 12.2 a | 0.60 ab | 21.8 bc | 513.8 g | 115.5 e |
| Votra | 35 | 5.04 b | 10.4 de | 0.49 de | 22.3 ab | 560.6 f | 237.0 cd |
| Walleye | 30 | 5.00 bc | 11.1 b | 0.54 cd | 21.7 bc | 564.4 f | 159.9 de |
| Wyldewood | 35 | 4.83 def | 9.4 e | 0.56 bc | 18.0 f | 621.6 cd | 312.7 ab |
| Year (Y) | |||||||
| 2004 | 197 | 4.76 c | 10.7 b | 0.51 b | 21.2 b | 598.0 b | 225.2 b |
| 2005 | 117 | 5.15 a | 10.1 c | 0.57 a | 17.7 c | 569.7 c | 215.8 b |
| 2006 | 116 | 4.96 b | 12.1 a | 0.53 b | 22.4 a | 613.7 a | 325.7 a |
| Overall Mean | 430 | 4.92 | 10.91 | 0.53 | 20.6 | 594.5 | 249.7 |
Abbreviations: SSC = soluble solids concentration; TA = titratable acidity; GAE = gallic acid equivalents; C3GE = cyanidin-3-glucoside equivalents.
Means within subcolumns with the same letters are not significantly different according to the least-significant-difference test (p ≤ 0.05). All interactions (L × GT, L × Y, GT × Y, L × GT × Y) were significant (p ≤ 0.001).
When fruit means were averaged within genotype and location, and across years, TA values were always lowest from Mt. Vernon fruit for all genotypes (Table 2). Other fruit characteristics were dependent on location and genotype. SSC had the least variation with location, while anthocyanin was most variable. Total contents of phenolics and anthocyanins were generally higher in fruit from ‘Adams 2’, ‘Bob Gordon’, ‘Wyldewood’, and ‘Eridu 1’ across the study, as also reported by Lee and Finn [10]. Lee and Finn also reported that ‘Adams 2’ and ‘Bob Gordon’ had higher acylated anthocyanin levels than ‘Johns’ or ‘Netzer’. ‘Adams 2’, ‘Bob Gordon’, and ‘Wyldewood’ are vigorous, productive, and commercially available, and are widely planted in Missouri and the midwestern U.S. The similarity of fruit composition from these genotypes when grown in Missouri or Oregon suggests that they may have widespread usefulness as commercial elderberry cultivars.
Table 2.
Effects of location on genotype response for American elderberry fruit characteristics, averaged over three growing seasons (2004–2006)
| Genotype (GT) | Location (L) | n | pH | SSCz (%) | TA (g/100 ml citric acid) | SSC/TA | Total phenolics (mg/100 g GAE) | Total anthocyanins (mg/100 g C3GE) |
|---|---|---|---|---|---|---|---|---|
| Adams 2 | Corvallis | 10 | 4.58 cy | 12.6 a | 0.83 a | 16.0 b | 668.1 b | 392.4 a |
| Mtn. Grove | 16 | 4.86 b | 10.2 b | 0.63 b | 16.2 b | 699.4 ab | 265.1 b | |
| Mt. Vernon | 16 | 5.14 a | 12.6 a | 0.54 c | 26.0 a | 754.2 a | 283.1 b | |
| Competition 5 | Corvallis | 3 | 4.86 a | 11.9 a | 0.76 a | 15.6 a | 536.5 b | 140.5 b |
| Mtn. Grove | 16 | 4.56 b | 11.6 a | 0.74 a | 15.9 b | 649.7 a | 191.1 b | |
| Mt. Vernon | 16 | 4.87 a | 12.9 a | 0.51 b | 25.6 a | 582.4 b | 271.6 a | |
| Eridu 1 | Corvallis | 3 | 4.91 a | 13.1 a | 0.68 a | 19.4 c | 600.3 a | 183.4 b |
| Mtn. Grove | 16 | 4.61 b | 10.9 a | 0.69 a | 14.8 c | 666.5 a | 346.2 a | |
| Mt. Vernon | 16 | 4.91 a | 11.9 a | 0.55 b | 22.1 a | 626.2 a | 335.8 a | |
| Bob Gordon | Corvallis | 9 | 4.87 a | 11.4 b | 0.73 a | 16.7 b | 564.5 c | 226.1 c |
| Mtn. Grove | 16 | 4.71 c | 9.3 c | 0.59 b | 17.1 b | 643.6 b | 283.2 b | |
| Mt. Vernon | 16 | 5.00 a | 12.7 a | 0.52 c | 24.7 a | 701.0 a | 446.8 a | |
| Gordon E | Corvallis | 4 | 4.84 a | 11.6 a | 0.55 a | 21.2 b | 487.7 b | 76.5.0 c |
| Mtn. Grove | 16 | 4.70 b | 10.3 b | 0.56 a | 27.4 a | 583.0 a | 300.5 a | |
| Mt. Vernon | 16 | 4.93 a | 12.3 a | 0.46 b | 18.6 b | 615.9 a | 234.5 b | |
| Harris 4 | Corvallis | 3 | 4.75 b | 11.1 a | 0.77 a | 15.2 b | 616.5 a | 192.7 c |
| Mtn. Grove | 16 | 4.71 b | 9.2 b | 0.71 b | 15.0 b | 594.3 a | 259.6 b | |
| Mt. Vernon | 16 | 4.98 a | 10.5 a | 0.49 c | 18.3 a | 636.8 a | 361.1 a | |
| Highway O | Corvallis | 3 | 4.93 b | 9.9 a | 0.55 a | 18.0 b | 545.9 a | 185.3 b |
| Mtn. Grove | 16 | 5.07 b | 8.8 a | 0.53 a | 16.9 b | 621.4 a | 327.7 a | |
| Mt. Vernon | 10 | 5.48 a | 10.0 a | 0.44 b | 23.0 a | 545.9 a | 334.1 a | |
| Johns | Corvallis | 16 | 4.94 b | 12.1 a | 0.54 a | 24.6 b | 467.0 a | 127.9 a |
| Mtn. Grove | 14 | 5.33 a | 8.6 c | 0.40 b | 21.6 b | 371.0 b | 47.4 b | |
| Mt. Vernon | 9 | 5.34 a | 10.2 b | 0.36 b | 30.4 a | 494.4 a | 130.4 a | |
| Netzer | Corvallis | 5 | 4.80 b | 12.6 a | 0.74 a | 17.8 b | 450.7 b | 74.0 b |
| Mtn. Grove | 16 | 4.75 b | 12.0 a | 0.71 a | 17.4 b | 540.8 a | 152.7 a | |
| Mt. Vernon | 16 | 5.11 a | 12.2 a | 0.45 b | 27.4 a | 506.5 a | 91.3 b | |
| Votra | Corvallis | 3 | 4.66 c | 10.7 a | 0.71 a | 15.3 c | 513.7 a | 190.0 a |
| Mtn. Grove | 16 | 4.90 b | 9.7 a | 0.52 b | 18.8 b | 558.7 a | 254.7 a | |
| Mt. Vernon | 16 | 5.20 a | 11.0 a | 0.41 c | 27.1 a | 571.4 a | 228.1 a | |
| Walleye | Corvallis | 2 | 4.66 c | 11.4 a | 0.70 a | 16.9 b | 531.0 b | 214.6 a |
| Mtn. Grove | 16 | 4.91 b | 10.2 a | 0.57 b | 18.6 b | 530.8 b | 151.2 b | |
| Mt. Vernon | 12 | 5.20 a | 12.2 a | 0.47 c | 26.8 a | 614.9 a | 162.5 b | |
| Wyldewood | Corvallis | 3 | 4.67 b | 10.7 a | 0.73 a | 14.7 b | 574.4 a | 256.3 b |
| Mtn. Grove | 16 | 4.61 b | 8.9 b | 0.67 a | 13.4 b | 636.6 a | 383.9 a | |
| Mt. Vernon | 16 | 5.09 a | 9.5 ab | 0.41 b | 23.1 a | 615.5 a | 252.1 b |
Abbreviations: SSC = soluble solids concentration; TA = titratable acidity; GAE = gallic acid equivalents; C3GE = cyanidin-3-glucoside equivalents.
Means within genotype with the same letters are not significantly different according to Tukey’s honestly significant difference test (p ≤ 0.05). Interaction of GT × L significant (p ≤ 0.05) for all variables.
Among the 12 S. canadensis genotypes over locations and years, positive but weak correlations were found between SSC and anthocyanins or total phenolics (Table 3). Although elderberries with a lower pH were higher in SSC and TA, pH was not well correlated with total anthocyanin or total phenolics. The most significant correlation was for total anthocyanin and total phenolic content. A r2 of 0.67 was obtained when total phenolic and anthocyanin contents were regressed using means from genotype across years and sites, which increased to 0.81 when four outlying values were removed (Fig. 1). A correlation of 0.93 between total phenolic and anthocyanin content was reported for Midwest (Ohio)-grown elderberry, and yielded a linear regression fit of r2 = 0.85 [15]. The lower correlation of total anthocyanin to total phenolic content using Missouri and Oregon fruit may be due to different genotypes and conditions compared to those used in Ohio.
Table 3.
Pearson’s correlation coefficients for fruit composition variables of elderberries (Sambucus sp.) harvested from 12 genotypes at two Missouri and one Oregon sites across three growing seasons (2004–2006; n = 429)
| Variable | pH | TAz | SSC/TA | Total anthocyanins | Total phenolics |
|---|---|---|---|---|---|
| SSC | −0.06 | 0.04 | 0.55** | 0.34** | 0.42** |
| pH | −0.46** | 0.31** | −0.15** | −0.22** | |
| TA | −0.75** | 0.17** | 0.21** | ||
| SSC/TA | 0.013 | 0.05 | |||
| Total anthocyanin | 0.85** |
Abbreviations: SSC = soluble solids concentration; TA = titratable acidity.
Pearson’s correlation coefficients significant at p ≤ 0.01.
Fig. 1.
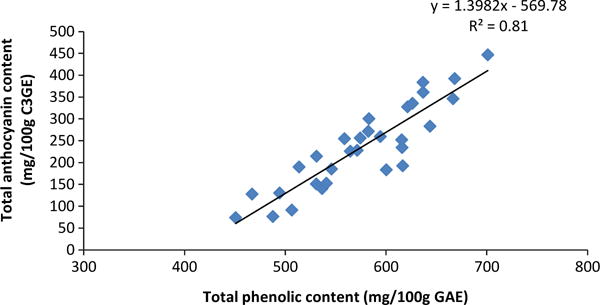
Comparison of total anthocyanins to total phenolic content in elderberries (Sambucus sp.), using means of each cultivar by location across three years. Standard deviations are 76.0 and 103.7 mg/100 g for total phenolic and anthocyanin contents, respectively. Four outlying values were removed.
To test the possibility that total anthocyanin differences might depend on berry size, total anthocyanin on a per-berry weight was calculated for the four elderberry genotypes that were common to all locations and had berry weights recorded for 2004 and 2005. Total anthocyanin content and anthocyanin per berry differed significantly only with ‘Adams 2’ grown at Mtn. Grove, where anthocyanin per berry was slightly less than ‘Netzer’ (data not shown). Since elderberries have pigment in the flesh and epidermis, effects of surface area and berry size may be less important than in blueberries, where pigment is primarily in the epidermis [11].
‘Adams 2’ and ‘Johns’ were developed over 80 years ago from wild germplasm in New York and Nova Scotia, respectively, whereas all other S. canadensis material in Table 1 was derived from wild midwestern U.S. germplasm. In general, as reported in Finn et al. [7], ‘Adams 2’ and ‘Johns’ did not perform as well in Missouri compared with the midwestern genotypes; however, ‘Johns’ significantly out-yielded most other genotypes at Corvallis. Across the present study (three sites and three years), ‘Adams 2’ yielded fruit with generally higher SSC, TA, total phenolics, and anthocyanins compared with most other cultivars, whereas fruit from ‘Johns’ were lower in these traits. We noted that ‘Johns’ puree was very prone to browning, which may have reduced total anthocyanin content, despite rapid processing on ice after thawing to avoid the browning. ‘Netzer’ fruit were brownish upon arrival and ‘Johns’ berries were more reddish rather than full purple, which may explain the lower total anthocyanin content of these genotypes relative to the others.
3.2. Genotypic differences in bioactive components among locations
Despite differences in overall content of total phenolics in the genotypes ‘Adams 2’ and ‘Bob Gordon’ shown in Tables 1 and 2, no genotypic differences were seen in total amounts of hydroxycinnamic acids, flavonol-glycosides, or acylated/non-acylated anthocyanins when extracts were subjected to HPLC analysis (Table 4). However, some distinct location differences were observed. Fruit from Corvallis had the highest level of flavonol-glycosides, but this value was not statistically different from that of Mt. Vernon fruit. In concordance with Tables 1 and 2, Mt. Vernon fruit were higher in total anthocyanins compared with Corvallis, and more specifically, ‘Bob Gordon’ produced fruit with higher anthocyanin levels across sites. Acylated and non-acylated anthocyanins were higher at Mt. Vernon than both other locations. In contrast, Mtn. Grove elderberries were lowest in hydroxycinnamic acids and flavonol-glycosides.
Table 4.
Polyphenolic and anthocyanin analyses (by HPLC) of fruit from ‘Adams 2’ and ‘Bob Gordon’ elderberry (S. canadensis) grown in 2005 at two Missouri and one Oregon location
| Variable | n | pH | SSCz (%) |
TA (g/100 ml citric acid) |
Total hydroxy- cinnamic acidsy |
Total flavonol- glycosidesx |
Total polyphenolicsw |
Total non-acylated anthocyaninsv |
Total acylated antho-cyaninsv |
Total antho- cyaninsv |
|---|---|---|---|---|---|---|---|---|---|---|
| Genotype (GT) | ||||||||||
| Adams 2 | 11 | 4.74 | 9.9 | 0.63 | 3.0 au | 441.0 a | 47.1 a | 61.4 a | 397.7 a | 458.1 a |
| Bob Gordon | 11 | 4.93 | 10.9 | 0.70 | 2.5 a | 32.0 a | 34.5 a | 84.7 a | 376.4 a | 461.1 a |
| Location (L) | ||||||||||
| Corvallis | 6 | 4.68 a | 10.1 a | 0.66 a | 2.6 a | 55.0 a | 57.6 a | 60.6 b | 348.2 b | 408.8 b |
| Mt. Vernon | 8 | 4.88 b | 10.8 a | 0.65 a | 4.0 a | 38.0 ab | 42.0 ab | 107.1 a | 466.2 a | 573.3 a |
| Mtn. Grove | 8 | 4.68 a | 9.7 a | 0.68 a | 1.6 a | 25.3 b | 26.9 b | 48.3 b | 335.7 b | 384.1 b |
| GT × L | 22 | NSt | NS | NS | NSv | NS | NS | ** | NS | * |
Abbreviations: SSC = soluble solids concentration; TA = titratable acidity.
Values expressed as mg/100 g chlorogenic acid.
Values expressed as mg/100 g quercetin-3-rutinoside.
Total hydroxycinnamic acids + total flavonol-glycosides.
Anthocyanin values expressed as mg/100 g cyanidin-3-glucoside.
Means within subcolumns with the same letters are not significantly different according to the least-significant-difference test (p ≤ 0.05).
NS, *, **: Interactions not significant (p ≤ 0.05), or significant at the p ≤ 0.05 and 0.01 levels, respectively.
Sambucus canadensis berries contain large amounts of cyanidin with sambubiosides, and the ratio of acylated to non-acylated cyanidin-based anthocyanin is about 2 to 1 in most of the genotypes studied [10]. Sambucus nigra berries, which lack acylated anthocyanins, were found to increase in total anthocyanin content with altitude in Europe, although cyanidin-3-glucoside decreased with increased altitude [16]. Alteration in anthocyanin composition due to the differences in sunlight and temperature exposures has been demonstrated in ‘Merlot’ grapes (Vitis spp.) [19]. Additional work needs to be conducted to clarify these trends in elderberries at these locations. The proportion of acylated pigments in intact elderberries varied greatly between production years [10] and indicates potential for tailored anthocyanin quality once key environmental triggers are identified.
The average ripening time for elderberries was 40 to 60 d in Missouri locations and 50 to 65 d in Corvallis (Fig. 2). Mean temperatures (max/min) show that minimum (night) temperatures in Missouri were about 5°C higher through bloom to ripening while maximum temperatures in Oregon were 4°C lower than those in Missouri at bloom then increased to meet those in Missouri just before ripening. Total annual rainfall among sites was similar (ca 1000 mm) [7]. The low yields and relatively poor fruit quality of ‘Johns’ and ‘Netzer’ genotypes produced under irrigation in Missouri and Oregon locations, respectively, [7] indicate that lack of irrigation will likely further decrease yield and fruit quality of sensitive genotypes.
Fig. 2.
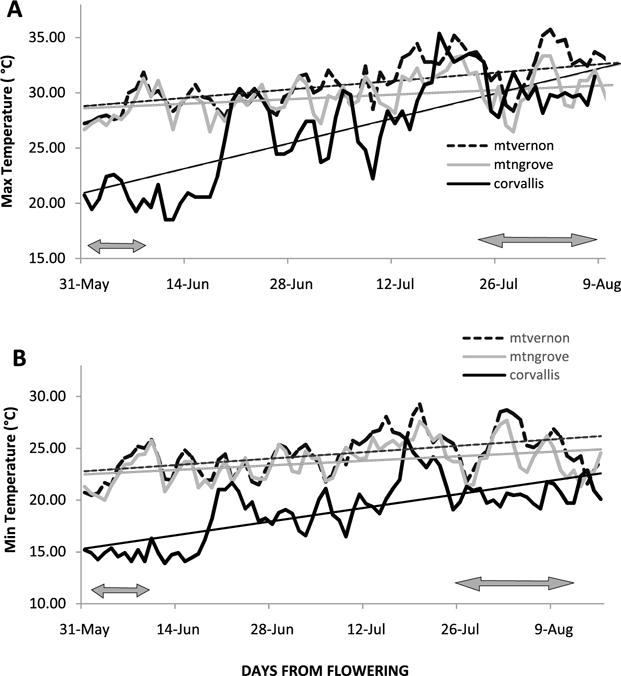
Air temperatures at elderberry production sites (Mt. Vernon and Mtn. Grove, MO; and Corvallis, OR), averaged over three years (2004–2006) for maximum (A) and minimum (B) temperatures. Lines represent means of daily temperatures during bloom and ripening periods. Arrows represent peak bloom and first harvest dates, respectively.
3.3. Comparison of composition of elderberry species grown in Oregon
Comparisons of fruit characteristics from S. canadensis and S. nigra genotypes grown at Corvallis in 2004 and 2005 are presented in Table 5. Total phenolic and total anthocyanin contents were similar among the two species and across the two growing seasons, while all other characteristics differed. Sambucus nigra fruit were significantly lower in pH and SSC, and higher in TA compared with S. canadensis fruit. In a separate laboratory study, Lee and Finn [10] evaluated both species of fruit from the same Oregon elderberry plots harvested the same two years as the current study. Levels of fruit characteristics between the two studies were generally similar, with S. nigra having a lower pH and higher TA compared with S. canadensis, and while not differing significantly in levels of phenolics and anthocyanins between the two species. As discussed earlier, and as shown in Finn et al. [7], characteristics of elderberry fruit are often inconsistent from year to year within the same planting, presumably because of environmental differences across growing seasons; in this case all characteristics except SSC differed between the two growing seasons. However, despite the genetic and morphological differences between the two species, no significant interactions between species and year were observed.
Table 5.
Comparison of characteristics from American elderberry (S. canadensis) with European elderberry (S. nigra) fruit harvested at Corvallis, Oregon, 2004–2005
| Variable | n | pH | SSC (%) | TA (g/100 ml citric acid) | SSC/TA | Total anthocyanins (mg/100 g C3GE) | Total phenolics (mg/100 g GAE) |
|---|---|---|---|---|---|---|---|
| Species | |||||||
| S. canadensis | 152 | 4.60 az | 10.8 a | 0.77 b | 14.4 a | 196.5 a | 514.2 a |
| S. nigra | 32 | 4.09 b | 10.2 b | 1.35 a | 7.5 b | 206.5 a | 521.1 a |
| Year | |||||||
| 2004 | 97 | 4.43 b | 10.5 a | 1.00 a | 11.3 b | 183.7 b | 526.3 a |
| 2005 | 87 | 4.59 a | 10.8 a | 0.73 b | 15.4 a | 214.3 a | 503.2 b |
| Species × Year | 184 | NSy | NS | NS | NS | NS | NS |
Means within subcolumns with the same letters are not significantly according to the least significant difference test (p ≤ 0.05).
NS: not significant (p ≤ 0.05).
4. Conclusions
Elderberries grown in Missouri were generally higher in total anthocyanin and phenolic content compared with those from Oregon. In contrast, soluble solids content and acidity were higher in Oregon fruit. As found in other studies, elderberry fruit characteristics are highly responsive to environmental and genetic factors, although clear and consistent patterns were difficult to discern. This responsiveness should lend itself to further development and refinement of elderberry as a commercial crop.
Acknowledgments
We thank the USDA-Agricultural Research Service (ARS) CRIS numbers 5358-21000-041-00D, 5358-21000-037-00D and Northwest Center for Small Fruits Research for funding as well as Mary Peterson, Ted Mackey, Chris Rennaker, Sheila Magby, and Brian Yorgey for their technical assistance with this project. This publication was made possible by Grant Number P50AT006273 from the National Center for Complementary and Alternative Medicines (NCCAM), the Office of Dietary Supplements (ODS), and the National Cancer Institute (NCI). Its contents are solely the responsibility of the authors and do not necessarily represent the official views of the NCCAM, ODS, NCI, or the National Institutes of Health. Mention of trade names or commercial products in this publication is solely for the purpose of providing specific information and does not imply recommendation or endorsement by the U.S. Department of Agriculture.
References
- 1.Barak V, Birkenfeld S, Halperin T, Kalickman I. The effect of herbal remedies on the production of human inflammatory and anti-inflammatory cytokines. Isr Med Assoc J. 2002;4(11 Suppl):919–22. [PubMed] [Google Scholar]
- 2.Craker LE, Gardner Z. Dietary supplements: The new herbalism. HortTechnology. 2003;13:239–42. [Google Scholar]
- 3.Byers PL, Thomas AL, Millican M. ‘Wyldewood’ Elderberry. HortScience. 2010;45:32–13. [Google Scholar]
- 4.Byers PL, Thomas AL. ‘Bob Gordon’ Elderberry. J Am Pomol Soc. 2011;65:52–5. [Google Scholar]
- 5.Charlebois D, Byers PL, Finn CE, Thomas AL. Elderberry: Botany, horticulture, potential. Hortic Rev. 2010;37:213–80. [Google Scholar]
- 6.Drapeau R, Charlebois D. American elder cultivation under cold climates: Potential and limitations. Can J Plant Sci. 2012;92:473–84. [Google Scholar]
- 7.Finn CE, Thomas AL, Byers PL, Serçe S. Evaluation of American (Sambucus canadensis) and European (S. nigra) elderberry genotypes grown in diverse environments and implications for cultivar development. HortScience. 2008;43:1385–91. [Google Scholar]
- 8.Giusti MM, Wrolstad RE. Anthocyanins: Characterization and measurement with UV-visible spectroscopy. In: Wrolstad RE, editor. Current Protocols in Food Analytical Chemistry. John Wiley & Sons; NY: 2001. [Google Scholar]
- 9.Kaack K, Fretté XC, Christensen LP, Landbo AK, Meyer AS. Selection of elderberry (Sambucus nigra L.) genotypes best suited for the preparation of juice. Eur Food Res Technol. 2008;226:843–55. [Google Scholar]
- 10.Lee J, Finn CE. Anthocyanins and other polyphenolics in American elderberry (Sambucus canadensis) and European elderberry (S. nigra) cultivars. J Sci Food Agr. 2007;87:2665–75. doi: 10.1002/jsfa.3029. [DOI] [PubMed] [Google Scholar]
- 11.Lee J, Wrolstad RE. Extraction of anthocyanins and polyphenolics from blueberry processing waste. J Food Sci. 2004;69:C564–73. [Google Scholar]
- 12.Mohebalian PM, Cernusca MM, Aguilar FF. Discovering niche markets for elderberry juice in the United States. HortTechnology. 2012;22:556–66. [Google Scholar]
- 13.Mikulic-Petkovsek M, Slatnar A, Stampar F, Veberic R. HPLC-MS identification and quantification of flavonol glycosides in 28 wild and cultivated berry species. Food Chem. 2012;135:2138–46. doi: 10.1016/j.foodchem.2012.06.115. [DOI] [PubMed] [Google Scholar]
- 14.Nakatani N, Kikuzak H, Hikida J, Ohba M, Inami O, Tamura I. Acylated anthocyanins from fruits of Sambucus canadensis. Phytochem. 1995;3:755–7. doi: 10.1016/0031-9422(94)00700-4. [DOI] [PubMed] [Google Scholar]
- 15.Özgen M, Scheerens JC, Reese RN, Miller RA. Total phenolics, anthocyanin contents and antioxidant capacity of selected elderberry (Sambucus canadensis L.) accessions. Pharmacogn Mag. 2010;6:198–203. doi: 10.4103/0973-1296.66936. [DOI] [PMC free article] [PubMed] [Google Scholar]
- 16.Rieger G, Müller M, Guttenberger H, Bucar F. Influence of altitudinal variation on the content of phenolic compounds in wild populations of Calluna vulgaris, Sambucus nigra, and Vaccinium myrtillus. J Agric Food Chem. 2008;56:9080–6. doi: 10.1021/jf801104e. [DOI] [PubMed] [Google Scholar]
- 17.Roschek B, Jr, Fink RC, McMichael MD, Li D, Alberte RS. Elderberry flavonoids bind to prevent H1N1 infection in vitro. Phytochemistry. 2009;70:1255–61. doi: 10.1016/j.phytochem.2009.06.003. [DOI] [PubMed] [Google Scholar]
- 18.Singleton VL, Rossi JA., Jr Colorimetry of total phenolics with phosphomolybdic-phosphotungstic acid reagents. Am J Enol Vitic. 1965;16:144–58. [Google Scholar]
- 19.Tarara JM, Lee J, Spayd SE, Scagel CF. Berry temperature and solar radiation alter acylation, proportion, and concentration of anthocyanin in Merlot grapes. Am J Enol Vitic. 2008;59:235–47. [Google Scholar]
- 20.Thomas AL, Byers PL, Finn CE, Chen YC, Rottinghaus GE, Malone AM, Applequist WL. Occurrence of rutin and chlorogenic acid in elderberry leaf, flower, and stem in response to genotype, environment, and season. Acta Hortic. 2008;765:197–206. [Google Scholar]
- 21.Thomas AL, Byers PL, Ellersieck MR. Productivity and characteristics of American elderberry in response to various pruning methods. HortScience. 2009;44:671–7. [Google Scholar]
- 22.Veberic R, Jakopic J, Stampar F, Schmitzer V. European elderberry (Sambucus nigra L.) rich in sugars, organic acids, anthocyanins and selected polyphenols. Food Chem. 2009;114:511–5. [Google Scholar]
- 23.Wu X, Gu L, Prior R, McKay S. Characterization of anthocyanins and proanthocyanidins in some cultivars of Ribes, Aronia, and Sambucus and their antioxidant capacity. J Agric Food Chem. 2004;52:7846–56. doi: 10.1021/jf0486850. [DOI] [PubMed] [Google Scholar]
- 24.Zakay-Rones Z, Varsano N, Zlotnik M, Manor O, Regev L, Schlesinger M, Mumcuoglu M. Inhibition of several strains of influenza virus in vitro and reduction of symptoms by an elderberry extract (Sambucus nigra L.) during an outbreak of influenza B Panama. J Altern Complementary Med. 1995;1:361–9. doi: 10.1089/acm.1995.1.361. [DOI] [PubMed] [Google Scholar]