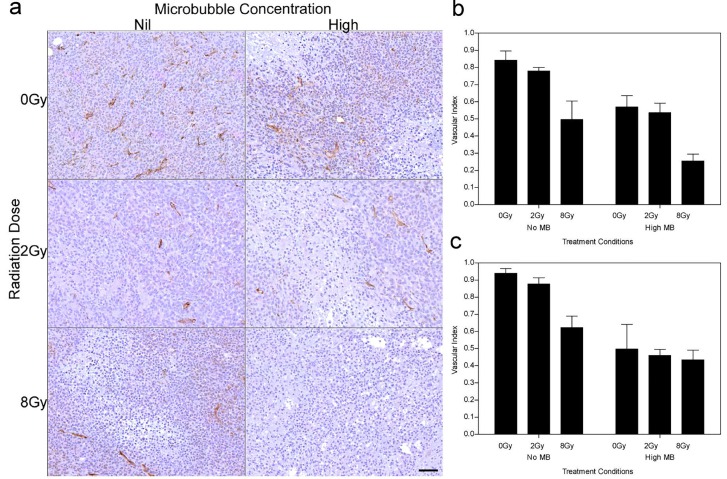
Figure 3. CD31 stained tumors showing microvascular disruption after treatment.
(a) High magnification stained histological sections of treated tumors (24 h cohort). Vascular indices determined from the CD31 results, for each treatment condition, are summarized for the (b) 12 h and (c) 24 h studies. The scale bar denotes 50μm. Obtained at magnification = 80×.

