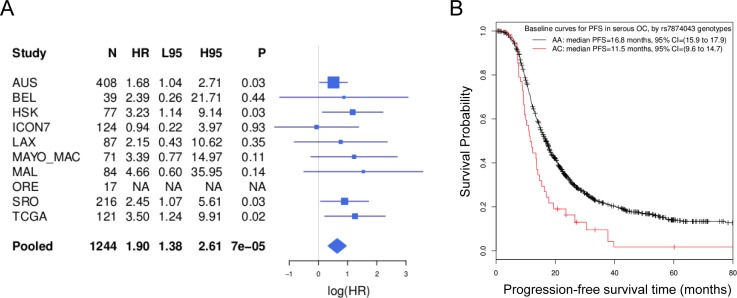
Figure 2. Association with PFS in serous EOC patients.
A. Associations between the TTC39B SNP rs7874043 and PFS in individual studies (rows denoted by study names), and the overall association pooling all samples together while stratifying for studies (the row denoted by “Pooled”). “HR” indicates the point estimates of hazard ratio. “L95” and “H95” represents its lower and upper 95% confidence intervals. “NA” indicates no minor allele was found in the eligible cases. The forest plot on the right is on the log scale. B. Baseline survival curves of the two genotypes (AA vs AC) of rs7874043 in a stratified Cox regression, assuming all other prognostic factors at mean values. Patients with CC genotypes were not observed due to the low minor allele frequency of rs7874043. The survival curves were truncated at 80 months as only a few events occurred after that.

