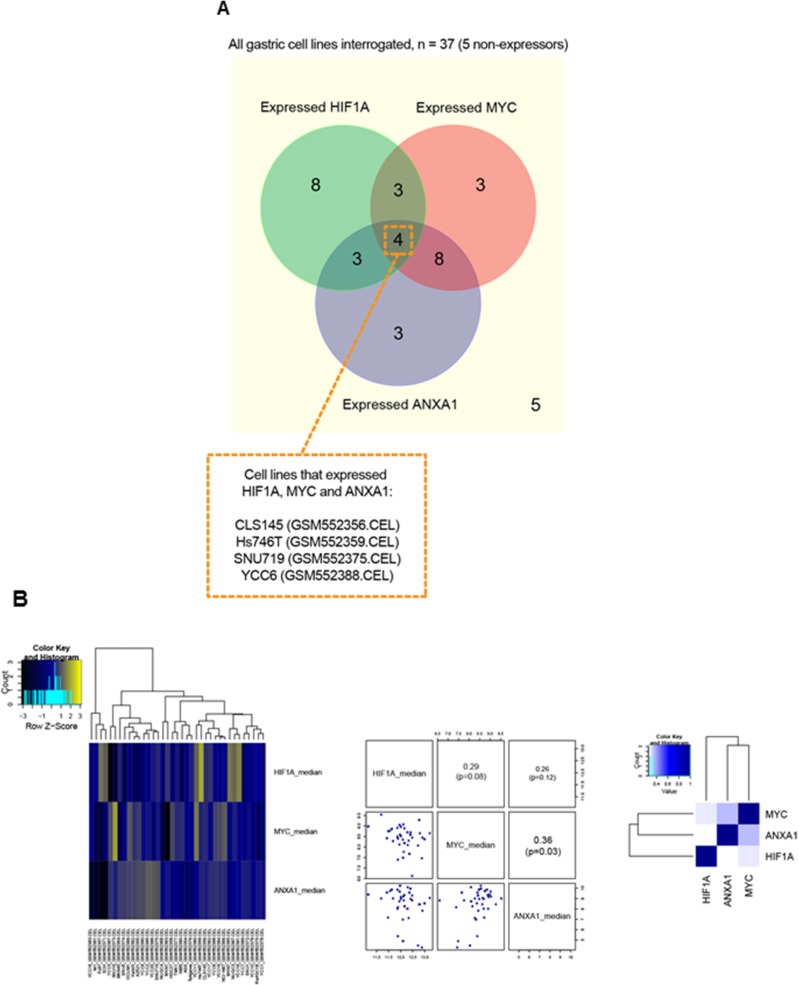
Figure 7. Comparative analysis of HIF1A, ANXA1 and MYC expression in gastric cancer cell lines.
(A) A Venn diagram to illustrate the cell line samples with overlap of expression for HIF1A and/or ANXA1 and/or MYC. As shown, four cell lines, namely CLS145, Hs746T, SNU719 and YCC6, expressed all 3 genes (i.e. HIF1A, ANXA1 and MYC). Generally, HIF1A and/or ANXA1 expressors show expression mutual exclusivity. (B) Heatmap (left) shows results of hierarchical clustering of HIF1A, MYC and ANXA1 gene expression across the 37 cell line samples. In general, apart from co-expression pattern seen for MYC and ANXA1, most of the gene-pairs appeared to have patterns of expression mutual exclusivity. A pairs-plot (middle) and a correlation-matrix heatmap (right) further support these findings i.e. a significant correlation (p < 0.05) for co-expression was found only for MYC and ANXA1.

