Abstract
Background
The large conductance Ca+2 – and voltage-activated K+ channel (BK) is an important player in molecular and behavioral alcohol tolerance. Trafficking and surface expression of ion channels contribute to the development of addictive behaviors. We have previously reported that internalization of the BK channel is a component of molecular tolerance to EtOH.
Methods
Using primary cultures of hippocampal neurons, we combine total internal reflection fluorescence (TIRF) microscopy, electrophysiology and biochemical techniques to explore how exposure to EtOH affects the expression and subcellular localization of endogenous BK channels over time.
Results
Exposure to EtOH changed the expression of endogenous BK channels in a time-dependent manner at the perimembrane area (plasma membrane and/or the area adjacent to it), while total protein levels of BK remain unchanged. These results suggest a redistribution of the channel within the neurons rather than changes in synthesis or degradation rates. Our results showed a temporally nonlinear effect of EtOH on perimembrane expression of BK. First, there was an increase in BK perimembrane expression after 10-min of EtOH exposure that remained evident after 3-hrs, though not correlated to increases in functional channel expression. In contrast, after 6-hrs of EtOH exposure we observed a significant decrease in both BK perimembrane expression and functional channel expression. Furthermore, after 24-hrs EtOH exposure, perimembrane levels of BK had returned to baseline.
Conclusion
We report a complex time-dependent pattern in the effect of EtOH on BK channel trafficking, including successive increases and decreases in perimembrane expression and a reduction in active BK channels after 3 and 6-hrs of EtOH exposure. Possible mechanisms underlying this multiphasic trafficking are discussed. Since molecular tolerance necessarily underlies behavioral tolerance, the time-dependent alterations we see at the level of the channel may be relevant to the influence of drinking patterns on the development of behavioral tolerance.
Keywords: tolerance, alcohol, ethanol, hippocampus, BK channel, trafficking
Introduction
The large conductance Ca+2 – and voltage-activated K+ channel (BK) is ubiquitously expressed in the nervous system and is an important modulator of neuronal function. It has been reported to modulate neuronal excitability (Petrik, Wang, & Brenner, 2011), firing rate (Ly, Melman, Barth, & Ermentrout, 2011) and neurotransmitter release (Raffaelli, Saviane, Mohajerani, Pedarzani, & Cherubini, 2004). The BK channel is composed of the pore forming α-subunit, which has several splice isoforms deriving from the same gene, Slo. The Zero (or Insertless) isoform has been well-characterized for its sensitivity to EtOH within the physiological concentration range (25mM, which approximates the legal intoxication level) (Feinberg-Zadek, Martin, & Treistman, 2008; Pietrzykowski et al., 2008). Acute EtOH increases the activity of the channel by increasing the time spent in the open conformation. Yet, within minutes, the channel becomes desensitized in the presence of EtOH, thus demonstrating acute tolerance (Pietrzykowski et al. 2004). The channel can be associated with one of four different β-subunits, which regulate its function and surface expression (β1–β4). KO mice in which β4 was missing developed acute tolerance, in contrast to wild type mice, and showed an increased EtOH consumption in comparison to wild type mice. These effects highlighted the importance of the BK channel in the molecular processes underlying behavioral tolerance to alcohol (G. E. Martin et al., 2008).
Ion channel trafficking and addiction
BK molecular EtOH tolerance is defined by specific adaptations of the channel as a function of EtOH exposure (Pietrzykowski & Treistman, 2008). One of the hallmarks of BK channel molecular tolerance to EtOH involves a redistribution of the channel, resulting in a net transfer of BK from the plasma membrane compartment to the interior of the neuron (Knott, Dopico, Dayanithi, Lemos, & Treistman, 2002; Pietrzykowski et al., 2004). Indeed, this internalization of the channel serves as a means of tolerance by essentially removing the BK channel from its arena of action. While the mechanism of this transfer has not been fully elucidated, it certainly will involve aspects of trafficking.
Drugs of abuse such as EtOH disturb the trafficking balance of receptors and ion channels like GABA receptors (Liang et al., 2007) and L-type Ca+2 channels (Ford, Wolf, & Hu, 2009). Moreover, a study recently published (Munoz and Slesinger, 2014) reported an important link between changes in the trafficking and surface expression of G protein-gated inwardly rectifying K+ (GIRK) channels and the behavioral response to cocaine, an addictive drug (Munoz & Slesinger, 2014). Importantly, a number of studies have implicated BK auxiliary proteins in the trafficking and the alcohol sensitivity of the channel (Feinberg-Zadek et al., 2008; Shruti et al., 2012; Velàzquez-Marrero, Seale, Treistman, & Martin, 2014). The presence of the beta subunits β1 and β4 can significantly affect the EtOH pharmacology of BK within individual neurons (G. Martin et al., 2004). Interestingly, results have differed depending upon the drinking paradigm used (Kreifeldt, Le, Treistman, Koob, & Contet, 2013).
The present study is the first to show the perimembrane expression and distribution of endogenous BK channels by TIRF microscopy. TIRF microscopy has one of the highest resolutions in the z-plane among light microscopy techniques making it an ideal technique to study perimembrane related phenomena (Axelrod, 2001; Roman-Vendrell & Yudowski, 2015). Here, we used TIRF microscopy to visualize the localization and trafficking of endogenous BK channels at the cell perimembrane area. In combination with electrophysiological and biochemical approaches, we describe how EtOH exposure modulates the expression of endogenous BK channels in a time-dependent manner in hippocampal neurons. We demonstrate a redistribution of BK channels with successive increases and decreases in perimembrane population. Our results not only contribute to our understanding of the cellular processes and the time-dependent changes that lead to molecular and behavioral tolerance, but also form a basis for future research to examine other functional consequences of such changes in trafficking dynamics.
Materials and Methods
Primary hippocampal culture
Cultures were prepared from E18 rat hippocampal tissue (BrainBits, LLC. Springfield, IL) as previously described (Grabham, Seale, Bennecib, Goldberg, & Vallee, 2007). Briefly, dissociated neurons were plated at a density of ~200 cells/μm2 on 35 mm glass-bottom dishes (MatTek Corporation, Ashland, MA; for TIRF imaging glass thickness = 0.175 +/− 0.01 mm), pre-coated overnight at 4°C with 0.5 mg/ml poly-D-lysine (Sigma, St. Louis, MO). Hippocampal neurons for Western blot experiments were plated in 100 mm Primaria cell culture dishes (Corning Inc., Corning, NY) at ~1–2 million cells per dish. Dissociated neurons were plated and allowed to attach for ~3-hrs in DMEM media supplemented with HI-FBS (Life Technologies, Grand Island, NY). Media was then replaced with Neurobasal media supplemented containing B-27 (Life Technologies, Grand Island, NY). Cultures were maintained in a 37°C incubator with 5% CO2.
Treatments were performed on neurons 6–9 days in vitro (DIV) using 25 mM EtOH concentration (Sigma, St. Louis, MO). Cultures were kept in a 5% CO2 and 37°C incubator. EtOH exposure times included: 10-min, 3-hrs, 6-hrs and 24-hrs. To maintain an EtOH-saturated environment throughout incubation periods, all dishes treated with EtOH were kept in a secondary container with one open 35 mm tissue culture dish containing 25 mM ethanol in sterile water. Untreated controls had an EtOH-free media change.
Immunofluorescence
The BK channel was fluorescently tagged through an immunofluorescence protocol with rabbit anti α-subunit antibody (APC107; Alomone Labs, Jerusalem, Israel), followed by Alexa-594 conjugated secondary antibody (Jackson ImmunoResearch, West Grove, PA). Briefly, neurons were incubated for 10-min with cold cholera toxin subunit-B conjugated to Alexa-488 (Life Technologies, Grand Island, NY). Dishes were fixed with cold 4% PFA (Electron Microscopy Sciences, Hatfield, PA) 4% sucrose (Sigma, St. Louis, MO) for 15-min. Permeabilization was then performed with 0.05% saponin (Sigma, St. Louis, MO). Neuronal dishes were blocked for 30-min RT with 5% BSA, 5% NDS in 1×PBS Na Azide and 0.005% saponin, followed by overnight incubation with primary antibody in 1/10 blocking solution at 4°C. The secondary was incubated for 1-hr RT in 1/10 blocking solution.
TIRF imaging and analysis
BK perimembrane localization was determined by TIRF microscopy. Imaging was performed as described before (Guillermo A Yudowski & von Zastrow, 2011) with a Nikon Ti-E inverted microscope (Melville, NY) using a CFI-APO 100× oil immersion TIRF objective (NA=1.49) with a 0.5× optical magnification. Image acquisition was performed at 10Hz by using an iXonEM+ DU897 back-illuminated EMCCD camera (Andor, Belfast, UK) and AR-NIS Elements Software (Nikon). As light source, Coherent sapphire lasers 488- and 561-nm (Coherent Inc., Santa Clara, CA) were used and focused on the back focal plane (to ensure a collimated laser beam) before each imaging session. Only isolated neurons with the characteristic morphology of hippocampal pyramidal neurons and with an integral membrane were imaged. Imaging parameters were kept constant for all images. The images were analyzed using the NIH public domain ImageJ Software v1.43μ. All images were background subtracted and corrected for flat field. A Student t-test analysis between each control and treated group was done using Graph Pad Prism Software (La Jolla, CA). Mean intensity of BK labeling was measured for each cell and the results were expressed as % change from control average (results were normalized to the untreated control average).
TIRF live-cell imaging was performed using phenol red-free Neurobasal® media (Life Technologies, Grand Island, NY) on a temperature controlled objective and imaging chamber set at 37°C (Bioptechs, Butler, PA). Neurons were imaged 24–72-hrs after transfection (Roman-Vendrell & Yudowski, 2015).
Construct and transfection
BK-mGFP (OriGene Technologies, Rockville, MD) was generated by fusing the monomeric GFP (mGFP) at the C-terminal of the ORF of the BK channel (accession number NM_001161352) in a pCMV-AC-mGFP vector. Hippocampal neurons 4–7 DIV were transfected with Lipofectamine® 2000 transfection reagent (Life Technologies, Grand Island, NY) using the protocol described in (Wells et al., 2001).
Western blot
Neurons were lysed in cold RIPA lysis buffer (Sigma, St. Louis, MO) with protease inhibitor cocktail (Sigma, St. Louis, MO). The supernatants were loaded and run through 4–20% Mini-Protean TGX pre-cast gels (BioRad, Hercules, Ca) and then transferred onto nitrocellulose membranes using the Trans-Blot Turbo transfer system (BioRad, Hercules, Ca). The membranes were incubated with mouse anti-GAPDH (Ambion® Life Technologies, Grand Island, NY; 1:4,000) and rabbit anti-BK α-subunit. Appropriate secondary antibodies from the Odyssey system were used to enable dual fluorophore membrane imaging on an Odyssey Classic Infrared Imaging System (LI-COR, Lincoln, NE; 1:15,000). Each EtOH treatment had at least three independent experiments. Measurements were performed using ImageJ software. Values were obtained by calculating the percent change from control for each control/treated sample pair after GAPDH normalization. Statistical analysis was done using Graph Pad Prism Software.
Electrophysiology
Whole-cell recordings
Using the standard whole-cell patch-clamp re-cording method (Hamill, Marty, Neher, Sakmann, & Sigworth, 1981), the membrane was depolarized to various potentials for 500ms from a holding potential of −60mV. Current density measurements were obtained by dividing the current at non-saturating voltages by the slow capacitance compensation. In all cases, no significant changes in V1/2 or single channel conductance were observed. We recorded single channels in the inside-out and cell-attached patch-clamp configuration. All solutions and variations were done as previously published (Velázquez-Marrero et al., 2011).
Data Acquisition
Recording electrodes designed as described in (Velázquez-Marrero et al., 2011). Currents were recorded in voltage-clamp mode, EPC10 amplifier (HEKA Elektronik, Lambrecht/Pfalz, Germany) at a sampling rate of 5 kHz and 10 kHz for whole-cell and single-channel recordings respectively, and low-pass filtered at 3 and 2 kHz, respectively.
Results
TIRF imaging of endogenous BK channels in the plasma membrane of hippocampal neurons
We first established the feasibility of using TIRF microscopy to visualize endogenous BK channels at the perimembrane area. TIRF microscopy after immunofluorescent labeling of hippocampal neurons showed a punctate expression of endogenous BK channels in the somatic plasma membrane (Fig. 1A). Two populations of perimembrane BK channels were clearly seen: bright puncta representing the aggregated or clustered channel, and diffuse staining representing the non-clustered population of BK channels, as previously described (Fig. 1B) (Kaufmann, Kasugai, Ferraguti, & Storm, 2010). Measurements of cluster size showed a skewed distribution with an average cluster size of 0.130 μm2 (± 0.003) and a median of 0.08 μm2 (Fig. 1C). This distribution was similar to that reported for BK channel clusters in hippocampal neurons obtained by other microscopy techniques (Kaufmann et al., 2010).
Figure 1.
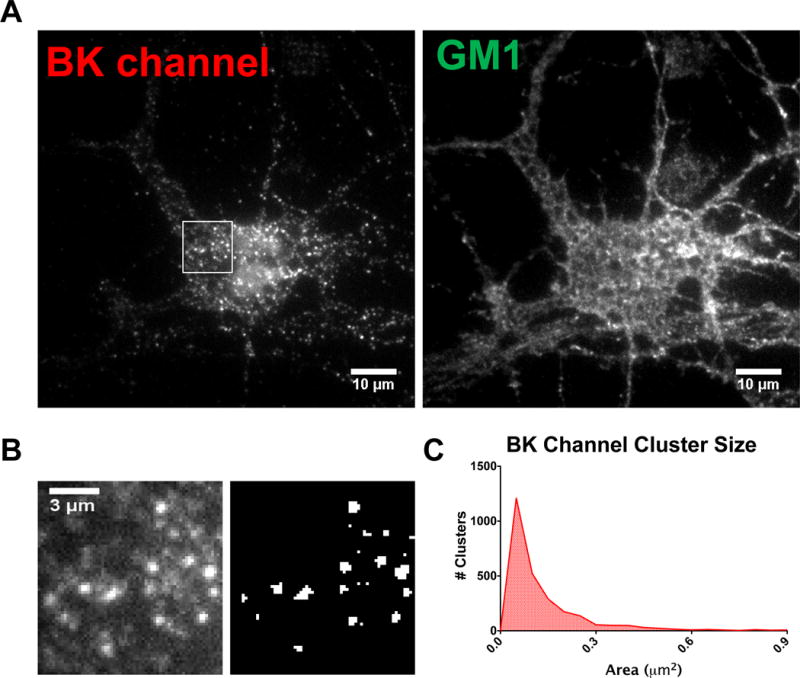
TIRF imaging of BK channels in hippocampal neurons. Representative TIRF images showing BK perimembrane expression in clusters and diffuse localization in hippocampal neurons. (A) Left: TIRF imaging of endogenous BK channels after immunofluorescence, right: GM1 staining showing the outline of the neuron. (B) Measurements of clusters. Left: higher magnification view of the boxed area in (A). Note the bright puncta (clusters) and diffuse staining, Right: binary image showing thresholding used for measuring clusters. (C) Histogram showing the size distribution of BK channel clusters (2618 clusters were quantified from 134 neurons).
The fixation or permeabilization used in immunofluorescent techniques can lead to artifacts in the localization of a protein, due to problems with epitope accessibility, protein extraction or re-localization (Stadler, Skogs, Brismar, Uhlén, & Lundberg, 2010; Tanaka et al., 2010). We have addressed this potential artifact by supplementing TIRF data with live-cell microscopy. Imaging from a live preparation does not require fixation and permeabilization; we compared these results with those obtained by immunofluorescence. We designed an mGFP tagged BK channel construct for live cell imaging. The BK-mGFP construct, expressed in HEK 293 cells, showed the conductance and Ca+2 sensitivity characteristic of native BK channels (supplemental Fig. 1). When the BK-mGFP protein was expressed in hippocampal neurons it showed a similar perimembrane distribution to that of the endogenous BK channel, with clustered and non-clustered populations (Fig. 2A). Furthermore, live cell imaging analysis revealed that the bright puncta seen in hippocampal neurons were static through our imaging acquisition (Fig. 2B&C). Figure 2D shows a magnified view of the cell body of the transfected neuron, where clusters and diffuse fluorescence can be distinguished. After analyzing the cluster size of BK-mGFP we saw a skewed distribution similar to that of endogenous BK channels (Fig. 2E). The average size of clusters was 0.190 m2 (± 0.008), comparable to the endogenous population. Thus, live cell imaging data corroborated the data obtained by immunofluorescence.
Figure 2.
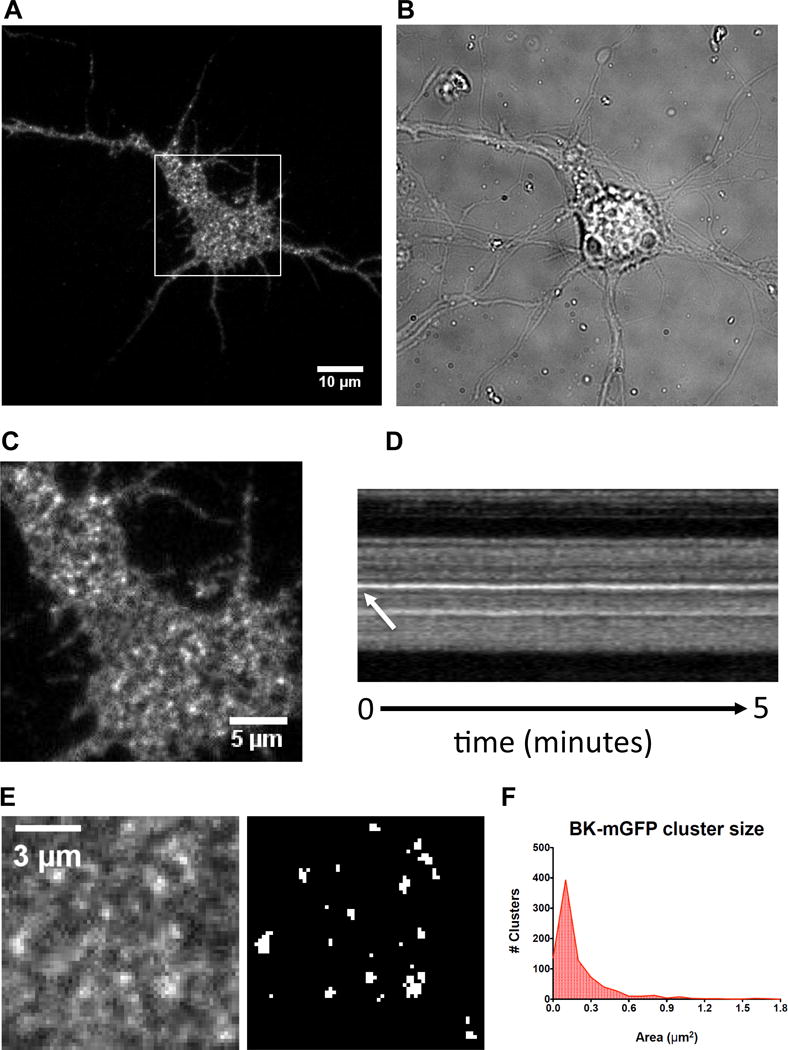
Live cell imaging of BK-mGFP shows a similar distribution than endogenous BK channel in hippocampal neurons. Hippocampal neurons were transfected with a BK-mGFP construct. (A) Left: Transfected neuron shows GFP fluorescence in the cell body and processes. Right: Brightfield image of BK-mGFP-expressing neuron. (B) A higher magnification view of the boxed region in image A. The neuronal soma expressing BK-mGFP clearly shows a diffuse population and an aggregated bright puncta population similar to the endogenous staining of the BK channel. (C) Kymograph of bright puncta circled in image (B) which did not exhibit movement during the 5-minute long time-lapse. The time-lapse has an interval of 3 seconds between frames. (D) Measurements of clusters. Left: higher magnification view of image (B). Note the bright puncta (clusters) and diffuse staining, Right: binary image showing thresholding used for measuring clusters. (E) Histogram showing the size distribution of BK-mGFP channel clusters expressed in hippocampal neurons (858 clusters were quantified from 24 neurons).
The perimembrane labeling of BK channels is changed by exposure to EtOH in a time-dependent manner in hippocampal neurons
The effect of EtOH exposure on perimembrane expression of endogenous BK channels was determined by a series of in vitro experiments with EtOH exposures ranging from 10-minutes to 24-hours. Immediately after the exposure protocol, the neurons were fixed, labeled and imaged using TIRF microscopy. Data analysis showed a significant increase of 43.2% ± 8.7% (p < 0.0001) in BK perimembrane labeling as early as 10-min of EtOH exposure when compared to the untreated control. This significant increase was maintained up to 3-hrs of EtOH exposure, which showed a 47.0% ± 9.8% (p < 0.0001) increase in perimembrane labeling from the untreated control. However, after 6-hrs of EtOH there was a significant reduction in BK perimembrane labeling with a 27.7% decrease ± 7.0% (p < 0.001) from the untreated control. Interestingly, after 24-hrs of EtOH exposure the perimembrane levels of BK labeling had returned to levels comparable to control (0.92 ± 6.2% change from untreated control, p= 0.88). Figure 3 and 4 shows the quantification of BK perimembrane labeling and representative images at each of the four EtOH exposure time points, respectively.
Figure 3.
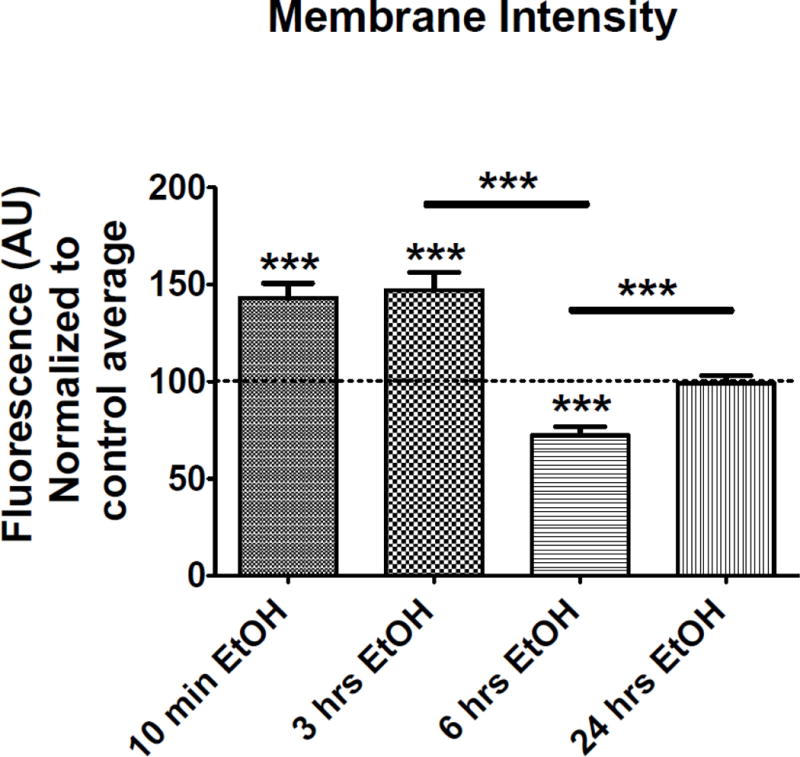
Membrane intensity changes after time-dependent incubations with EtOH. Hippocampal neurons were incubated with EtOH for 10-min (control N=46, EtOH N=50 neurons), 3-hrs (control N=53, EtOH N=50 neurons), 6-hrs (control N=35, EtOH N=35 neurons) and 24-hrs (control N=47, EtOH N=48 neurons) and fixed and stained immediately afterwards. The graph shows the quantification of BK fluorescence intensity in the cell body after TIRF imaging. Values are shown as normalized fluorescence to the control group. P < 0.001, unpaired t-test to its own control group. Black lines with stars positioned over the columns show significant differences between EtOH treated groups, P < 0.001, one-way ANOVA followed by Bonferroni post hoc. Error bar is ±SEM.
Figure 4.
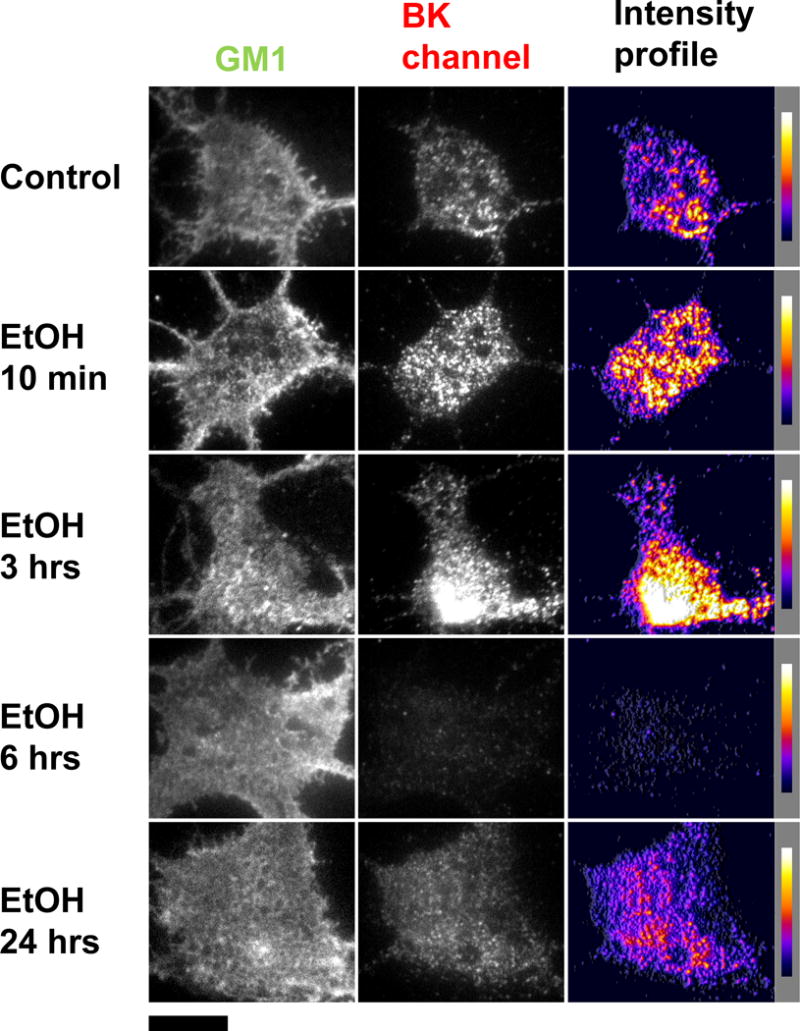
Representative TIRF images showing time-dependent changes in BK perimembrane expression. Hippocampal neurons were incubated with EtOH for 10-min, 3-hrs, 6-hrs and 24-hrs and fixed and stained immediately afterwards. The left column shows the outline of the neurons via a membrane stain against GM1 (in the green channel). The center column shows representative TIRF images of hippocampal neurons after immunofluorescence against the BK channel (in the red channel). The right column shows pseudo-colored intensity profile displaying areas with higher fluorescence as yellow/white and with lower fluorescent signal as purple/black. All image are shown under the same parameters. Each row corresponds to a treatment. Scale bar = 10μm.
Declustering, that is the reduction in the fluorescence intensity at individual clusters which is proportional to the density of BK channels, has also been described as a component for the development of molecular tolerance to EtOH (Pietrzykowski et al. 2004). Therefore, four parameters of BK clustering were measured after varying exposure times. The parameters measured included; cluster intensity (density), cluster size, numbers of clusters per area and % surface area covered by clusters. These parameters in K+ channel cluster morphology have been observed to be affected in different neuronal processes (Misonou et al., 2004; O’Connell, Rolig, Whitesell, & Tamkun, 2006). We found a significant increase in cluster intensity of 29.2% ± 2.0% (p < 0.0001) from the untreated control as early as 10-min of EtOH exposure. This was maintained up to 3-hrs of EtOH with an average increase of 30.8% ± 1.9% (p < 0.0001) from the untreated control. These changes are illustrated in histogram form in figure 5A&B. In contrast, after 6-hrs of EtOH exposure there was a significant decrease of 15.6% ± 2.6% (p < 0.0001) from the untreated control values, with a shift towards lower intensity levels (Fig. 5C). Lastly, there was a return to baseline in cluster intensity after 24-hrs of EtOH exposure (2.2 ± 1.4% change from untreated control, p = 0.12). This can also be seen in the distribution of the data in which there is no difference from the untreated control group (Fig. 5D).
Figure 5.
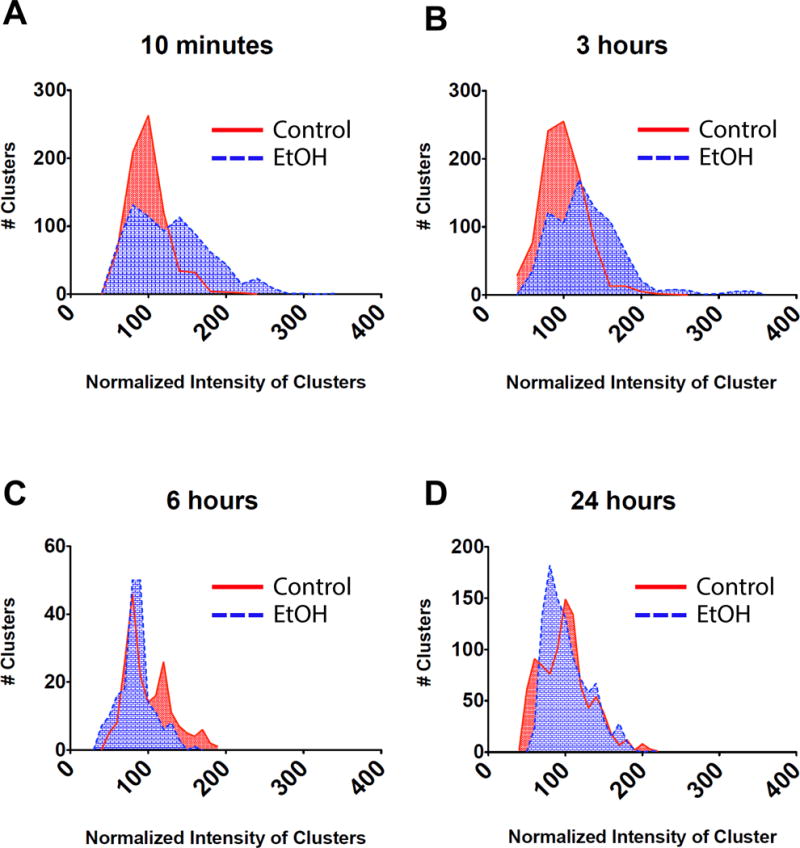
Cluster intensity changes after time-dependent incubations with EtOH. Hippocampal neurons were incubated with EtOH for 10-min, 3-hrs, 6-hrs or 24-hrs, and fixed and stained immediately against BK channel afterwards. Intensity of the clusters was quantified from TIRF images and values were pooled from many cells. Histograms showing changes in the distribution of the cluster fluorescence intensity after time-dependent EtOH incubations. Fluorescence intensity is shown as normalized values. Red (continuous line) is the size distribution of clusters in control cells and the blue (dashed line) is for the size distribution of clusters in EtOH treated cells. Note the shifts to the right meaning an increase in fluorescence intensity and shifts to the left indicating a reduction in fluorescence intensity. (A) 10-min EtOH (B) 3-hrs EtOH (C) 6-hrs EtOH (D) 24-hrs EtOH. Statistics between each control and EtOH pair showed that there is a significant effect after 10-min (control=732 clusters quantified from 46 neurons, EtOH=770 clusters quantified from 50 neurons), 3-hrs (control=890 clusters quantified from 53 neurons, EtOH=787 clusters quantified from 50 neurons), and 6-hrs (control=199 clusters quantified from 15 neurons, EtOH=194 clusters quantified from 16 neurons), of EtOH exposure (p < 0.0001, unpaired t-test), but not after 24-hrs (control=947 clusters quantified from 47 neurons, EtOH=996 clusters quantified from 48 neurons) of EtOH exposure (p >0.05, unpaired t-test).
In contrast, cluster size, number of clusters per area and percent of the surface area covered by clusters, did not change after any of the EtOH time points (p > 0.05) when compared to the untreated control. Figure 6 summarizes these parameters for all time points. Thus, cluster intensity changes independently of cluster area parameters.
Figure 6.
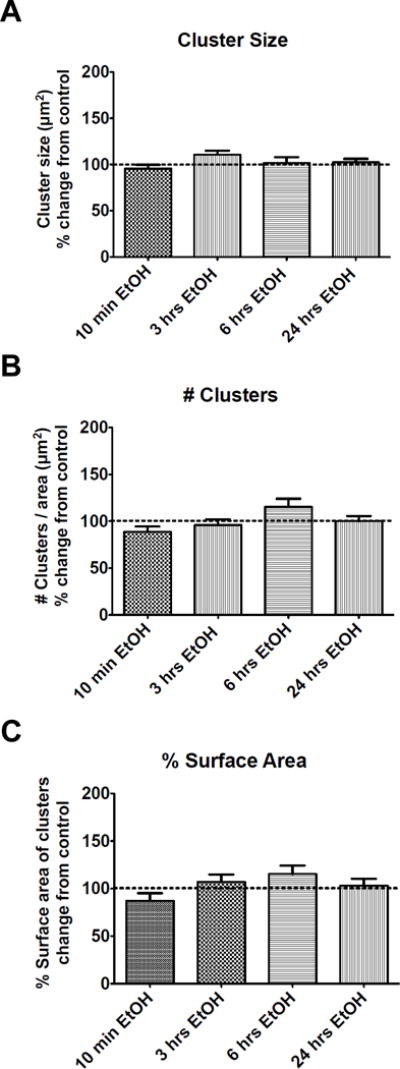
Cluster size, # of cluster per area and % surface area do not change after time-dependent incubations with EtOH. Hippocampal neurons were incubated with EtOH for 10-min (control N=46, EtOH N=50 neurons), 3-hrs (control N=53, EtOH N=50 neurons), 6-hrs (control N=35, EtOH N=35 neurons) and 24-hrs (control N=47, EtOH N=48 neurons). Neurons were fixed and stained immediately against the BK channel afterwards. (A) Size of the clusters, (B) number of clusters per area unit and (C) % surface area were quantified for each cell imaged with TIRF microscopy. Values from EtOH treated cells were compared to their own control groups and no significant differences were found between pairs. Unpaired t-test, p > 0.05. Error bar is ±SEM.
The current density of BK channels is decreased after 3 and 6-hrs of exposure to EtOH
To correlate changes in perimembrane expression measured by TIRF imaging with BK channel physiology, we recorded from the cell bodies of primary hippocampal neurons in culture using the whole-cell patch-clamp technique. Current density measurements were used to quantify BK channel activity at the plasma membrane. Current density is defined as the current per unit area of membrane and interpreted as a measure of the number of active channels. Single channel conductance across treatments did not change (p > 0.05, t-test) and allowed for interpretation of current density measurements as reflective of functional channels at the plasma membrane surface. Single channel conductance for each treatment was as follows: 240.4 pS ± 17.09 for untreated controls (n=11 neurons), 237.55 pS ± 14.04 for EtOH 10-min (n=7 neurons), 224.79 pS ± 17.7 for EtOH 3-hrs (n=5 neurons) and 229.55 pS ± 15.14 for EtOH 6-hrs (n=8 neurons). There was no significant difference in the G/Gmax throughout the rage of voltages (−60 to 60 mV) of either treatment compared to naive. Results show a significant decrease in current density after 3 and 6-hrs of EtOH exposure, but not after 10-min (Fig. 7). Neurons incubated with EtOH for 3 and 6-hrs resulted in decreases in current density that are statistically significantly different (p < 0.05) from naive starting from voltage −40mV and +40mV, respectively. Treatment of neurons for 10-min with EtOH resulted in no changes in current density. These electrophysiological results from live cells show that the channels at the plasma membrane are active, but reduced in number after 3 and 6-hrs of EtOH exposure.
Figure 7.
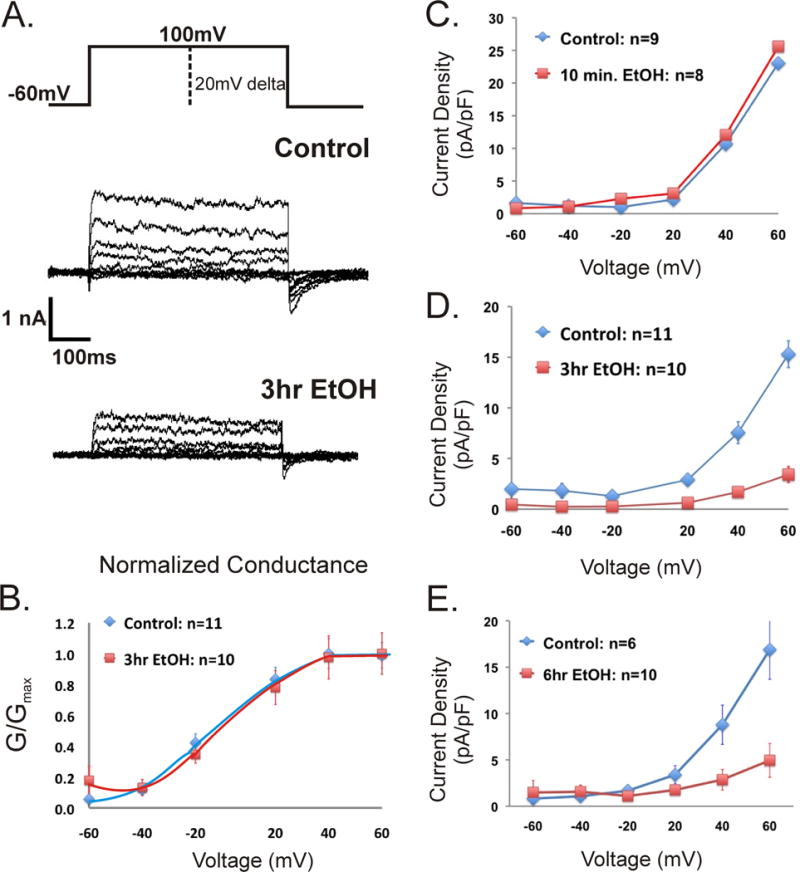
Changes in current density in response to EtOH exposure are time-dependent. (A) Representative macroscopic currents for untreated control and 3-hr EtOH treated hippocampal primary neurons obtained using the whole-cell configuration of the voltage-clamp technique. The neurons were held at hp=−60 mV, voltage steps were delta 20 mV to a final voltage of 100 mV. (B) Graph shows the normalized conductance of neurons with and without EtOH for 3-hrs. The V 1/2 for the untreated control was (−3.84 ± 3.53) mV; n=11, which was not statistically different from the EtOH 3-hrs V 1/2 (2.429 ± 2.74) mV; n=10 (p > 0.42, t-test). Normalized conductance was also measured for the 10-min and 6-hr treatments with a V 1/2 not significantly different from control (data not shown). Current density measurements obtained for 10-min (C), 3-hr (D), and 6-hr (E) 25mM EtOH exposure were obtained for voltages starting from −60 to 60 mV. Single channel conductance of the channel did not change, suggesting that the decrease in current density corresponds to a diminished number of functional channels in the plasma membrane. Error bars represent SEM, when not visible, they are contained within the point marker.
Levels of BK channel protein do not change after exposure to EtOH
We next addressed whether the changes seen in perimembrane expression were a result of a redistribution of BK already present in the neuron or a change in total BK protein levels. We determined this by measuring the total BK protein levels via Western blots. The Western blot data showed no significant change in total levels of BK protein after any of the EtOH time exposures tested (p = 0.46) (Fig. 8). These results suggest that the changes seen at the perimembrane level result from an altered BK channel trafficking dynamic (i.e. movements to and from the perimembrane area) and not a change in synthesis or degradation.
Figure 8.
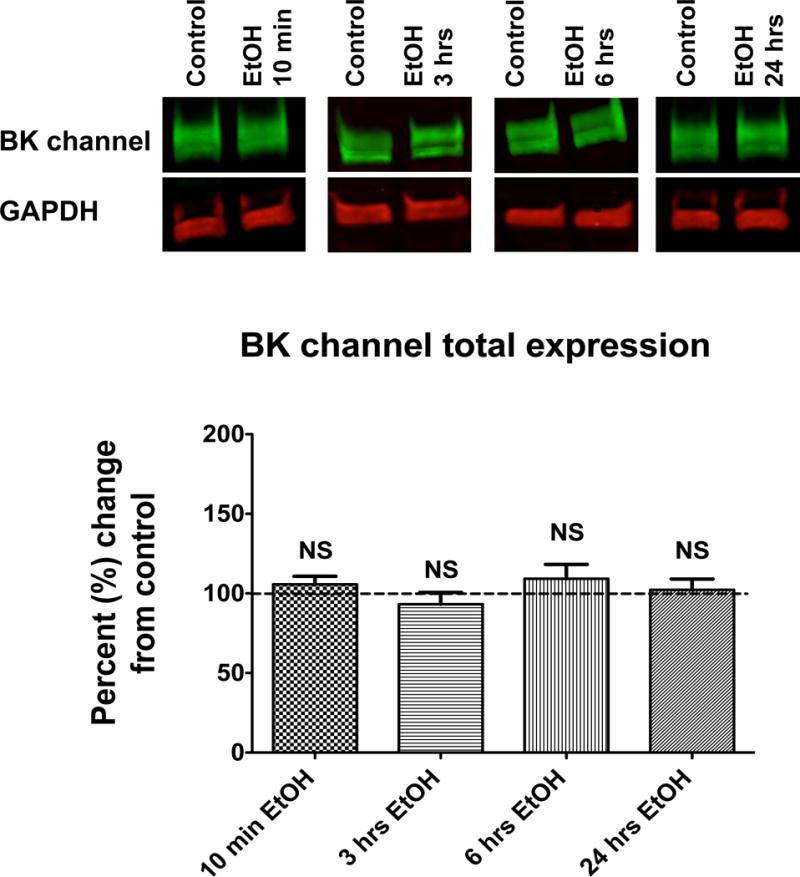
Total BK protein levels do not change after time-dependent incubations with EtOH. Hippocampal neurons were incubated with EtOH for 10-min (N=8), 3-hrs (N=6), 6-hrs (N=5) and 24-hrs (N=7). Cells were lysed immediately afterwards for Western blotting. (A) Representative immunoblots from a membrane labeled against the BK channel (green above) and GAPDH (red below). (B) Graph shows quantification of labeling against BK channel (normalized to GAPDH as loading control). EtOH values were normalized and compared to their own control groups. Values are shown as percent change from control average. Statistical analysis shows no significant difference between groups. One-way ANOVA, p > 0.05. Error bar is ±SEM.
The decrease in perimembrane BK expression seen after 6-hrs of ETOH incubation is persistent after 18-hrs of withdrawal in hippocampal neurons
Six hours of EtOH exposure has been shown to be a critical exposure time for the regulation of BK, with persistent effects occurring after 6-hrs of EtOH exposure, but not 1 or 3-hrs (Velázquez-Marrero et al., 2011). Consequently, we were interested in knowing whether 6-hrs of EtOH exposure, followed by 18-hrs withdrawal, would support a return to baseline, as was observed after a continuous 24-hr exposure, or would result in a continued reduction in BK perimembrane expression (Fig. 3). The intensity results showed that perimembrane BK levels were decreased by 21.2% ± 7.11% (p < 0.01) from the untreated control after 6-hrs of EtOH followed by an 18-hr withdrawal (Fig. 9AC). Intriguingly, this indicated that the decrease of BK perimembrane levels observed after 6-hrs of EtOH exposure (see Fig. 3) was persistent under withdrawal conditions.
Figure 9.
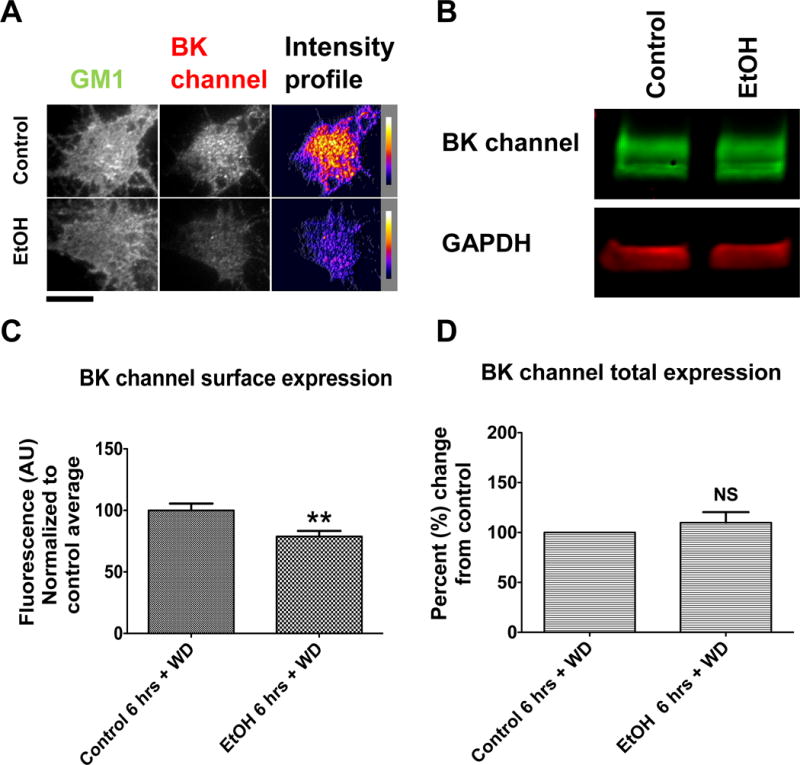
The BK channel remains internalized after 6-hrs of EtOH exposure followed by 18-hrs of withdrawal. Hippocampal neurons were incubated with EtOH for 6-hrs, washed and left in withdrawal 18-hrs. Neurons were fixed (or lysed for Western blot) and stained immediately against the BK channel afterwards. (A) Representative images showing a reduction in BK perimembrane expression after 6-hrs of EtOH exposure plus 18-hrs of withdrawal when compared to control. Scale bar = 10μm (B) Representative blots showing no change in total levels of BK protein expression in neurons after 6-hrs of EtOH exposure plus 18-hrs of withdrawal when compared to control. (C) Perimembrane expression of the BK channel quantified after TIRF imaging is significantly reduced after EtOH exposure followed by withdrawal when compared to control, unpaired t-test, p < 0.01. Error bar is ±SEM, (control N=26, EtOH N=29 neurons) (D) Total BK channel protein levels quantified via Western blot show not significant difference when compared to control group, unpaired t-test, p > 0.05 (N=4).
Western blots were used to determine changes in total BK protein. Our results showed that levels of total BK protein within the neuron were unchanged after 6-hrs exposure followed by 18-hrs withdrawal (p = 0.63) when compared to the untreated control (Fig. 9B&D). This is consistent with the interpretation that the change in perimembrane levels represents a redistribution of the channel, rather than a change in total protein.
Discussion
Alterations in BK channel function and expression have been linked to several pathologies (Kyle & Braun, 2014). Relatively few studies have visualized changes in perimembrane expression of endogenous BK channels. The lack of a reliable extracellular epitope antibody against the BK channel is a factor that hinders the use of light microscopy to identify and measure its surface expression. Our study is the first to use TIRF microscopy to investigate endogenous BK channels in any cellular model. TIRF imaging enabled clear visualization of BK perimembrane expression and clustering in hippocampal neurons. Several lines of evidence indicate that our TIRF imaging of endogenous channels addressed potential artifacts due to the immunofluorescent protocol. First, the BK perimembrane expression showed the expected clustered localization and skewed distribution of cluster size, with the our median cluster size (0.08 μm2) being similar to the average cluster size (~0.07 μm2) previously reported by electron microscopy in hippocampal neurons (Kaufmann et al., 2010). While our average cluster size (0.130 μm2) was higher than the average reported by Kaufmann and colleagues, this difference may be attributed to the differences in resolution between the two imaging techniques. Secondly, live-cell imaging with a BK-mGFP chimera showed a perimembrane distribution similar to the endogenous channels. In addition, BK-mGFP cluster size distribution was comparable to the endogenous BK population. Live-cell imaging also confirmed that the bright puncta seen in hippocampal neurons are static, in accord with the typical behavior of clusters (with little or no movement) as opposed to vesicle movement (on the order of seconds) (Di Biase et al., 2011; Kikushima, Kita, & Higuchi, 2013).
Using TIRF microscopy and current density measurements we show that EtOH alters the perimembrane expression of endogenous BK channels in hippocampal neurons. We further defined this process as a redistribution, rather than a change in total BK protein levels as shown by Western blot measurements. These effects are markedly dependent on duration of exposure and include an initial increase in perimembrane expression followed by the previously reported internalization after 6-hrs of EtOH exposure (Pietrzykowski et al. 2004). Although we previously observed a suggestive small increase in current density after 30-min of EtOH exposure in neurohypophysis neurons, this finding was not statistically significant (Pietrzykowski et al., 2004).
Our TIRF measurements indicate an increase in BK staining evident after 10-min and 3-hrs of exposure to EtOH which suggest the relocation of intracellular vesicles of BK to the perimembrane area. However, current density experiments do not show an increase in functional BK channels at the plasma membrane in any of the time points tested. The resolution of TIRF microscopy in the z-plane is produced and limited by the evanescent wave from the glass/cell membrane interface with a range of ~150nm, which enables visualization of the basal membrane (~10nm thick) and the area adjacent to it. As a consequence, without the availability of an effective extracellular antibody to label endogenous BK channels, TIRF imaging is unable to differentiate the BK channels present exclusively at the plasma membrane from those just underneath it. On the other hand, current density measures the presence of active channels in the plasma membrane, thus inactive channels would go undetected.
Taken together our data suggests that during the initial exposure of EtOH there is a redistribution of BK vesicles from the interior of the cell towards the area adjacent to the membrane. Yet, these dynamic increases in BK channel perimembrane expression are not correlated with increases in functional channels as measured by current density. Interestingly, Fox and colleagues (Fox, Loftus, & Tamkun, 2013) determined there was no correlation between channel density and conductance given increases in expression resulted in non-conducting Kv2.1 channels. It is possible that we are observing a similar phenomenon, in which the membrane insertion of BK vesicles results in non-conducting BK channels. Alternatively, while the dynamic movement of vesicles toward the membrane can be readily observed with TIRF imaging, insertion of active channels may occur at a yet undetermined and consequently untested time window.
While we do not know the mechanism by which outward trafficking of the BK channel in response to EtOH occurs, recent evidence in astrocytes indicate that BK channels from an intracellular pool can be translocated to the plasma membrane through a Ca+2 dependent process (Ou et al., 2009). The high levels of intracellular BK channels found in hippocampal neurons (Sailer et al. 2006), would enable a similar translocation of BK channel towards the membrane area within minutes. Rapid trafficking towards the membrane has been reported in hippocampus neurons, where the transient receptor potential ion channel 5 shows rapid translocation and insertion after growth factor stimulation (Bezzerides, Ramsey, Kotecha, Greka, & Clapham, 2004). AMPA receptors provide another example, since they are rapidly inserted from intracellular vesicles within minutes of NMDA activation (Lu et al., 2001; G. A. Yudowski et al., 2007). Therefore, dynamic redistribution of ion channels has been shown to occur within minutes as part of a concerted neuronal response.
The increase in BK perimembrane expression observed through TIRF microscopy after 10-min of EtOH was maintained for up to 3-hrs of EtOH exposure, but it was significantly reduced bellow control levels after 6-hrs of EtOH. While current density measurements did not correlate with imaging at the 10-min nor 3-hr time points, it did match the imaging observed for the 6-hr exposure. We speculate that while vesicle trafficking may in fact translocate a significant pool of BK channels to the perimembrane as early as 10-min post exposure, vesicular movement may occur independently of both channel insertion and internalization. Therefore, we hypothesize that while the amount of channels present at the membrane had been on the net decline as early as 3-hrs of EtOH exposure, the BK containing vesicles previously recruited to the perimembrane area, are dispersed back into the cell only after a trigger is activated between 3 and 6-hrs of EtOH exposure. This transition in the regulation of BK channel trafficking between 3 and 6-hrs of EtOH exposure is reminiscent of the functional “switch” in striatal neurons where desensitization of the BK channel persists for at least 24-hrs withdrawal after 6, but not 3-hrs exposure (Velázquez-Marrero et al., 2011). Interestingly, similar to the persistent molecular tolerance (PMT) described above, the changes in BK perimembrane expression persisted even after 18-hrs withdrawal. Current kinetics and mRNA analysis suggest this functional switch reported in Velazquez-Marrero et al., occurs through a redistribution of specific BK isoforms at the plasma membrane. Our present results further support the interpretation that between 3 and 6-hrs of EtOH exposure a transition occurs in the underlying molecular mechanisms that regulate BK channel trafficking.
Six hours of exposure to drugs of abuse has been shown to be a critical time point in the development of tolerance and drug addiction in other paradigms. For example, in 1998, Ahmed and Koob reported that 6-hrs, but not 1-hr, of access to cocaine per session resulted in escalation of drug intake (Ahmed & Koob, 1998). Moreover, EtOH has been seen to decrease the surface expression of GABAA receptors in cultured cortical neurons after 4-hrs, but not 1-hr, through the regulation of PKA (Carlson, Kumar, Werner, Comerford, & Morrow, 2013). It seems, therefore, that signaling cascades likely require a minimal exposure time to trigger their effect (e.g. enhanced internalization of an ion channel).
Intriguingly, after the internalization seen at 6-hrs of EtOH (with both TIRF imaging and current density), we observed that the BK perimembrane expression returned to baseline levels (comparable to the untreated control) after 24-hrs of EtOH exposure. This return to baseline would necessitate a recovery in BK perimembrane expression from the original downregulation that occurs after 6-hrs of exposure. This may suggest that additional compensatory mechanisms during 24-hrs exposure counteract BK channel internalization to restore homeostatic neuronal excitability. One appealing scenario is that the recovery of BK perimembrane expression includes a change in the “new” population, such that either isoform or auxiliary subunit identity renders the newly inserted BK functional, but resistant to EtOH (i.e. tolerant) (Velázquez-Marrero et al., 2011).
TIRF microscopy enabled us to quantify changes in clustering, previously reported to be a significant component of the development of molecular tolerance (Pietrzykowski et al. 2004). When we measured the intensity of the membrane clusters, we found that the number of channels per cluster (cluster density) changed in the same way that the overall perimembrane expression did. This suggested that EtOH-induced changes in BK perimembrane expression occur indiscriminately between clustered and non-clustered channels. Indeed, the density of BK clusters has previously been reported to change in parallel with the overall surface expression (Pietrzykowski et al. 2004; Samaranayake et al. 2004). This has also been shown for other membrane proteins such as AMPA receptors (Lu et al., 2001). Interestingly, only cluster intensity out of the four cluster parameters measured was affected by EtOH exposure. The measurements of size of clusters, number of clusters per area and % surface area show no significant change after EtOH treatment, suggesting that the EtOH-induced changes in cluster density are independent of cluster size or number of clusters.
Overall, we show significant differences in perimembrane expression of the BK channel after exposure to EtOH (see figure 10). What molecular processes might be orchestrating such effects? Trafficking is a process subject to constant regulation by the action of other molecules. Some of the factors that are known to regulate trafficking (to and from the plasma membrane) of ion channels are: calcium signaling and GTPases (Li, Garrity, & Xu, 2013), phosphorylation and other posttranslational modification (Song & Huganir, 2002), scaffolding proteins (Braithwaite, Xia, & Malenka, 2002) and protein synthesis (Nayak, Zastrow, Lickteig, Zahniser, & Browning, 1998). Interestingly, it is reported that the effect of several of these factors in trafficking is evident only several hours after the stimulus that triggered the effect (Carlson et al., 2013; Nayak et al., 1998). Indeed, the nonlinear nature of the time-dependent changes in BK perimembrane expression we report here suggest that EtOH interacts with several factors that regulate BK channel trafficking.
Figure 10.
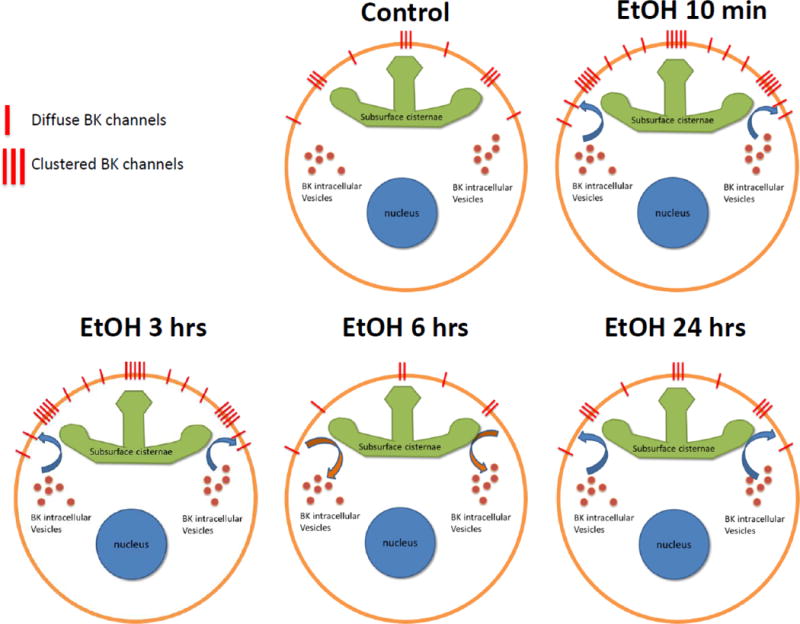
Model: time-dependent changes in BK expression and trafficking after exposure to EtOH in hippocampal neurons. Under basal conditions the BK channel resides in the plasma membrane in two populations: clustered and diffuse. The clustered channels are almost exclusively associated with sub-surface cisternae of the endoplasmic reticulum. Moreover, there is a pool of intracellular BK in the cell body which is in balance with the BK channels at the surface through a regulated trafficking process. Upon EtOH exposure there is a rapid increase in perimembrane expression, possibly a translocation of the intracellular pool to the surface, which shifts the balance towards insertion of the channel. BK channels are inserted into clustered and non-clustered areas, therefore both populations have an increase in BK channel perimembrane expression. The increase in BK perimembrane expression observed after 10-min of EtOH is maintained for up to 3-hrs of EtOH exposure. However, after 6-hrs of EtOH exposure there is a drastic shift in trafficking that now favors the internalization of the channel, reducing BK channel surface expression significantly below basal levels. If the exposure to EtOH is maintained up to 24-hrs there again is a shift in balance towards insertion of the BK channel, which returns BK channel perimembrane levels to baseline. This process also takes place in both clustered and diffuse populations.
This study uses TIRF microscopy to measure changes in perimembrane expression and cluster distribution of endogenous BK channels in hippocampal neurons. Our results are in line with previous reports showing that EtOH affects the surface expression of the BK channel, but highlights the time-dependent effect of EtOH, with sequential increases and decreases in perimembrane expression. The nonlinear nature of these changes hints at underlying intricate signaling cascades, possible dynamically linked with each other.
Supplementary Material
Acknowledgments
This work was supported in part by NIH grants 1R01 AA017920 to SNT, K99/R00 Pathway to Independence Award from NIDA DA023444 and DA037924 to GY, MBRS-RISE R25 GM061838 fellowship to SP and 5P20GM103642 COBRE project grant to CV-M. Research infrastructure support was provided in part by a grant from the National Institute of Minority Health and Health Disparities (8G12 MD 007600). We would like to thank Nicole Palacio, B.S., Gina Suarez, B.S. and Dioselina Resto for their technical assistance.
References
- Ahmed SH, Koob GF. Transition from moderate to excessive drug intake: change in hedonic set point. Science (New York, NY) 1998;282(5387):298–300. doi: 10.1126/science.282.5387.298. [DOI] [PubMed] [Google Scholar]
- Axelrod D. Total Internal Reflection Fluorescence Microscopy in Cell Biology. Traffic. 2001;2(11):764–774. doi: 10.1034/j.1600-0854.2001.21104.x. [DOI] [PubMed] [Google Scholar]
- Bezzerides VJ, Ramsey IS, Kotecha S, Greka A, Clapham DE. Rapid vesicular translocation and insertion of TRP channels. Nature Cell Biology. 2004;6(8):709–20. doi: 10.1038/ncb1150. [DOI] [PubMed] [Google Scholar]
- Braithwaite SP, Xia H, Malenka RC. Differential roles for NSF and GRIP/ABP in AMPA receptor cycling. Proceedings of the National Academy of Sciences of the United States of America. 2002;99(10):7096–101. doi: 10.1073/pnas.102156099. [DOI] [PMC free article] [PubMed] [Google Scholar]
- Carlson SL, Kumar S, Werner DF, Comerford CE, Morrow AL. Ethanol activation of protein kinase A regulates GABAA α1 receptor function and trafficking in cultured cerebral cortical neurons. The Journal of Pharmacology and Experimental Therapeutics. 2013;345(2):317–25. doi: 10.1124/jpet.112.201954. [DOI] [PMC free article] [PubMed] [Google Scholar]
- Di Biase V, Tuluc P, Campiglio M, Obermair GJ, Heine M, Flucher BE. Surface Traffic of Dendritic CaV1.2 Calcium Channels in Hippocampal Neurons. Journal of Neuroscience. 2011;31(38):13682–13694. doi: 10.1523/JNEUROSCI.2300-11.2011. [DOI] [PMC free article] [PubMed] [Google Scholar]
- Feinberg-Zadek PL, Martin G, Treistman SN. BK channel subunit composition modulates molecular tolerance to ethanol. Alcoholism, Clinical and Experimental Research. 2008;32(7):1207–16. doi: 10.1111/j.1530-0277.2008.00704.x. [DOI] [PubMed] [Google Scholar]
- Ford KA, Wolf ME, Hu XT. Plasticity of L-type Ca2+ channels after cocaine withdrawal. Synapse (New York, NY) 2009;63(8):690–7. doi: 10.1002/syn.20651. [DOI] [PMC free article] [PubMed] [Google Scholar]
- Fox PD, Loftus RJ, Tamkun MM. Regulation of Kv2.1 K(+) conductance by cell surface channel density. The Journal of Neuroscience: The Official Journal of the Society for Neuroscience. 2013;33(3):1259–70. doi: 10.1523/JNEUROSCI.3008-12.2013. [DOI] [PMC free article] [PubMed] [Google Scholar]
- Grabham PW, Seale GE, Bennecib M, Goldberg DJ, Vallee RB. Cytoplasmic dynein and LIS1 are required for microtubule advance during growth cone remodeling and fast axonal outgrowth. The Journal of Neuroscience: The Official Journal of the Society for Neuroscience. 2007;27(21):5823–34. doi: 10.1523/JNEUROSCI.1135-07.2007. [DOI] [PMC free article] [PubMed] [Google Scholar]
- Hamill OP, Marty A, Neher E, Sakmann B, Sigworth FJ. Improved patch-clamp techniques for high-resolution current recording from cells and cell-free membrane patches. Pflügers Archiv: European Journal of Physiology. 1981;391(2):85–100. doi: 10.1007/BF00656997. [DOI] [PubMed] [Google Scholar]
- Kaufmann WA, Kasugai Y, Ferraguti F, Storm JF. Two distinct pools of large-conductance calcium-activated potassium channels in the somatic plasma membrane of central principal neurons. Neuroscience. 2010;169(3):974–86. doi: 10.1016/j.neuroscience.2010.05.070. [DOI] [PMC free article] [PubMed] [Google Scholar]
- Kikushima K, Kita S, Higuchi H. A non-invasive imaging for the in vivo tracking of high-speed vesicle transport in mouse neutrophils. Scientific Reports. 2013;3:1913. doi: 10.1038/srep01913. [DOI] [PMC free article] [PubMed] [Google Scholar]
- Knott TK, Dopico AM, Dayanithi G, Lemos J, Treistman SN. Integrated channel plasticity contributes to alcohol tolerance in neurohypophysial terminals. Molecular Pharmacology. 2002;62(1):135–42. doi: 10.1124/mol.62.1.135. [DOI] [PubMed] [Google Scholar]
- Kreifeldt M, Le D, Treistman SN, Koob GF, Contet C. BK channel β1 and β4 auxiliary subunits exert opposite influences on escalated ethanol drinking in dependent mice. Frontiers in Integrative Neuroscience. 2013;7:105. doi: 10.3389/fnint.2013.00105. [DOI] [PMC free article] [PubMed] [Google Scholar]
- Kyle BD, Braun AP. The regulation of BK channel activity by pre- and post-translational modifications. Frontiers in Physiology. 2014;5:316. doi: 10.3389/fphys.2014.00316. [DOI] [PMC free article] [PubMed] [Google Scholar]
- Li X, Garrity AG, Xu H. Regulation of membrane trafficking by signalling on endosomal and lysosomal membranes. The Journal of Physiology. 2013;591(Pt 18):4389–401. doi: 10.1113/jphysiol.2013.258301. [DOI] [PMC free article] [PubMed] [Google Scholar]
- Liang J, Suryanarayanan A, Abriam A, Snyder B, Olsen RW, Spigelman I. Mechanisms of reversible GABAA receptor plasticity after ethanol intoxication. The Journal of Neuroscience: The Official Journal of the Society for Neuroscience. 2007;27(45):12367–77. doi: 10.1523/JNEUROSCI.2786-07.2007. [DOI] [PMC free article] [PubMed] [Google Scholar]
- Lu W, Man H, Ju W, Trimble WS, MacDonald JF, Wang YT. Activation of synaptic NMDA receptors induces membrane insertion of new AMPA receptors and LTP in cultured hippocampal neurons. Neuron. 2001;29(1):243–54. doi: 10.1016/s0896-6273(01)00194-5. [DOI] [PubMed] [Google Scholar]
- Ly C, Melman T, Barth AL, Ermentrout GB. Phase-resetting curve determines how BK currents affect neuronal firing. Journal of Computational Neuroscience. 2011;30(2):211–23. doi: 10.1007/s10827-010-0246-3. [DOI] [PubMed] [Google Scholar]
- Martin GE, Hendrickson LM, Penta KL, Friesen RM, Pietrzykowski AZ, Tapper AR, Treistman SN. Identification of a BK channel auxiliary protein controlling molecular and behavioral tolerance to alcohol. Proceedings of the National Academy of Sciences of the United States of America. 2008;105(45):17543–8. doi: 10.1073/pnas.0801068105. [DOI] [PMC free article] [PubMed] [Google Scholar]
- Martin G, Puig S, Pietrzykowski A, Zadek P, Emery P, Treistman S. Somatic localization of a specific large-conductance calcium-activated potassium channel subtype controls compartmentalized ethanol sensitivity in the nucleus accumbens. The Journal of Neuroscience: The Official Journal of the Society for Neuroscience. 2004;24(29):6563–72. doi: 10.1523/JNEUROSCI.0684-04.2004. [DOI] [PMC free article] [PubMed] [Google Scholar]
- Misonou H, Mohapatra DP, Park EW, Leung V, Zhen D, Misonou K, Trimmer JS. Regulation of ion channel localization and phosphorylation by neuronal activity. Nature Neuroscience. 2004;7(7):711–8. doi: 10.1038/nn1260. [DOI] [PubMed] [Google Scholar]
- Munoz MB, Slesinger PA. Sorting nexin 27 regulation of G protein-gated inwardly rectifying K+ channels attenuates in vivo cocaine response. Neuron. 2014;82(3):659–69. doi: 10.1016/j.neuron.2014.03.011. [DOI] [PMC free article] [PubMed] [Google Scholar]
- Nayak A, Zastrow DJ, Lickteig R, Zahniser NR, Browning MD. Maintenance of late-phase LTP is accompanied by PKA-dependent increase in AMPA receptor synthesis. Nature. 1998;394(6694):680–3. doi: 10.1038/29305. [DOI] [PubMed] [Google Scholar]
- O’Connell KMS, Rolig AS, Whitesell JD, Tamkun MM. Kv2.1 potassium channels are retained within dynamic cell surface microdomains that are defined by a perimeter fence. The Journal of Neuroscience: The Official Journal of the Society for Neuroscience. 2006;26(38):9609–18. doi: 10.1523/JNEUROSCI.1825-06.2006. [DOI] [PMC free article] [PubMed] [Google Scholar]
- Ou JW, Kumar Y, Alioua A, Sailer C, Stefani E, Toro L. Ca2+- and thromboxane-dependent distribution of MaxiK channels in cultured astrocytes: from microtubules to the plasma membrane. Glia. 2009;57(12):1280–95. doi: 10.1002/glia.20847. [DOI] [PMC free article] [PubMed] [Google Scholar]
- Petrik D, Wang B, Brenner R. Modulation by the BK accessory β4 subunit of phosphorylation-dependent changes in excitability of dentate gyrus granule neurons. The European Journal of Neuroscience. 2011;34(5):695–704. doi: 10.1111/j.1460-9568.2011.07799.x. [DOI] [PMC free article] [PubMed] [Google Scholar]
- Pietrzykowski AZ, Friesen RM, Martin GE, Puig SI, Nowak CL, Wynne PM, Treistman SN. Posttranscriptional regulation of BK channel splice variant stability by miR-9 underlies neuroadaptation to alcohol. Neuron. 2008;59(2):274–87. doi: 10.1016/j.neuron.2008.05.032. [DOI] [PMC free article] [PubMed] [Google Scholar]
- Pietrzykowski AZ, Martin GE, Puig SI, Knott TK, Lemos JR, Treistman SN. Alcohol tolerance in large-conductance, calcium-activated potassium channels of CNS terminals is intrinsic and includes two components: decreased ethanol potentiation and decreased channel density. The Journal of Neuroscience: The Official Journal of the Society for Neuroscience. 2004;24(38):8322–32. doi: 10.1523/JNEUROSCI.1536-04.2004. [DOI] [PMC free article] [PubMed] [Google Scholar]
- Pietrzykowski AZ, Treistman SN. The Molecular Basis of Tolerance. Alcohol Research & Health: The Journal of the National Institute on Alcohol Abuse and Alcoholism. 2008;31(4):298–309. [PMC free article] [PubMed] [Google Scholar]
- Raffaelli G, Saviane C, Mohajerani MH, Pedarzani P, Cherubini E. BK potassium channels control transmitter release at CA3-CA3 synapses in the rat hippocampus. The Journal of Physiology. 2004;557(Pt 1):147–57. doi: 10.1113/jphysiol.2004.062661. [DOI] [PMC free article] [PubMed] [Google Scholar]
- Roman-Vendrell C, Yudowski GA. Real-time imaging of mu opioid receptors by total internal reflection fluorescence microscopy. Methods in Molecular Biology (Clifton, NJ) 2015;1230:79–86. doi: 10.1007/978-1-4939-1708-2_6. [DOI] [PMC free article] [PubMed] [Google Scholar]
- Sailer Ca, Kaufmann Wa, Kogler M, Chen L, Sausbier U, Ottersen OP, Knaus H-G. Immunolocalization of BK channels in hippocampal pyramidal neurons. The European Journal of Neuroscience. 2006;24(2):442–54. doi: 10.1111/j.1460-9568.2006.04936.x. [DOI] [PubMed] [Google Scholar]
- Samaranayake H, Saunders JC, Greene MI, Navaratnam DS. Ca(2+) and K(+) (BK) channels in chick hair cells are clustered and colocalized with apical-basal and tonotopic gradients. The Journal of Physiology. 2004;560(Pt 1):13–20. doi: 10.1113/jphysiol.2004.069856. [DOI] [PMC free article] [PubMed] [Google Scholar]
- Shruti S, Urban-Ciecko J, Fitzpatrick JA, Brenner R, Bruchez MP, Barth AL. The Brain-Specific Beta4 Subunit Downregulates BK Channel Cell Surface Expression. PloS One. 2012;7(3):e33429. doi: 10.1371/journal.pone.0033429. [DOI] [PMC free article] [PubMed] [Google Scholar]
- Song I, Huganir RL. Regulation of AMPA receptors during synaptic plasticity. Trends in Neurosciences. 2002;25(11):578–88. doi: 10.1016/s0166-2236(02)02270-1. [DOI] [PubMed] [Google Scholar]
- Stadler C, Skogs M, Brismar H, Uhlén M, Lundberg E. A single fixation protocol for proteome-wide immunofluorescence localization studies. Journal of Proteomics. 2010;73(6):1067–78. doi: 10.1016/j.jprot.2009.10.012. [DOI] [PubMed] [Google Scholar]
- Tanaka KAK, Suzuki KGN, Shirai YM, Shibutani ST, Miyahara MSH, Tsuboi H, Kusumi A. Membrane molecules mobile even after chemical fixation. Nature Methods. 2010;7(11):865–6. doi: 10.1038/nmeth.f.314. [DOI] [PubMed] [Google Scholar]
- Velàzquez-Marrero C, Seale GE, Treistman SN, Martin GE. BK Channel β4 Subunit Influences Sensitivity and Tolerance to Alcohol by Altering its Response to Kinases. The Journal of Biological Chemistry. 2014 doi: 10.1074/jbc.M114.604306. [DOI] [PMC free article] [PubMed] [Google Scholar]
- Velázquez-Marrero C, Wynne P, Bernardo A, Palacio S, Martin G, Treistman SN. The relationship between duration of initial alcohol exposure and persistence of molecular tolerance is markedly nonlinear. The Journal of Neuroscience: The Official Journal of the Society for Neuroscience. 2011;31(7):2436–46. doi: 10.1523/JNEUROSCI.5429-10.2011. [DOI] [PMC free article] [PubMed] [Google Scholar]
- Wells DG, Dong X, Quinlan EM, Huang YS, Bear MF, Richter JD, Fallon JR. A role for the cytoplasmic polyadenylation element in NMDA receptor-regulated mRNA translation in neurons. The Journal of Neuroscience: The Official Journal of the Society for Neuroscience. 2001;21(24):9541–8. doi: 10.1523/JNEUROSCI.21-24-09541.2001. [DOI] [PMC free article] [PubMed] [Google Scholar]
- Yudowski GA, Puthenveedu MA, Leonoudakis D, Panicker S, Thorn KS, Beattie EC, von Zastrow M. Real-Time Imaging of Discrete Exocytic Events Mediating Surface Delivery of AMPA Receptors. Journal of Neuroscience. 2007;27(41):11112–11121. doi: 10.1523/JNEUROSCI.2465-07.2007. [DOI] [PMC free article] [PubMed] [Google Scholar]
- Yudowski GA, von Zastrow M. Investigating G protein-coupled receptor endocytosis and trafficking by TIR-FM. Methods in Molecular Biology (Clifton, NJ) 2011;756:325–32. doi: 10.1007/978-1-61779-160-4_19. [DOI] [PMC free article] [PubMed] [Google Scholar]
Associated Data
This section collects any data citations, data availability statements, or supplementary materials included in this article.


