

Abstract
Studies have shown that simultaneous infection of the respiratory tract with at least two viruses is common in hospitalized patients, although it is not clear whether these infections are more or less severe than single virus infections. We use a mathematical model to study the dynamics of viral coinfection of the respiratory tract in an effort to understand the kinetics of these infections. Specifically, we use our model to investigate coinfections of influenza, respiratory syncytial virus, rhinovirus, parainfluenza virus, and human metapneumovirus. Our study shows that during coinfections, one virus can block another simply by being the first to infect the available host cells; there is no need for viral interference through immune response interactions. We use the model to calculate the duration of detectable coinfection and examine how it varies as initial viral dose and time of infection are varied. We find that rhinovirus, the fastest-growing virus, reduces replication of the remaining viruses during a coinfection, while parainfluenza virus, the slowest-growing virus is suppressed in the presence of other viruses.
Introduction
Respiratory virus infections are a leading cause of mortality worldwide [1]. In addition to the threat from single infections, infections with multiple respiratory viruses in the same patient have been reported in many studies [2–11]. A number of respiratory viruses have been found to be capable of participating in simultaneous infections including respiratory syncytial virus (RSV), human rhinovirus (hRV), human enterovirus (hEV), influenza A virus (IAV), influenza B virus (IBV), human metapneumovirus (hMPV), coronavirus (CoV), parainfluenza virus (PIV), adenovirus (AdV), and human bocavirus (hBoV) [3, 5, 8]. It has long been known that simultaneous viral infections exhibit a phenomenon called viral interference where one virus blocks the growth of another virus [12–15], so the common observation of simultaneous respiratory infections in patients is somewhat surprising and needs explanation.
Children are the most common victims of simultaneous virus infections. An investigation by Goka et al. [3] with a study population ranging in age from 0 to 105 years reported that children aged less than 5 years show a higher propensity for viral coinfection than others. Another study found that the rate of viral coinfection is higher in children between 6–24 months [5] compared to new born babies (0–6 months). Finally, Zhang et al. [8] reported that among 164 children under 3 years of age, the 13–24 month age group had significantly higher multiple virus infections than the 8–12 month or 25–36 month age groups.
The severity of viral coinfections on clinical outcome in these patients is still unclear. Several investigations concluded that viral coinfections are no more severe than single virus infections [6, 7, 9], or even that there is less severe clinical impact associated with coinfection [5, 6]. On the contrary, some studies have evidence of severe disease outcome from viral coinfections [2, 3]. As an example of the confusion surrounding this issue, Aberle et al. [16] found that the severity of dual infections with non-RSV respiratory viruses are similar to those of single infections, whereas coinfection with RSV is associated with reduced immune responses resulting in a more severe clinical course of lower respiratory tract diseases. Brand et al. [7] also found that RSV associated coinfections are more severe than single RSV infections. Coinfections with influenza A and B viruses also appear to increase severity, leading to higher rates of admission to intensive care units or death [4].
To date, there are few experimental studies of simultaneous respiratory infections. One study examined co-infection of Reovirus and SARS coronavirus in guinea pigs, finding that a coinfection led to rapid death of the animals [17]. Another study examined coinfections of swine influenza and porcine reproductive and respiratory syndrome virus in vitro [18]. This study observed viral interference, but noted that the effect was dependent on which virus was the primary infection. There is only a single in vitro experiment that examines simultaneous infection of human respiratory tract viruses [19]. Shinjoh et al. showed that Influenza A virus has the potential to block the growth of RSV if they are likely to infect the host cells at the same time. In their experiment, RSV infection produces a higher peak viral load in single infection than in coinfection with influenza virus if the infections are initiated at the same time. Influenza multiplication can be suppressed by RSV, however, if the influenza infection is initiated after the RSV infection. They also analyzed this blocking action of one virus over another at the level of viral protein synthesis. During their experiments, immunofluorescense and scanning electron microscopy revealed that during the coinfection, both of the viruses release their specific surface antigens selectively indicating no viral interference involved in the blocking action.
In this paper, we use mathematical modeling to investigate simultaneous infections of the respiratory tract in an effort to explain these contradictory findings. We extend a simplified model of influenza infection [20] to include two viral strains and use it to gain insight into in vitro RSV and influenza coinfections. We then analyze other possible simultaneous viral infections in the respiratory tract with this model, focusing on more common pairs of simultaneous infections which include combinations of RSV, hRV, IAV, hMPV and PIV. We find that the period of coinfection for any of the combinations is no more than 10.5 d in the absence of any competitive advantage such as an increased initial viral inoculum or an earlier time of infection initiation.
Results
In vitro coinfection of RSV and IAV
While studies have shown that hospitalized patients commonly have evidence of infection by more than one virus at a single time [2–9], detailed studies of the time course of these infections has not yet been done. Our model will allow us to perform these detailed studies, but we must first ensure that it can reasonably reproduce experimental data of simultaneous infections. We use an in vitro experiment that studied coinfection of RSV and influenza A in MDCK cells [19] to test the whether our model can reproduce experimental observations. In the experiment, they initiated single infections of RSV and IAV individually in MDCK cells at an MOI of 0.001 and measured the viral titer in the supernatent over multiple time points (figure 1 in their paper).
We used the data (data available in S1 Table) from the single infection experiments of RSV and IAV to parameterize our model by fitting the reduced model of single virus infection. Since the data is limited, and not all parameters will be identifiable [21], we fix some of the parameters. We fix the initial number of target cells to 1 and fix the initial amount of virus to the MOI, since MOI is the initial ratio of infectious virus to target cells. Since the decay rate is determined by the smallest of k, c, or δ [22], only one of the three parameters is identifiable, so we fix k = 4.0 /d [20] and c = 2.4 /d [23] for both of them. While these are previously estimated values for influenza, we use the same values for RSV since there are no current estimates of these parameters for in vitro RSV infections and the values will not affect the outcome as long as δ is the smallest of the three quantities.
The resulting fits are shown in Fig 1 (left) and remaining estimated parameters are given in Fig 1 (bottom). RSV and influenza A virus reach their peaks at almost the same time post infection. The peak viral load for influenza is approximately 1 × 10⁸ PFU/mL and that for RSV is 1 × 10⁴ TCID50/mL. Influenza A virus produces greater viral load and has a faster initial growth rate than RSV in a single infection. Note that the experimental data for RSV does not show decay of the viral titer, so we cannot accurately estimate the true viral decay rate of RSV.
Fig 1. Model fits to the data from Shinjoh et al. [19].

(Left) Experimental data from single infections of RSV (blue) and influenza (red) are fit using a single infection model. Estimated parameters are given in the table (bottom). (Center) Coinfection model predictions and experimental data for RSV and influenza coinfection. (Right) Coinfection model with corrected decay rate predictions and experimental data for RSV and influenza coinfection.
Now we use the proposed coinfection model to predict the kinetics of coinfection with RSV and IAV. We simulate the coinfection by starting the RSV and IAV infections at the same time with the same amount of initial viral inoculum, as was done in the experiment. The model predictions of the coinfection along with the experimental data are shown in Fig 1 (center). The model is able to correctly predict the influenza time course, but does not correctly capture the time course of the RSV infection. This is due to the poor estimate of viral decay rate of RSV. If we set δ = 2.0 /d, to more accurately reflect the actual decay rate of RSV, then the model shows a good agreement with the experimental data (Fig 1, right). Thus the model generates almost the same growth profile of coinfection as the experiment.
A second series of experiments was performed by Shinjoh et al. [19], in which they initiated an RSV infection in the MDCK cells at an MOI of 0.001 and then added influenza virus 0, 4, 8, or 12 h later at an MOI of 0.001 each time. They then measured the viral titers of both RSV and influenza in the supernatent at 51 h post-RSV infection. Our model predictions as well as the experimental data are shown in Fig 2. While our model predictions don’t exactly match the experimental measurements, we see the same trend of increasing RSV viral load and decreasing IAV viral load. Given the inherent error in viral titer measurements [24] and the difficulty in reproducing experimental results due to lack of unit standardization [25], our model manages to reproduce the data fairly well.
Fig 2. Delayed influenza infection.
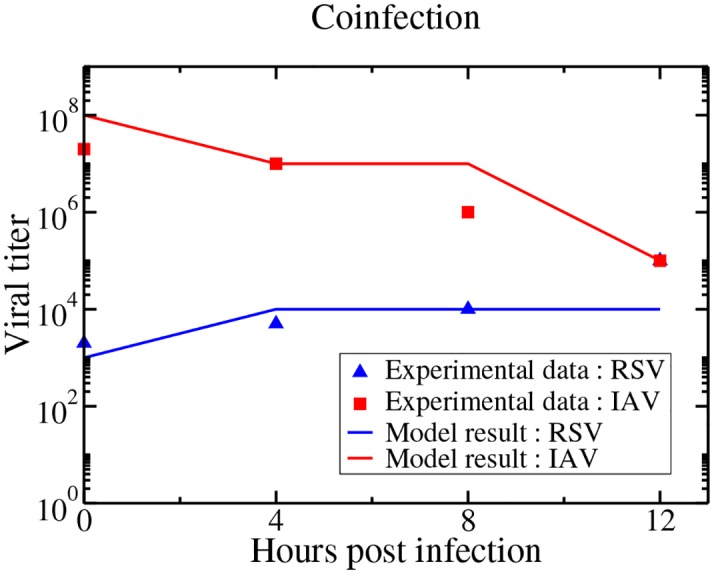
Our model predictions and experimental viral titer measurements of RSV and IAV viral titers measured at 51 hours post-RSV infection with IAV started with a delay of 0, 4, 8, and 12 h.
Coinfections with other respiratory viruses
Now that we have seen that our model can predict the time course of a coinfection, we can use it with some confidence to predict the time courses of other combinations of respiratory viruses. We do not use the parameters estimated from the Shinjoh data in the remainder of the paper, but rather estimate new parameters for several different respiratory tract viruses. We first need to collect viral time courses for each of the viruses in a single infection. We require that the viral time course have both a growth phase and a decay phase, so that we can accurately estimate the decay rate of the virus, and that the infection takes place in human respiratory tract cells. Although a number of other viruses have been found to occur as part of simultaneous respiratory infections, we found suitable time courses for influenza A, RSV, rhinovirus, parainfluenza, and hMPV. We fit the single virus model to each of these data sets. For these fits, we fixed T0 = 1, but left the initial viral inoculum as a free parameter. We also did not fix any of k, c, or δ for any of the viruses although, as mentioned before, not all three are independently identifiable [22]. The resulting fits and estimated parameters are shown in Fig 3.
Fig 3. Single virus model fits to in vitro infections of respiratory tract cells.

Experimental data and single virus model best fits for influenza (top left), RSV (top center), rhinovirus (top right), hMPV (bottom left) and parainfluenza (bottom right).
To our knowledge, viral kinetic parameters have not yet been estimated for in vitro RSV, hRV, PIV, or hMPV infections. Since viral units are not standardized, it is difficult to compare some of the parameters across the different viruses. Instead, we examine parameters such as viral growth rate, infecting time, viral decay rate and basic reproduction number to compare the kinetics of the viruses. Viral growth rate is calculated based on the equation derived by Smith et al. [22]. Smith et al. also determined that for this model, viral decay rate is given by the smallest of the decay parameters, k, c and δ. The infecting time, , represents the time it takes for a newly produced infectious particle to infect a susceptible cell [26]. The basic reproduction number represents the number of secondary infected cells that are produced from a single infectious cell and is given by R0 = pβ/cδ for this model [20]. The viral kinetics parameters for each respiratory virus are summerized in Table 1.
Table 1. Kinetic parameters of various respiratory infections.
| Parameter | IAV | RSV | hRV | PIV | hMPV |
|---|---|---|---|---|---|
| Growth ratea (/d) | 11.9 | 5.41 | 13.6 | 3.99 | 9.07 |
| Infecting time (d) | 0.04 | 0.09 | 0.01 | 0.14 | 0.01 |
| Decay rate (/d) | 4.03 | 1.27 | 0.92 | 0.56 | 0.95 |
| R0 | 58.4 | 146 | 360 | 13.8 | 18.4 |
a Growth rate is calculated using the approximation derived by Smith et al.
Influenza kinetics parameters have been estimated before [23, 25, 27], and our parameter estimates lie within the range of previous estimates. Some of these parameters have also been estimated for RSV, although they are derived from in vivo patient data [28]. Our infecting time estimate of 0.09 d is similar to the 0.1 d estimate from Gonzalez-Parra et al. [28], but our estimated decay rate is smaller than the estimated in vivo decay rate. This is not unexpected since virus in patients is cleared faster due to the effect of the immune response. For the remaining viruses, these are, to our knowledge, the first estimates of viral kinetics parameters. Our estimates indicate that hRV is the fastest growing virus, followed by IAV and hMPV; RSV and PIV have much slower growth rates. RSV and PIV also have longer infecting times than the remaining viruses confirming that these two viruses spread more slowly through the cell population than the remaining three. Influenza has a much higher decay rate than the remaining viruses, while PIV has the smallest decay rate. The basic reproductive number of hRV is largest, indicating that it spreads easily within the respiratory tract, while PIV has the lowest reproductive number suggesting slower spread through the cell population.
We can now use our two virus model to see how the viruses fare when they compete for target cells. In the simulations, infections with both viruses are initiated simultaneously with the same initial viral inoculum. Model predictions of time courses of all possible combinations of viral pairs in simultaneous infections are shown in Fig 4.
Fig 4. Model predictions of the time courses of simultaneous respiratory viral infections.

Infections are initiated at the same time with the same amount of virus. Solid lines indicate the viral titer during a simultaneous infection while dashed lines indicate the viral titer during a single infection. The dashed black line indicates a typical experimental threshold of detection.
We see a wide variety of behaviors when respiratory viruses participate in coinfections. Rhinovirus growth (magenta curves) is largely unaffected by the presence of other viruses while replication of other viruses is diminished when rhinovirus is present. The initial growth rate for rhinovirus is the highest among all the viruses studied here, so rhinovirus will infect the available target cells more rapidly than the other viruses. hMPV, has a growth rate close to that of rhinovirus, and we see that it is the only virus that causes a visible decrease in the replication of rhinovirus (Fig 4 (third row, right)). At the other extreme, PIV (black curves) has the smallest growth rate of any of the viruses, and its replication is greatly inhibited by the presence of any other virus. These predictions indicate that the model suggests that simultaneous viral infections are a competition for the resource of target cells and that the virus with the largest growth rate will out-compete viruses with slower growth rates. In this way, growth of viruses with a slow growth rate can be blocked by a more rapidly growing virus. Unfortunately, growth of a virus with a fast growth rate will not be altered much by the presence of a slower growing virus. When viruses have comparable growth rates, the competition between the two will reduce replication of both viruses.
Using our model, we can calculate the predicted duration of coinfection for each combination of simultaneous infections. We define coinfection here as the time during which both viruses have a viral load above the detection limit (dashed lines in the figures). The durations of coinfection for each pair of simultaneous infection are given in Fig 5. Our model predicts that even the longest simultaneous infections will be detectable for at most 10 days and that the shortest coinfections will be detectable for 6 days. This window of detectable coinfections explains why so many coinfections are being detected in patients [2–9].
Fig 5. Duration of coinfection for each pair of viruses.

Infections are initiated with the same amount of virus at the same time. Single infections are given by the dashed lines and coninfection dynamics are given by the solid lines.
Giving a competitive advantage
The scenario simulated in the previous section, where infections were started simultaneously with the same viral inoculum might be possible in an in vitro experiment, but in patients, this scenario is highly unlikely. A likely scenario for in vivo coinfections is that a patient starts to experience symptoms from the first infection and visits their doctor or the emergency room where they come into contact with the second virus. These infections are almost certainly not initiated with identical viral inocula either. However, these types of inequalities give a competitive advantage to one of the viruses. If one virus starts replicating before the other appears, it will have unfettered access to all the target cells until the second virus appears. Similarly, a larger initial viral inoculum allows one virus to infect more target cells in the first round of infection, leading to the production of more virus and so on. In this section, we examine the effect of different initial inocula and delayed initiation of the second infection. Since we simply need a single viral combination to use as a test case, we decided to use the viral combination found most often in patients, RSV and rhinovirus [3, 7]. Summary results for the remaining viral combinations are included in S1 Text.
The amount of virus used to initiate an infection plays an important role in deciding infection outcomes [29]. We varied the initial viral inoculum by fixing one viral inoculum and varying the other and then fixing the other viral inoculum and varying the first. Fig 6 shows the coinfection dynamics of RSV and rhinovirus when the initial viral inoculum is different. We see that if the RSV inoculum is large compared to the hRV inoculum, then RSV can suppress the growth of rhinovirus. While hRV can suppress growth of RSV for a wide range of initial inoculum conditions, it will only prevent it from growing past the detection threshold for very low inocula of RSV.
Fig 6. Simultaneous infection of rhinovirus and RSV when initial viral inoculum is varied.

In the top row, the RSV inoculum is fixed and rHV inoculum is varied. In the bottom row, hRV inoculum is fixed and RSV inoculum is varied. The dashed line indicates a typical experimental threshold of detection.
Another way to change the competitive advantage is to vary the starting times for the viruses. This is shown in Fig 7 for RSV and hRV infections. Not surprisingly, an initial rhinovirus infection can block RSV infection when the start of the RSV infection is delayed. An initial RSV infection can also block a rhinovirus infection if there is a sufficient time delay in the start of hRV infection. If the delay of hRV infection is long enough, RSV will have time to infect all of the target cells, leaving the rhinovirus with no resources to grow and the initial hRV inoculum will simply decay. More generally, if the start of the second infection is delayed too long, the first infection uses up all the target cells, suppressing the secondary infection.
Fig 7. Simultaneous infection of rhinovirus and RSV with various time delays between the initiation of the infections.

The dashed line indicates a typical experimental threshold of detection.
Fig 8 illustrates the duration of coinfection for each of these competitive advantages. For fixed hRV inoculum, coinfection is only possible when the initial dose of RSV is approximately equal to the hRV inoculum, while for fixed RSV inoculum, coinfection is possible for almost all the combinations of viral inocula (Fig 8, top left). Fig 8 (top right) gives the coinfection duration as a function of delay if the initial viral inocula are identical. When hRV is the primary infection, the coinfection duration declines more quickly than when RSV is the primary infection. When RSV is the primary infection, the hRV needs a delay of ∼24 h to start reducing the duration of coinfection. In both cases, there is a maximum time delay beyond which coinfections will not occur since all target cells have been infected by the primary virus so the secondary virus cannot grow. Fig 8 (bottom) shows the coinfection duration as a function of both the ratio of initial inocula (x axis) and the delay in the start of the second infection (y axis) when hRV is the primary infection (bottom left) and when RSV is the primary infection (bottom right). Coinfection is possible only with certain combinations of initial viral dose and time delays with a maximum possible coinfection duration of ∼11 d. No matter which virus is the primary infection, we see that a large initial inoculum for the secondary virus will overcome even rather long time delays and will lead to long-lasting coinfections.
Fig 8. Coinfection duration with varying initial viral inoculum and relative starting time of infection.

Coinfection duration as a function of initial viral inoculum (top left), relative starting time (top right) and as a function of both with hRV infection fixed (bottom left) and RSV infection fixed (bottom right).
Discussion
In this paper, we examined a mathematical model of simultaneous respiratory tract viral infections. We tested the model by reproducing the results of an in vitro experiment that examined an RSV and influenza A virus coinfection. Once an appropriate growth rate for RSV was used, the model correctly reproduced viral titers observed during a simultaneous RSV and IAV infection. The model also qualitatively reproduced the measurements of viral load when IAV infection was delayed. Once we had validated the model, we performed an independent study that predicted coinfection durations for various combinations of respiratory viruses. When predicting coinfection durations for combinations of IAV, RSV, hRV, hMPV, and PIV, parameters were estimated from experiments performed in respiratory tract cell cultures. Using these parameters, coinfection dynamics of different pairs of viruses were studied, providing predictions of coinfection dynamics in respiratory tract cells. In this model, the viruses compete for the resource of target cells, so the model predicts that viruses with a higher growth rate will out-compete viruses with a lower growth rate since the faster growing virus will consume more target cells early in the infection. This was seen by the unaltered growth of hRV, which has a high growth rate, in the presence of most of the other viruses. This was also seen in the suppression of replication of PIV, which has the lowest growth rate, when other viruses are present. We found that this competitive advantage could be overcome or amplified by allowing for different initial inocula or by delaying the start of one of the infections.
Implications of our findings
Our key finding is that blocking of one virus infection by the presence of another can be explained simply through resource competition. Some studies have suggested that other mechanisms, such as the immune response [18, 19, 30, 31] or interference through viral proteins [31, 32] are responsible for the growth interference between two viruses. Our model does not include either of these mechanisms, suggesting that they are not necessary to explain the phenomenon. This does not mean, however, that these interactions do not play a role in coinfections, but that they should be considered in addition to resource competition. Interference through immune interactions can be considered a competitive advantage for one of the viruses in much the same way as we examined the effect of initial inoculum or delayed initiation of infection.
Our findings will have implications for the treatment of respiratory infections. Consider a simultaneous infection with influenza and RSV. There are treatments or drugs available for influenza infection [33] but not for RSV [34]. We found that influenza has a higher growth rate than RSV and so will hinder the replication of RSV, probably keeping RSV viral loads low, possibly below the detection level. A patient with this simultaneous infection goes to the doctor, who only detects the influenza infection and decides to treat the infection. Influenza replication is now suppressed by the drug, allowing the hidden RSV infection to emerge. RSV, of course, cannot be treated so the patient will end up suffering through the RSV infection. If the doctor had decided not to treat, influenza would have continued replicating, most likely suppressing the RSV infection.
We could also take advantage of the blocking action of fast-growing viruses. We clearly do not want to infect people with a virus that will make them sick, but there has already been some investigation into the use of defective interfering particles (DIPs) as agents to prevent or treat viral infections [35–37]. DIPs are viruses that contain genetic deletions rendering them unable to replicate on their own, but able to replicate in the presence of virus that provides the missing pieces of genetic material. When able to replicate, DIP-infected cells produce more DIPs than replication-competent virus. Our model suggests that as long as DIP growth is faster than that of the competent virus, it could block growth of the competent virus.
While we examined coinfections in the respiratory tract, this model can also be used to study coinfections in other systems. Multiple infections are not only prevalent in infections of respiratory tract, but also in the gastrointestinal tract [38, 39], liver [40, 41] and genital tract [42]. In nature, persistant viral infections have also been found with viruses such as phage viruses and badnavirus [43]. Our model’s prediction that viral growth rate determines which virus will dominate a simultaneous infection, will likely help to explain the dynamics seen in coinfections of these systems as the fundamental principle of resource competition is at play in these systems as well.
Limitations of the model
As noted in the methods section, this is a rather simple model that makes some assumptions that simplify the biological complexity of the real system. For example, the contribution of the immune response to the interaction of the two viruses is not included. While there have been some attempts to incorporate the immune response into mathematical models of infection, for acute infections, experimental immune data is often too sparse to build accurate models [44]. We have not included the immune response in our model since there is little quantitative information about the immune response to the five viruses studied here, making it difficult to estimate the values of the extra parameters that would be necessary. Our model shows that viruses fundamentally interact through a competition for resources, but stimulating the immune response can potentially enhance or hinder the competitive advantage of one virus, with some studies suggesting that the immune response plays a role in viral interactions during coinfections [18, 19, 30, 31].
Cell regeneration was also not included in the model, but could potentially alter the dynamics of coinfection. In relatively short coinfections of the respiratory tract, cell regeneration largely does not take place until after clearance of the infection [45], but in longer-lasting infections such as hepatitis B and C coinfections [32], regeneration provides a steady supply of fresh target cells, limiting the competitive advantage of the fast-spreading virus. The addition of cell regeneration might make it possible for both viruses to co-exist for a long time leading to chronic coinfection.
We also assumed that there was no superinfection, or that two viruses cannot infect the same host cell simultaneously. While some experiments have observed superinfection exclusion [46] with the same strain, other experiments suggest that superinfection with different viruses is possible [19, 32]. If both viruses are able to coinfect cells, and more importantly, have the cell produce both types of virus, as observed by Shinjoh et al. [19] for RSV and IAV, then this eases some of the resource competition and might alter coinfection dynamics.
Conversely, our model assumes that both viruses infect the same type of cell. However, it is known that respiratory viruses do not necessarily infect the same respiratory cell type. Viruses are well known to exhibit tropism, which is determined by the nature of specific cell surface receptor activity of a virus during the binding process [47]. Two human influenza strains of H1N1 and H3N2 bind more strongly to tracheal and bronchial tissue whereas avian strains of H5N1 and H6N1 attach to type II pneumocytes and alveolar macrophages in the lower respiratory tract [48]. RSV has an affinity to bind with cell-surface nucleolin expression which has been reported to be found in different cell types including not only in respiratory tract but also tissues outside of the respiratory tract [49]. Another study found that hMPV infects primarily the ciliated respiratory epithelial cells [50]. It has also been reported that different types of parainfluenza viruses such as PIV1 and PIV3 are characterized according to their cell binding sites [51]. Rhinovirus were divided into two different groups (minor and major groups) of viruses who use different receptors for cell attachment [52]. In this respect, our investigation is limited by having all the participating viruses infect the same type of cell in the respiratory tract during coinfection given that cell surface receptor specificity for these viruses allows for variation in targeted cell populations. Clearly, if one of the viruses participating in the coinfection has access to target cells not accessible to the second virus it will have a competitive advantage. If the two target cell populations don’t overlap at all, then there will not be direct competition for resources, and the dynamics of the two viruses will be driven by their individual virus-cell interactions.
Guidance for further experimental studies
Since our model neglected a number of factors that might play a role in the duration of coinfections, it would be helpful to have more experimental data to validate the model. While we did fit the model to the limited data available in the literature, more thorough testing of the model is needed. We have provided here predictions of coinfection durations for various combinations of five different respiratory viruses, any of which could be tested through experiments. The ideal experiment would consist of measuring viral titer and dead cells over time, sampling at a minimum of every 12 h, capturing several points during both the growth and decay phases of a single virus in vitro infection for two different viruses. We need both viral load and dead cells to properly identify model parameters for the two viruses [21]. We would then perform several in vitro coinfections with the same two viruses, varying the initial inocula of both viruses or introducing a time delay between the start of the two infections. For the coinfection, we would simply require measurement of the time course of viral titer of both viruses, again sampling frequently and over the entire duration of the infection. As we did here with the Shinjoh data, we would fit the single infection model to the single infection data and use the parameters to predict the dynamics of the resulting coinfections. The model predictions could then be compared to more extensive experimental coinfection data, either giving greater confidence in the model’s validity, or if the model fails to correctly predict viral time courses, motivating extension of the model to include more complexity.
The work presented here represents a first step in modeling respiratory virus coinfections. Our model predictions help elucidate the fundamental competition for resources that drives dynamics of respiratory coinfections, but there are many other factors that can change the competitive balance between the two viruses.
Methods and Model
Mathematical Model
We propose a model based on ordinary differential equations used for explaining influenza viral kinetics [20]. Our model represents the dynamics of simultaneous infection in the human respiratory tract with two viruses, V1 and V2. The model equations are
Model parameters and variables are described in Table 2. As shown in Fig 9, V1 and V2 infect the susceptible uninfected target cells, T, at rates β1 and β2. We assume that one cell can only be infected by one type of virus at a time, i.e. V1 and V2 cannot simultaneously infect the same cell. The newly infected cells enter an eclipse phase, E1 or E2, where infected cells take some time to produce viral components. This delay accounts for intracellular processes related to the synthesis of viral nucleic acid and proteins, viral assembly, maturation and budding. After an average transition time or , the cells become productively infectious cells, I1 and I2, which produce viruses at rates p1 and p2. The lengths of time over which infectious cells produce viruses are denoted by and after which the infectious cells die. Virus is cleared at rates c1 or c2. We assume both viruses attack the same type of target cell population, which is not always the true as respiratory virus infections also depend on the expressions of cell surface receptors [47, 49, 50]. Also, target cell regeneration is neglected here because infections are short compared to the time it takes for cells to regenerate [45]. No explicit immune response is considered in this model since accurate information about its role in viral infections is still lacking [44]. Finally, this model assumes exponential distributions for eclipse and infectious transition times, which is known to be biologically unrealistic [26, 53], but simplifies the computation and should not affect the qualitative predictions of the model. Our model is similar to those of [27, 54] except that they include non-exponential distributions as well as non infectious virus particles in their models.
Table 2. Parameter definitions of the model.
| Parameter | Definition |
|---|---|
| T | number of uninfected target cells |
| E | population which is infected but not yet producing virus |
| I | population which is actively producing virus |
| V | infectious viral titer |
| β | infection rate |
| transition time from E to I | |
| lifespan of infectious cells | |
| p | rate of increase of viral titer per infectious cell |
| c | clearance rate of virus |
| V0 | best fit initial virus titer |
| T0 | amount of initial target cells |
Fig 9. Mathematical model of simultaneous infection by two viruses.

The two viruses infect the same target cell population, but coinfection of single cells is not allowed. Once infected, they enter an eclipse phase where they take some time before actively producing viruses. Newly produced viruses go on to infect other target cells.
Experimental data
We require experimental data for two purposes. We would like to test the ability of the model to reproduce experimental data from coinfections and we would then like to use the model to make predictions about coinfections with other respiratory viruses. To achieve the first goal, we looked for in vitro experiments studying simultaneous infections of respiratory viruses. The only experimental data we found was the RSV and influenza coinfection experiment by Shinjoh et al. [19]. In this experiment, they infect MDCK cells with a long strain of RSV and A/WSN/33 (H1N1) strain of influenza virus at a multiplicity of infection (MOI) of 0.001 both as single infections and as a simultaneous infection. While the quantitative data from this experiment is limited, we nonetheless try to use it as a minimal test of the validity of the model. The data extracted from the in vitro experiments of Shinjoh et. al. are available in S1 Table.
To achieve the second goal of this paper, we required experimental data of single respiratory virus infections. Our model has 5 parameters and requires that we have information on both the viral growth phase and the viral decay phase. In order to properly parameterize the model, we searched for viral titer measurements from in vitro multiple cycle infections performed in human respiratory tract cell lines which contain both growth and decay phases. These requirements for the data limited the number of viruses we could include in our study since we found suitable data only for IAV, RSV, hRV, PIV, and hMPV. When validating the model, the data used is taken from infections in MDCK cells while predicting viral time courses for combinations of IAV, RSV, hRV, hMPV, and PIV, parameters are to be estimated from experiments performed in respiratory tract cell cultures. A summary of the data sets used to parameterize respiratory viruses are shown in Table 3.
Table 3. Experimental data used to parameterize common respiratory tract infections.
| Paper | Virus | Cell type |
|---|---|---|
| Danzy et al. [55] | Influenza NL/09 | Human tracheo-bronchial epithelial |
| Liesman et al. [56] | RSV A2 | Human airway epithelium |
| Yamamya et al. [57] | Rhinovirus 14 | Human tracheal submucosal gland cells |
| Bartlett et al. [58] | Parainfluenza 1 | Human airway epithelium |
| Scagnolari et al. [59] | hMPV NL-001 | Human epithelial type 2 |
Fitting procedure
Data were extracted using www.WebPlotDigitizer.com. We fit each data set with a single virus model using custom-written software in Octave 3.6.4 [60] that uses either the leasqr function, which uses Levenberg-Marquardt nonlinear regression, or the nelder_mead_min function which uses Nelder-Mead minimization to minimize SSR.
Confidence intervals for parameter fits are found through parametric bootstrapping [61]. 1000 surrogate data sets are generated by adding randomized errors to the best fit model prediction. The best fit to these new data sets are found using the same procedures described earlier. Resulting parameter values are ranked and used to determine the 95% confidence intervals.
Supporting Information
Coinfection duration as a function of initial viral inoculum (top left), delay (top right) and as a function of both for the remaining combinations of IAV, RSV, hRV, hMPV, and PIV.
(PDF)
Shinjoh in vitro experimental viral load data.
(PDF)
Data Availability
All relevant data are within the paper and its Supporting Information files.
Funding Statement
The authors have no support or funding to report.
References
- 1. Global Burden of Disease Study. Global, regional, and national incidence, prevalence, and years lived with disability for 301 acute and chronic diseases and injuries in 188 countries, 1990-2013: a systematic analysis for the Global Burden of Disease Study 2013. Lancet. 2015. August 22;386(9995):743–800. 10.1016/S0140-6736(15)60692-4 [DOI] [PMC free article] [PubMed] [Google Scholar]
- 2. Waner JL. Mixed viral infections: detection and management. Clin Microbiol Rev. 1994. April;7(2):143–151. [DOI] [PMC free article] [PubMed] [Google Scholar]
- 3. Goka EA, Vallely PJ, Mutton KJ, Klapper PE. Single, dual and multiple respiratory virus infections and risk of hospitalization and mortality. Epidemiol Infect. 2015. January;143(1):37–47. 10.1017/S0950268814000302 [DOI] [PMC free article] [PubMed] [Google Scholar]
- 4. Goka E, Vallely P, Mutton K, Klappera P. Influenza A viruses dual and multiple infections with other respiratory viruses and risk of hospitalisation and mortality. Influenza Other Respir Viruses. 2013. November;7(6):1079–1087. 10.1111/irv.12020 [DOI] [PMC free article] [PubMed] [Google Scholar]
- 5. Martin ET, Kuypers J, Wald A, Englund JA. Multiple versus single virus respiratory infections: viral load and clinical disease severity in hospitalized children. Influenza and other respir viruses. 2011. May;6(1):71–77. 10.1111/j.1750-2659.2011.00265.x [DOI] [PMC free article] [PubMed] [Google Scholar]
- 6. Martin ET, Fairchok MP, Stednick ZJ, Kuypers J, Englund JA. Epidemiology of Multiple Respiratory Viruses in Childcare Attendees. JID. 2013. January;207:982–989. 10.1093/infdis/jis934 [DOI] [PMC free article] [PubMed] [Google Scholar]
- 7. Brand HK, de Groot R, Galama JMD, Brouwer ML, Teuwen K, Hermans PWM, et al. Infection With Multiple Viruses is not Associated With Increased Disease Severity in Children With Bronchiolitis. Pediatr Pulmonol. 2012. April;47(4):393–400. 10.1002/ppul.21552 [DOI] [PMC free article] [PubMed] [Google Scholar]
- 8. Zhang G, Hu Y, Wang H, Zhang L, Bao Y, Zhou X. High Incidence of Multiple Viral Infections Identified in Upper Respiratory Tract Infected Children under Three Years of Age in Shanghai, China. PLoS ONE. 2012. September;7(9):e44568 10.1371/journal.pone.0044568 [DOI] [PMC free article] [PubMed] [Google Scholar]
- 9. Rotzen-Ostlund M, Eriksson M, Lindell AT, Allander T, Wirgart BZ, Grillner L. Children with multiple viral respiratory infections are older than those with single viruses. Acta paediatr. 2014. January;103(1):100–104. 10.1111/apa.12440 [DOI] [PMC free article] [PubMed] [Google Scholar]
- 10. Hara M, Takao S, Shimazu Y, Nishimura T. Three-Year Study of Viral Etiology and Features of Febrile Respiratory Tract Infections in Japanese Pediatric Outpatients. Ped Inf Dis J. 2014;33(7):687–692. 10.1097/INF.0000000000000227 [DOI] [PubMed] [Google Scholar]
- 11. Ratnamohan VM, Taylor J, Zeng F, McPhie K, Blyth CC, Adamson S, et al. Pandemic clinical case definitions are non-specific: multiple respiratory viruses circulating in the early phases of the 2009 influenza pandemic in New South Wales, Australia. Virol J. 2014. June 18;11:113 10.1186/1743-422X-11-113 [DOI] [PMC free article] [PubMed] [Google Scholar]
- 12. Henle W. Interference Phenomena Between Animal Viruses: A Review. J Immunol. 1950;64:203–236. [PubMed] [Google Scholar]
- 13. Findlay GM, MacCallum FO. An interference phenomenon in relation to yellow fever and other viruses. J Path Bact. 1937;44(2):405–424. 10.1002/path.1700440216 [DOI] [Google Scholar]
- 14. Andrewes CH. Interference by one virus with the growth of another in tissue-culture. Brit J Exp Path. 1942;23(4):214–220. [Google Scholar]
- 15. Ziegler JE, Horsfall F. Interference between the influenza viruses: 1. The effect of active viruses upon the multiplication of influenza viruses in the chick embryo. J Virol. 2002. May;76(9):4420–4429.11932409 [Google Scholar]
- 16. Aberle JH, Aberle SW, Pracher E, Hutter HP, Kundi M, Popow-Kraupp T. Single Versus Dual Respiratory Virus Infections in Hospitalized Infants Impact on Clinical Course of Disease and Interferon γ Response. Pediatr Infect Dis J. 2005. July;24(7):605–610. 10.1097/01.inf.0000168741.59747.2d [DOI] [PubMed] [Google Scholar]
- 17. Liang L, He C, Lei M, Li S, Hao Y, Zhu H, et al. Pathology of Guinea Pigs Experimentally Infected with a Novel Reovirus and Coronavirus Isolated from SARS Patients. DNA Cell Biol. 2005. August;24(8):485–490. 10.1089/dna.2005.24.485 [DOI] [PubMed] [Google Scholar]
- 18. Dobrescu I, Levast B, Lai K, Delgado-Ortega M, Walker S, Banman S, et al. In vitro and ex vivo analyses of co-infections with swine influenza and porcine reproductive and respiratory syndrome viruses. Vet mircobiol. 2014. February;169(1-2):18–32. [DOI] [PMC free article] [PubMed] [Google Scholar]
- 19. Shinjoh M, Omoe K, Saito N, Matsuo N, Nerome K. In vitro growth profiles of respiratory syncytial virus in the presence of influenza virus. Acta Virologica. 2000;44(2):91–97. [PubMed] [Google Scholar]
- 20. Baccam P, Beauchemin C, Macken CA, Hayden FG, Perelson AS. Kinetics of influenza A virus infection in humans. J Virol. 2006. August;80(15):7590–7599. 10.1128/JVI.01623-05 [DOI] [PMC free article] [PubMed] [Google Scholar]
- 21. Miao H, Xia X, Perelson AS, Wu H. On Identifiability of Nonlinear ODE Models and Applications in Viral Dynamics. SIAM Review. 2011;53(1):3–39. 10.1137/090757009 [DOI] [PMC free article] [PubMed] [Google Scholar]
- 22. Smith AM, Adler FR, Perelson AS. An accurate two-phase approximate solution to an acute viral infection model. J Math Biol. 2010. May;60(5):711–726. 10.1007/s00285-009-0281-8 [DOI] [PMC free article] [PubMed] [Google Scholar]
- 23. Beauchemin CAA, McSharry JJ, Drusano GL, Nguyen JT, Went GT, Ribeiro RM, et al. Modeling amantadine treatment of influenza A virus in vitro. J Theor Biol. 2008. September;254(2):439–451. 10.1016/j.jtbi.2008.05.031 [DOI] [PMC free article] [PubMed] [Google Scholar]
- 24. LaBarre DD, Lowy RJ. Improvements in methods for calculating virus titer estimates from TCID50 and plaque assays. J Virol Meth. 2001. August;96(2):107–126. 10.1016/S0166-0934(01)00316-0 [DOI] [PubMed] [Google Scholar]
- 25. Paradis EG, Pinilla LT, Holder BP, Abed Y, Boivin G, Beauchemin CAA. Impact of the H275Y and I223V Mutations in the Neuraminidase of the 2009 Pandemic Influenza Virus In Vitro and Evaluating Experimental Reproducibility. PLoS ONE. 2015. May;10(5):e0126115 10.1371/journal.pone.0126115 [DOI] [PMC free article] [PubMed] [Google Scholar]
- 26. Holder BP, Simon P, Liao LE, Abed Y, Bouhy X, Beauchemin CAA, et al. Assessing the In Vitro Fitness of an Oseltamivir-Resistant Seasonal A/H1N1 Influenza Strain Using a Mathematical Model. PLoS ONE. 2011. March;6(3):e14767 10.1371/journal.pone.0014767 [DOI] [PMC free article] [PubMed] [Google Scholar]
- 27. Pinilla LT, Holder BP, Abed Y, Boivin G, Beauchemin CAA. The H275Y Neuraminidase Mutation of the Pandemic A/H1N1 Influenza Virus Lengthens the Eclipse Phase and Reduces Viral Output of Infected Cells, Potentially Compromising Fitness in Ferrets. J Virol. 2012. October;86(19):10651–10660. 10.1128/JVI.07244-11 [DOI] [PMC free article] [PubMed] [Google Scholar]
- 28. Gonzalez-Parra GC, Dobrovolny HM. Assessing uncertainty in A2 respiratory syncytial virus (RSV) viral dynamics. Comput Math Methods Med. 2015. 30 August;2015:567589 10.1155/2015/567589 [DOI] [PMC free article] [PubMed] [Google Scholar]
- 29. Li Y, Handel A. Modeling inoculum dose dependent patterns of acute virus infections. J Theor Biol. 2014. April;347:63–73. 10.1016/j.jtbi.2014.01.008 [DOI] [PubMed] [Google Scholar]
- 30. Wiegand SB, Jaroszewicz J, Potthoff A, honer zu Siederdissen C, Maasoumy B, Deterding K, et al. Dominance of hepatitis C virus (HCV) is associated with lower quantitative hepatitis B surface antigen and higher serum interferon-gamma-induced protein 10 levels in HBV/HCV-coinfected patients. Clin Microbiol Infection. 2015. July;21(7):710.e1–9. 10.1016/j.cmi.2015.03.003 [DOI] [PubMed] [Google Scholar]
- 31. Lin L, Verslype C, van Pelt JF, van Ranst M, Fevery J. Viral interaction and clinical implications of coinfection of hepatitis C virus with other hepatitis viruses. Eur J Gastroenterol Hepatol. 2006. December;18(12):1311–1319. 10.1097/01.meg.0000243881.09820.09 [DOI] [PubMed] [Google Scholar]
- 32. Bellecave P, Gouttenoire J, Gajer M, Brass V, Koutsoudakis G, Blum H, et al. Hepatitis B and C virus coinfection: a novel model system reveals the absence of direct viral interference. Hepatology. 2009. July;50(1):46–55. 10.1002/hep.22951 [DOI] [PubMed] [Google Scholar]
- 33. Wiwanitkit V. Rates and effectiveness of antiviral use among hospitalized influenza patients. Expert Rev Anti-Infective Ther. 2015. July;13(7):835–842. 10.1586/14787210.2015.1043890 [DOI] [PubMed] [Google Scholar]
- 34. Clercq ED. Chemotherapy of respiratory syncytial virus infections: the final breakthrough. Intl J Antimicrob Agents. 2015. March;45(3):234–237. 10.1016/j.ijantimicag.2014.12.025 [DOI] [PubMed] [Google Scholar]
- 35. Easton AJ, Scott PD, Edworthy NL, Meng B, Marriott AC, Dimmock NJ. A novel broad-spectrum treatment for respiratory virus infections: Influenza-based defective interfering virus provides protection against pneumovirus infection in vivo. Vaccine. 2011. March 24;29(15):2777–2784. 10.1016/j.vaccine.2011.01.102 [DOI] [PubMed] [Google Scholar]
- 36. Dimmock NJ, Easton AJ. Cloned Defective Interfering Influenza RNA and a Possible Pan-Specific Treatment of Respiratory Virus Diseases. Viruses. 2015;2015(7):3768–3788. 10.3390/v7072796 [DOI] [PMC free article] [PubMed] [Google Scholar]
- 37. Scott PD, Meng B, Marriott AC, Easton AJ, Dimmock NJ. Defective interfering influenza A virus protects in vivo against disease caused by a heterologous influenza B virus. J Gen Virol. 2011. September;92(9):2122–2132. 10.1099/vir.0.034132-0 [DOI] [PubMed] [Google Scholar]
- 38. Valentini D, Vittucci AC, Grandin A, Tozzi AE, Russo C, Onori M, et al. Coinfection in acute gastroenteritis predicts a more severe clinical course in children. Eur J Clin Microbiol Infect Dis. 2013. July;32(7):909–915. 10.1007/s10096-013-1825-9 [DOI] [PubMed] [Google Scholar]
- 39. Koh H, Baek SY, Shin JI, Chung KS, Jee YM. Coinfection of Viral Agents in Korean Children with Acute Watery Diarrhea. J Korean Med Sci. 2008. May;6(23):937–940. 10.3346/jkms.2008.23.6.937 [DOI] [PMC free article] [PubMed] [Google Scholar]
- 40. Chu CJ, Lee SD. Hepatitis B virus/hepatitis C virus coinfection: Epidemiology, clinical features, viral interactions and treatment. J Gastroenterol Hepatol. 2008. May;23(4):512–520. 10.1111/j.1440-1746.2008.05384.x [DOI] [PubMed] [Google Scholar]
- 41. Pokorska-Śpiewak M, Kowalik-Mikolajewska B, Aniszewska M, zena Walewska-Zielecka B, Marczyńska M. The influence of hepatitis B and C virus coinfection on liver histopathology in children. Eur J Pediatr. 2015. March;174(3):345–353. 10.1007/s00431-014-2402-7 [DOI] [PMC free article] [PubMed] [Google Scholar]
- 42. Freire MP, Pires D, Forjaz R, Sato S, Cotrim I, Stiepcich M, et al. Genital prevalence of HPV types and co-infection in men. Int Braz J Urol. 2014. January;1(40):67–71. [DOI] [PubMed] [Google Scholar]
- 43. DaPalma T, Doonan BP, Trager NM, Kasman LM. A systematic approach to virus-virus interactions. Virus Res. 2010. April;149(1):1–9. 10.1016/j.virusres.2010.01.002 [DOI] [PMC free article] [PubMed] [Google Scholar]
- 44. Dobrovolny HM, Reddy MB, Kamal MA, Rayner CR, Beauchemin CAA. Assessing mathematical models of influenza infections using features of the immune response. PLoS One. 2013. 28 February;8(2):e57088 10.1371/journal.pone.0057088 [DOI] [PMC free article] [PubMed] [Google Scholar]
- 45. Crystal RG, West JB. The Lung: Scientific Foundations. New York, USA: Raven Press Ltd.; 1991. [Google Scholar]
- 46. Folimonova SY, Harper SJ, Leonard MT, Triplett EW, Shilts T. Superinfection exclusionby Citrus tristeza virus does not correlate with the production of viral small RNAs. Virology. 2014. November;468-470:462–71. 10.1016/j.virol.2014.08.031 [DOI] [PubMed] [Google Scholar]
- 47. Matrosovich M, Herrler G, Klenk HD. Sialic Acid Receptors of Viruses. Top Curr Chem. 2015;367:1–28. 10.1007/128_2013_466 [DOI] [PMC free article] [PubMed] [Google Scholar]
- 48. Mansfield KG. Viral Tropism and the Pathogenesis of Influenza in the Mammalian Host. Am J Pathol. 2007. October;171(4):1089–1092. 10.2353/ajpath.2007.070695 [DOI] [PMC free article] [PubMed] [Google Scholar]
- 49. Shakeri A, Mastrangelo P, Griffin JK, Moraes TJ, Hegele RG. Respiratory syncytial virus receptor expression in the mouse and viral tropism. Histol Histopathol. 2015;30:401–411. [DOI] [PubMed] [Google Scholar]
- 50. Kuiken T, van den Hoogen BG, van Riel DAJ, Laman JD, van Amerongen G, Sprong L, et al. Experimental Human Metapneumovirus Infection of Cynomolgus Macaques (Macaca fascicularis) Results in Virus Replication in Ciliated Epithelial Cells and Pneumocytes with Associated Lesions throughout the Respiratory Tract. Am J pathol. 2004. June;164(6):1893–1900. 10.1016/S0002-9440(10)63750-9 [DOI] [PMC free article] [PubMed] [Google Scholar]
- 51. Lehmanna F, Tiralongo E, Tiralongo J. Sialic acid-specific lectins: occurrence, specificity and function. Cell Mol Life Sci. 2006;63:1331–1354. 10.1007/s00018-005-5589-y [DOI] [PMC free article] [PubMed] [Google Scholar]
- 52. Vlasak M, Roivainen M, Reithmayer M, Goesler I, Laine P, Snyers L, et al. The Minor Receptor Group of Human Rhinovirus (HRV) Includes HRV23 and HRV25, but the Presence of a Lysine in the VP1 HI Loop Is Not Sufficient for Receptor Binding. J of Virol. 2005. June;79(12):7389–7395. 10.1128/JVI.79.12.7389-7395.2005 [DOI] [PMC free article] [PubMed] [Google Scholar]
- 53. Kakizoe Y, Morita S, Nakaoka S, Takeuchi Y, Sato K, Miura T, et al. A conservation law for virus infection kinetics in vitro. J Theor Biol. 2015. April;376:39–47. 10.1016/j.jtbi.2015.03.034 [DOI] [PubMed] [Google Scholar]
- 54. Petrie SM, Butler J, Barr IG, McVernon J, Hurt AC, McCaw JM. Quantifying relative within-host replication fitness in influenza virus competition experiments. J Theor Biol. 2015. October;382(7):256–271. [DOI] [PubMed] [Google Scholar]
- 55. Danzy S, Studdard LR, Manicassamy B, Solorzano A, Marshall N, García-Sastre A, et al. Mutations to PB2 and NP Proteins of an Avian Influenza Virus Combine To Confer Efficient Growth in Primary Human Respiratory Cells. J Virol. 2014. September;88(22):13436–13446. 10.1128/JVI.01093-14 [DOI] [PMC free article] [PubMed] [Google Scholar]
- 56. Liesman RM, Buchholz UJ, Luongo CL, Yang L, Proia AD, DeVincenzo JP, et al. RSV-encoded NS2 promotes epithelial cell shedding and distal airway obstruction. J Clin Invest. 2014. May;124(5):2219–2233. 10.1172/JCI72948 [DOI] [PMC free article] [PubMed] [Google Scholar]
- 57. Yamaya M, Sekizawa K, Suzuki T, Yamada N, Furukawa M, Ishizuka S, et al. Infection of human respiratory submucosal glands with rhinovirus: effects on cytokine and ICAM-1 production. Am J Physiol. 1999. August;277(2 Pt 1):L362–71. [DOI] [PubMed] [Google Scholar]
- 58. Bartlett EJ, Hennessey M, Skiadopoulos MH, Schmidt AC, Collins PL, Murphy BR, et al. Role of Interferon in the Replication of Human Parainfluenza Virus Type 1 Wild Type and Mutant Viruses in Human Ciliated Airway Epithelium. J Virol. 2008. August;82(16):8059–8070. 10.1128/JVI.02263-07 [DOI] [PMC free article] [PubMed] [Google Scholar]
- 59. Scagnolari C, Trombetti S, Selvaggi C, Carbone T, Monteleone K, Spano L, et al. In vitro sensitivity of human metapneumovirus to type I interferons. Viral Immun. 2011;24(2):159–164. 10.1089/vim.2010.0073 [DOI] [PubMed] [Google Scholar]
- 60.Eaton JW. GNU Octave version 3.6.4; 2010. A free open-source software for solving linear and nonlinear problems numerically, and for performing other numerical experiments using a language that is mostly compatible with Matlab. Available at: http://www.octave.org/
- 61. Efron B, Tibshirani R. Bootstrap methods for standard errors, confidence intervals, and other measures of statistical accuracy. Statistical Science. 1986. February;1(1):54–75. 10.1214/ss/1177013815 [DOI] [Google Scholar]
Associated Data
This section collects any data citations, data availability statements, or supplementary materials included in this article.
Supplementary Materials
Coinfection duration as a function of initial viral inoculum (top left), delay (top right) and as a function of both for the remaining combinations of IAV, RSV, hRV, hMPV, and PIV.
(PDF)
Shinjoh in vitro experimental viral load data.
(PDF)
Data Availability Statement
All relevant data are within the paper and its Supporting Information files.