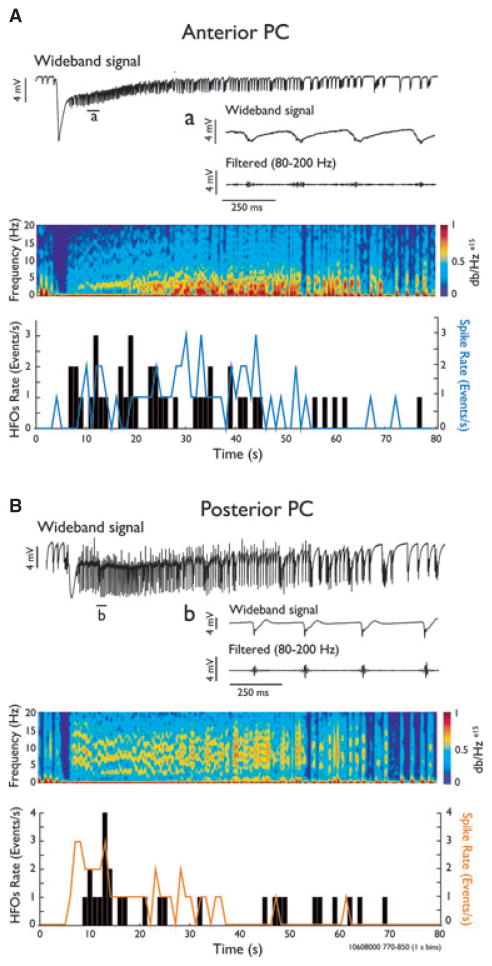
Figure 3.
High frequency oscillation in the 80–200 Hz range is associated with ictal events. Recordings from a sagittal brain slice with corresponding spectral analyses showing an ictal discharge in the anterior (A) and posterior (B) regions. Wideband and filtered traces (80–200 Hz) showing high-frequency activity during a 1 s time period are shown in a and b. Time histograms (1 s bins) indicate the HFO occurrence (black bars, 1 s bins) and the frequency of spikes occurring during ictal activity (solid lines) for the events shown in A and B.

