

Abstract
Alterations in chromatin accessibility independent of DNA methylation can affect cancer-related gene expression, but are often overlooked in conventional epigenomic profiling approaches. In this study, we describe a cost-effective and computationally simple assay called AcceSssIble to simultaneously interrogate DNA methylation and chromatin accessibility alterations in primary human clear cell renal cell carcinomas (ccRCC). Our study revealed significant perturbations to the ccRCC epigenome, and identified gene expression changes that were specifically attributed to the chromatin accessibility status whether or not DNA methylation was involved. Compared to commonly mutated genes in ccRCC, such as the von Hippel-Lindau (VHL) tumor suppressor, the genes identified by AcceSssIble comprised distinct pathways and more frequently underwent epigenetic changes, suggesting that genetic and epigenetic alterations could be independent events in ccRCC. Specifically, we found unique DNA methylation-independent promoter accessibility alterations in pathways mimicking VHL deficiency. Overall, this study provides a novel approach for identifying new epigenetic-based therapeutic targets, previously undetectable by DNA methylation studies alone, that may complement current genetic-based treatment strategies.
Keywords: Chromatin accessibility, DNA methylation, Epigenetically regulated genes, ccRCC, Uncultured tumors
Introduction
Renal cell carcinoma (RCC) is one of the ten most common malignancies and accounts for 2-3% of all adult malignancies and more than 100,000 deaths per year worldwide(1,2). The most common RCC subtype is clear cell Renal Cell Carcinoma (ccRCC), representing 75% of RCC cases(2). Although the relative 5-year survival rate of localized ccRCC is 91%, 23% of patients present with metastatic disease, and their survival rate drops to 11%(2,3). Thus, there is an unmet need to improve the clinical management of ccRCC patients and prevent metastases by identifying novel therapeutic targets and biomarkers with prognostic/diagnostic value.
Recent advancements in DNA sequencing technology have allowed for the identification of mutations in primary tumors, which could have biological as well as diagnostic and clinical utilities(4-6). Beyond genetic changes, DNA methylation alterations have been found in all types of cancers, including ccRCC(6-8), but alternative epigenetic mechanisms, such as alterations in accessibility of regulatory regions which may or may not involve in DNA methylation(9), that contribute to tumorigenesis have not been fully investigated(10) Epigenetic events can drive tumorigenesis and determine progression(11), and may therefore be used to monitor treatment response(12,13) and inform therapeutic approaches(12-14). Furthermore, epigenetic changes are potentially reversible and may be pharmaceutically altered(12), thus mapping the changes between normal and tumor tissue will provide novel information which can be used to identify functional regions or genes (“epigenetic driver genes”) that undergo epigenetic changes and ultimately drive tumorigenesis(10).
Increasing evidence indicates causal links between epigenetic and genetic changes that arise during tumorigenesis(15,16), however, these changes often occur independently of each other(17). Therefore, understanding the aberrant epigenetic changes present in specific tumor types holds significant clinical promise. Nucleosome occupancy has been recognized as an important epigenetic regulator of gene expression by facilitating or inhibiting the accessibility of chromatin to the transcription machinery(15,16,18). Therefore, in this study, we used the AcceSssIble assay(19) to simultaneously analyze DNA methylation and chromatin accessibility in uncultured clinical samples. This method takes advantage of the Illumina Infinium HumanMethylation450 (HM450) platform, requires only small quantities of DNA (<1 μg), and provides a cost-effective and comprehensive way to analyze the epigenomes of primary tissues while using simple computational tools for analysis.
We examined DNA methylation and chromatin accessibility changes in six primary ccRCC tumors compared to adjacent normal tissues. Our experiments revealed a significant number of epigenetically regulated genes dependent on chromatin accessibility alterations with or without involvement of DNA methylation in ccRCC samples, validated by ChIP-seq on two sets of primary tumors and furthermore with large cohorts from The Cancer Genome Atlas (TCGA). Overall, these studies demonstrate a novel approach that can help identify potential epigenetic driver genes beyond DNA methylation, new therapeutic targets for ccRCC treatment strategy, including personalized medicine.
Materials and Methods
Tissue Sample Collection
Tumors and adjacent normal tissues were collected from patients undergoing partial or total nephrectomy at the USC Norris Comprehensive Cancer Center in compliance with Institute Review Board approved protocols with patients’ consent. The tissue samples were collected under supervision of pathologist, and tumor tissues are at least over 70% of tumor purity.
AcceSssIble Assay
The principle of this assay has been described and published(19). See Figure 1 for protocol schematic. Patient ccRCC tumor and adjacent normal tissue were processed into 1-3 mm pieces with a razor, while any visible fat/vasculature were excised. 20 mg of each minced tissue placed in separate tubes and washed twice with ice-cold PBS buffer then resuspended in 1 ml PBS. This suspension was poured into a dounce homogenizer and ground/dounced 10-15 times until a homogenous, milky suspension was achieved. The suspension was then passed through a 40 μM filter, 1 ml of Lysis Buffer (10 mM Tris (pH 7.4), 10 mM NaCl, 3 mM MgCl2, 0.1 mM EDTA, 0.5% NP-40) was added, and the cells were centrifuged at 3000 rpm for 5min at 4°C. The supernatant was removed and the pellets were suspended in 2 ml Wash Buffer (10 mM Tris (pH 7.4), 10 mM NaCl, 3 mM MgCl2, 0.1 mM EDTA), then separated into two microcentrifuge tubes (No Enzyme and M.SssI reactions), and centrifuged again at 3000 rpm for 5 min at 4°C. The supernatant was removed and the following was added to each tube: 84.25 μl 1X NEBuffer 2, 7.5 μl 10X NEBuffer 2, 45 μl 1 M sucrose, 1.5 μl 32 mM S-adenosylmethionine (SAM), and 12.5 μl 4 U/μl M.SssI (or H2O for No Enzyme tube). The reaction mixtures were flicked to mix, then incubated at 37°C for 15 minutes. Pre-warmed (37°C) 300 μl Stop Solution (10 mM Tris-HCl (pH 7.9), 600 mM NaCl, 1% SDS, 0.1 mM EDTA) and 6 μl Proteinase K were added to each tube, and each reaction mixture was incubated at 55°C for 16 hours. The DNA was then purified by phenol/chloroform extraction and ethanol precipitation, then re-dissolved in 20 μl ddH2O for subsequent analyses.
Figure 1. Diagram of AcceSssIble assay.
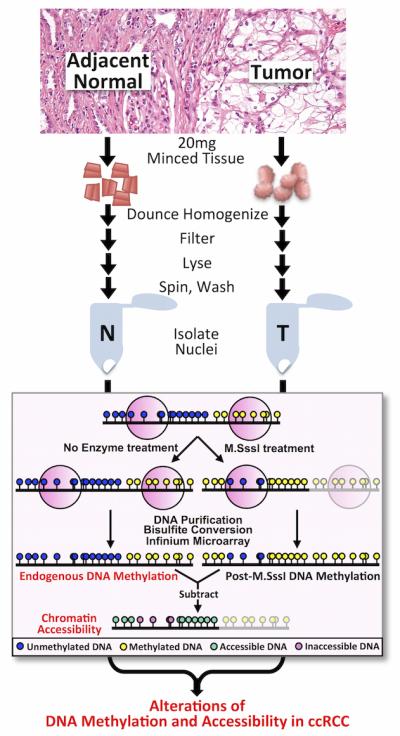
Tissues were obtained and processed as described in Materials and Methods. Tissues were processed and nuclei were either left untreated or were treated with the M.SssI methyltransferase enzyme. Endogenously methylated loci are unable to be interrogated (as illustrated). Following bisulfite conversion and HM450 analyses, untreated (endogenous) DNA methylation values from each sample were subtracted from respective enzyme-treated (exogenous) DNA methylation values, revealing chromatin accessibility changes.
Quality Control M.SssI Treatment
One μg of No-Enzyme- or M.SssI-treated DNA underwent bisulfite conversion using the Zymo EZ DNA Methylation Kit. Bisulfite (BS)-converted DNA was then analyzed via high resolution melt (HRM) analysis using the Bio-Rad Precision Melt Supermix (Catalog #172-5110) (Reaction mix: 10 μl Precision Melt Supermix, 0.8 μl 5 μM each primer mix, 1 μl BS-converted DNA, 8.2 μl ddH2O) (PCR Protocol: 95°C for 00:02:00, [95°C for 00:00:10, 58°C for 00:00:30, plate read, 72°C for 00:00:30] × 60 cycles, 95°C for 00:00:30, 60°C for 00:01:00, Melt Curve 65°C to 90°C [00:00:10 and plate read at each degree]). Primer sequences: ACTB: 5′-AGAGGGGGTAAAAAAATGTTGTAT-3′, 5′-TCGAACCATAAAAAACAACTTTC-3′; GADPH: 5′-TTTTAAGATTTTGGGTTGGGT-3′, 5′-CTATCGAACAAAAAAAACAAAAAAC-3′; C1D: 5′-TTTTTGGAGAAGAGTTAAGGAGTAGG-3′; 5′-ACTCCAATCTCCCGAAAAAC-3′; RPLP0: 5′-AGGTGGTAGTAGTTTAGAGTAAGTTTT-3′, 5′-CGAATACAAACAACCATTAAATA-3′. Proper M.SssI treatment was verified via a shift in melting curves upon methylation (Supplementary Figure 8). 0.5 μg BS-treated DNA samples with verified M.SssI treatment were then submitted for HM450 analysis.
Infinium® HumanMethylation450 BeadChip Assay and Data Processing
The amount of bisulfite-converted DNA and the completeness of bisulfite conversion were determined using a panel of MethyLight-based quality control (QC) tests as described previously(20). All samples passed these QC tests and entered the HM450 assay data production pipeline(21).
The HM450 probes, interrogating ~485,000 CpG sites, were filtered to remove probes with a detection p-value >0.05, located within 15 base pairs of a single-nucleotide polymorphism, mapped to multiple locations, or on the sex chromosomes. The end result is a dataset of corrected beta-values for 385,826 probes which cover ~19,500 genes.
HM450 Data Analysis
In general, the data analysis has been described in our previous publications(19,21). Corrected β-values (range 0-1) of no enzyme control (NoE, endogenous methylation values for each CpG locus) were then subtracted from corrected β-values from M.SssI-treated samples to obtain DNA accessibility values (Acc) for each CpG site. Acc and NoE values for each tumor sample were then subtracted from their respective values in the adjacent normal samples, resulting in delta-methylation (ΔMeth) and delta-accessibility (ΔAcc) values. ΔMeth and ΔAcc values (Δβ-values) were used in subsequent analyses as values for changes in DNA methylation and accessibility, using a cutoff of Δβ-value +/−0.15 for changes at each locus. These changes were split into 6 groups, a-e (Figure 2B). Loci with endogenous methylation β-values >0.8 were discarded from analysis, as we are unable to interrogate accessibility changes at these loci, nor determine if any DNA methylation changes are accessibility-dependent or -independent changes.
Figure 2. Overview of AcceSssIble data in ccRCC tumor/normal tissue pairs.

A) Δβ-values of no-enzyme-treated (endogenous methylation) and M.SssI-treated (accessibility) samples were plotted to visualize DNA methylation and accessibility changes simultaneously. Bar plots quantify these changes and illustrate the distribution of CpG-islands and probe location. B) Six groups of epigenetic changes analyzed: Group a, loss of chromatin accessibility but gain in DNA methylation; Group b, no change in chromatin accessibility but gain in DNA methylation; Group c, no change in chromatin accessibility but loss of DNA methylation; Group d, gain in DNA accessibility but loss of DNA methylation; Group e, loss of chromatin accessibility but no change in DNA methylation; Group f, gain in chromatin accessibility but no change in DNA methylation.
For intersection with TCGA data, loci with accessibility changes from Supplementary Figure 3 were filtered for those that lay within 200 bp upstream of transcription start sites (TSSs). These loci were then intersected with HM450 methylation data (146 tumor-normal pairs), and the genes associated with each locus were intersected with RNA-seq (70 tumor-normal pairs) data from TCGA (see Gene Expression Analysis below). These data were then filtered for loci for which respective genes have a >5-fold change in normalized read count expression values in either direction in at least 20% of tumor-normal pairs, resulting in gene promoter DNA methylation-independent and -dependent accessibility changes with significant correlated gene expression changes from a large consortium. This list was used for statistical analyses (Spearman test) to determine the correlation between accessibility and/or methylation changes vs. gene expression (Supplementary Figure 6). This list was further filtered to only include loci in which accessibility and gene expression changes were directly correlated (illustrated in Figure 4 and listed in Supplementary Tables 1 and 2), and this filtered list was used in subsequent pathway analyses.
Figure 4. Accessibility in gene promoters intersected with DNA methylation and expression data from a larger cohort (TCGA).

Data from Groups a, d-f (filtered for those within 200bp upstream of transcription start sites (TSSs)) were intersected with a large sets of ccRCC HM450 and RNA-seq data from TCGA. CpG islands are depicted in dark green, with gray indicating non-CpG islands. See materials and methods for details in analysis and filtering.
Chromatin Immunoprecipitation (ChIP)-seq
Flash-frozen minced tissue was thawed in cell culture medium (Gibco® Keratinocyte-SFM (1X) Catalog #17005-042) with 1% formaldehyde for 10 minutes under rotation for cross-linking, which was then quenched with 2M Glycine (final concentration of 100mM). Minced tissue was then washed twice with ice-cold PBS with Protease Inhibitor Cocktail (PIC) and resuspended in 1mL ChIP Lysis Buffer (1% SDS, 50mM Tris HCl pH 8.1, 10mM EDTA) with PIC. The suspension was ground in a dounce homogenizer 10-15 times and then passed through a 40μM filter and checked for lysis with Trypan Blue under a microscope. The nuclei were then sonicated using a probe sonicator (Branson Sonifier® Cell Disruptor 185, 4.5 Output Control, 12 cycles, 10 seconds ON/30 seconds OFF) and centrifuged at 12,000rpm for 10 minutes at 4°C. ChIP assay (using 8 μg of chromatin and antibodies H3K4me3 (Active Motif, 39160); H3K27ac (Active Motif, 39135); and H3K27me3 (Active Motif, 39155)), library construction, sequencing, and data analysis have been described in previous study (22).
Regional Bisulfite sequencing and primers
Four loci from Supplementary Figure 3 that lay within gene promoters were randomly selected, one from each Group a, d, e, and f. Primers were designed for bisulfite-converted DNA, flanking each probe region, and did not overlap any CpG sites (RALYL, F: 5′-GTTGGATTAGTATTTTTGAGTTGTTTTTAT-3′, R: 5′-CAATCTCTACCTCAAACACTAACAC-3′; SLC16A3, F: 5′-TTTTTTGTTTGTATAATAGGGGTTG-3′, R: 5′-CCTTAAAAAACACTAAACACCCTAAC-3′; PRR15, F: 5′-GATGGGGTTAAGGGATAGTTGTTG-3′, R: 5′-CCAAAACCCTAAAACAACTAAAAAAAA-3′; LOX, F: 5′-ATGTTAAGGGTGGGATTTAGATTTT-3′, R: 5′-CCCCAAATTAAACCAATATATCTCA-3′). DNA was bisulfite-converted, and target regions then underwent PCR, TOPO cloning, and Sanger sequencing. Sequences were then aligned and CpG methylation status was plotted as shown in Supplementary Figure 5.
Gene expression analysis
Processed RNA-seqV2 Level 3 normalized read count data was obtained from The Cancer Genome Atlas (http://cancergenome.nih.gov/). Each patient’s Normal and Tumor sample data were aligned (for a total of 70 pairs) and ratios of tumor:normal gene normalized read counts were taken, with “0” normalized read count values set to “1”, and data was filtered to only include 5-fold changes or greater (in cases where the Tumor read count minus Normal read count was less than abs(5), values were excluded). Gene names were then aligned with probes changing in accessibility.
Pathway analyses
Pathway analyses were performed using QIAGEN’s Ingenuity® Pathway Analysis. Epigenetically-regulated genes from Figure 4 (reference dataset: genes covered by HM450 array) and TCGA’s full list of significantly mutated genes (6) was used for pathway analyses (reference dataset: Ingenuity Knowledge Base (Genes only)). Canonical pathway outputs (−log(p-value) > 1.3) were used for Figure 5C and D, and Upstream Regulator Analysis were used for Figure 6 and Supplementary Figure 7.
Figure 5. Comparison of genetic and epigenetic changes in ccRCC.

Epigenetically regulated genes in ccRCC (Figure 4) were compared to genes significantly mutated in ccRCC (TCGA). A) Overlap between epigenetically regulated genes and commonly mutated genes. B) Frequency of significant methylation, expression, and genetic changes in ccRCC. C & D) Pathway analysis of genes commonly mutated (C) and epigenetically regulated (D) in ccRCC.
Figure 6. Epigenetic changes affect genes regulated by HIF1A.

A) Pathway analyses reveal HIF1A as the top upstream regulator of epigenetically regulated genes (Figure 4) in ccRCC samples. B) Diagram of HIF1A-signaling pathway, in which 4 genes are epigenetically upregulated in our data.
Data access
Data generated in this study have been submitted to the NCBI Gene Expression Omnibus (GEO;http://www.ncbi.nlm.nih.gov/geo/) under accession numbers GSE70303 (HM450) and GSE75597 (ChIP-seq).
Results
Characterizing DNA methylation and chromatin changes in matched sets of primary ccRCC using AcceSssIble
Intact nuclei were isolated from six pairs of ccRCC and adjacent normal tissues and were subsequently treated with the CpG methyltransferase M.SssI, which catalyzes methylation at unmodified CpG sites and assesses the chromatin accessibility state (Figure 1)(19). Endogenous methylation and accessibility analysis was performed using the Infinium HM450 BeadArray platform. The accessibility levels (exogenous DNA methylation) at each CpG locus were measured by subtracting the endogenous pre-exsiting DNA methylation values (no-enzyme control) from those of the M.SssI-treated samples (Figure 1). Although chromatin accessibility cannot be deduced at extensively endogenously methylated loci by this method, we and others have shown that methylated DNA regions are largely situated in inaccessible chromatin, especially at gene promoter regions(22,23).
Changes in DNA methylation and accessibility levels ( Δ β-values) between 6 tumor and adjacent normal samples were then obtained to illustrate global DNA methylation and chromatin accessibility changes between tumors and matched normal tissues (Figure 2A). Among these changes, six potential models were generated, henceforth termed Groups a-f (Figures 2A and 2B). All six groups were observed in our dataset and organized as dependent (a, b, c, d) or independent of DNA methylation status (e, f) (Figures 2A and 2B). CpG sites in Groups a and b undergo tumor-specific de novo DNA methylation events. Specifically, Group a regions exhibit de novo DNA methylation with decreased accessibility in the tumor sample, indicating that these genomic regions were open and accessible in the normal-adjacent tissue and have become inaccessible in the tumor. Meanwhile, Group b loci only exhibit de novo DNA methylation in the tumors without accessibility changes. These loci are unmethylated and inaccessible in normal tissues and therefore are probably kept silent by alternate epigenetic mechanisms such as histone modifications. In contrast, Group c and d loci include those that are DNA hypomethylated in tumors compared to normal tissues; Group c loci do not exhibit a change in accessibility, while Group d sites display an increase in accessibility in tumors. Interestingly, most of the tumor-associated DNA methylation changes are not accompanied by accessibility changes (Groups b and c; Figure 2A and Supplementary Figure 1). In addition, we also observed regions displaying gains and losses of accessibility independent of DNA methylation changes (Groups e and f), which cannot be detected by other methylation-based assays. Thus, we anticipate that loci in Groups a, d-f, which display changes in accessibility, with or without DNA methylation changes, are enriched in potential functional regions such as promoters or enhancers, as it is known that nucleosome occupancy in functional regions such as gene promoters or enhancers inhibits expression of the relevant gene(22,24-26). Indeed, we found Groups a, e, and f to be enriched in promoter regions and CpG islands (Supplementary Figures 1 and 3), but not in Group d or Groups b and c. Therefore, it is likely that many of the regions such as enhancers and promoters within Groups b and c, comprising most of the epigenetic alterations (27-29), are not accompanied by gene expression changes(19,22,30), but rather result in an “epigenetic switch” between Polycomb and DNA methylation repression(27-29). We thus focused our analyses on DNA methylation-dependent and independent accessibility changes (Groups a, d-f).
All patient samples had distinct accessibility profiles (Supplementary Figure 2), thus we required a DNA methylation or accessibility change in at least two patients and in the same direction to be classified as a change at each locus. These changes are depicted in Supplementary Figure 3, which shows loss or gain of chromatin accessibility with or without DNA methylation involvement (Groups a, d-f). In general, changes were evenly distributed between accessibility losses (Groups a and e, n=4,887) and gains (Groups d and f, n=4,226), and between DNA methylation-dependent changes (Groups a and d, n=4,080) and independent changes (Groups e and f, n=5,033). This reflects one of the strengths of our method, namely the ability to identify regions with altered chromatin accessibility but without DNA methylation involvement. Taken together, these findings suggest that despite their heterogeneous nature, potential functional epigenetic alterations that are dependent on chromatin accessibility changes, with or without DNA methylation involvement, are quite common in ccRCC.
ChIP-seq data integration reveals distinct regulatory mechanisms in regions changing in accessibility
To further investigate the chromatin structure changes observed using AcceSssIble, we cross-referenced these regions (Supplementary Figure 3) with data from ChIP-seq experiments from two patient sample pairs 4 and 5, interrogating the levels of signature histone modifications H3K4me3 (active promoters), H3K27ac (active promoters and enhancers), and H3K27me3 (inactive promoters). Our results revealed that chromatin accessibility changes with or without DNA methylation correlate with distinct changes in various “hallmark” chromatin modifications, and may be used to predict varying mechanisms of gene regulation at these loci.
In promoter regions that lose accessibility in ccRCC (Figure 3A and Supplementary Figure 4A), H3K4me3 and H3K27ac marks were depleted, regardless of DNA methylation involvement. Meanwhile, although loss of chromatin accessibility broadly correlated with an increase in H3K27me3 in either methylation-dependent or -independent loci, the most dramatic correlation between a gain of H3K27me3 in tumor over normal tissue was observed at methylation-dependent promoters. This suggests a specific role for DNA methylation at promoters that may be linked to Polycomb/H3K27me3-dependent mechanisms for gene repression. This is further supported by the pronounced loss of H3K27ac enrichment in methylation-independent promoters, which show limited H3K27me3 involvement. Meanwhile, regions that gained accessibility in tumors (Figure 3B and Supplementary Figure 4B) correlated strongly with the presence of H3K4me3 and H3K27ac enrichment, yet H3K27me3 was not detected at these regions, suggesting that these genes are regulated by a different mechanism than Polycomb repression.
Figure 3. ChIP-seq data in regions changing in accessibility.

Average lineplots of ChIP-seq (active histone marks H3K4me3 and H3K27ac, and repressive mark H3K27me3) data Z-scores for regions with detected accessibility changes in Patient 4, separated by A & C) accessibility loss and B & D) accessibility gain. Gene promoter regions (A & B) and enhancers (C & D) were analyzed separately.
In enhancers, H3K27ac enrichment was also highly correlated with accessibility changes. In enhancers that lose accessibility (Figure 3C and Supplementary Figure 4C), strong H3K27ac depletion was observed, regardless of DNA methylation status in these regions. Interestingly, there were limited decreases in H3K4me3 and minimal enrichment of in H3K27me3 in these regions. Though unexpected since these marks have generally not been found to be involved in enhancer activation/repression, the potential involvement of H3K4me3 and H3K27me3 in a few subsets of enhancers has been suggested by several studies (31,32). Meanwhile, in enhancers that gain accessibility (Figure 3D and Supplementary Figure 4D), strong H3K27ac enrichment was observed. Like the regions that lost accessibility, there was a mild change in H3K4me3 enrichment, but there was no observed H3K27me3 signal in normal or tumor samples in these regions.
Overall, the ChIP-seq data suggest that the various classes of AcceSssIble groups can be used to predict discrete modes of gene regulatory mechanisms involving chromatin modification and remodeling.
Gene expression changes are highly correlated with promoter chromatin accessibility changes with or without DNA methylation involvement
While the link between gene expression and enhancer structure/function is complicated and not conclusive by current assays, the correlation between a gene’s promoter structure and expression potential is well established. We thus focused our analyses on promoter regions and sought to validate whether the epigenetic changes our data identified reflected actual regional changes. To accomplish this, we filtered loci that change in accessibility (Supplementary Figure 3) to select those that are located within 200 bp upstream of transcription start sites (TSSs), and then chose a random locus from each group (Groups a, d-f) to validate these changes via locus-specific bisulfite Sanger sequencing. In general, these data reflect that the probe changes detected by AcceSssIble represent the regional chromatin accessibility and DNA methylation changes (Supplementary Figure 5).
We further validated our findings with functional context by integrating observed DNA methylation and accessibility changes at TSSs with large cohorts of ccRCC HM450 and RNA-sequencing (RNA-seq) data from The Cancer Genome Atlas (TCGA)(6). This intersection revealed a strong correlation when Groups a, d-f were compared to TCGA DNA methylation and expression data (Figure 4 and Supplementary Figures 6A and 6B) that was not observed with Groups b and c (Supplementary Figure 6C). Group a, d-f loci were then filtered to remove 21% of probes for which accessibility changes were not correlated with gene expression, which could arise from the use of alternative transcripts or alternative promoters. Therefore, we only included loci whose accessibility changes were correlated with expression (78% of total loci for DNA methylation-dependent and 80% for DNA methylation-independent changes) in Figure 4, while Supplementary Figure 6 depicts the correlation strengths in unfiltered datasets. We stratified these changes based on accessibility loss (Groups a and e in Figure 4 and Supplementary Table 1, 183 gene promoters, 60% of which are DNA methylation-independent changes), and accessibility gain (Groups d and f in Figure 4 and Supplementary Table 2, 161 gene promoters, 80% of which are DNA methylation-independent changes). While we found chromatin accessibility changes and DNA methylation changes to be anti-correlated, promoter accessibility and gene expression changes were significantly positively correlated, regardless of DNA methylation status (Figure 4). The DNA methylation-independent correlation with gene expression is particularly interesting given the diverse accessibility profiles, which are overlooked by most current approaches, especially in primary tumors. Accessibility-independent DNA methylation changes, meanwhile, show a much weaker correlation with expression changes (Supplementary Figure 6C), and suggest that accessibility changes at promoter regions are a stronger predictor of functional changes than DNA methylation alone(22,30,33,34). Thus, the AcceSssIble assay provides an added layer of data integration to already ubiquitous HM450 DNA methylation assays, revealing novel sites of epigenetic regulation that are undetectable by DNA methylation changes alone. These sites are enriched in functional changes that are positively correlated with the direction of accessibility changes, with or without DNA methylation, and may be enriched with potential epigenetic driver genes.
Epigenetically-regulated genes show little overlap with common mutations and respective pathways in ccRCC
Previously, TCGA identified a set of 280 genes that are significantly mutated in ccRCC (35). We sought to determine how many of these genes are shared with the epigenetically-regulated genes from Figure 4. Surprisingly, there was very little overlap between these two groups (Figure 5A), as only seven genes were shared (Supplementary Table 3). In addition, these mutations occur at a much lower frequency than the accessibility-altered expression changes (Figure 5B). This finding suggests that there are more commonly accessibility-regulated genes than those regulated by genetic changes in ccRCC.
Pathway analyses reveal that among significantly affected pathways in ccRCC, none were shared between commonly mutated genes and epigenetically-regulated genes from our dataset (Figures 5C and D). Thus, these pathways are affected by distinct genetic and epigenetic mechanisms. Interestingly, Upstream Regulator Analysis of our dataset also revealed that Hypoxia Inducible Factor 1, Alpha Subunit (HIF1A) was the top upstream regulator among observed accessibility-regulated genes (Figure 6A). This is particularly significant since VHL (a HIF1A inhibitor) is the most commonly mutated gene in ccRCC (~70%), often serving as a means of ccRCC characterization (36). Furthermore, four genes in the HIF1A-signaling pathway, RAS, MAPK, VEGF, and LDH, were epigenetically-upregulated in our dataset (Figure 6B) independent of DNA methylation changes, which would be missed by DNA methylation assays alone. Also, these genes could up-regulate the HIF1A-signaling pathway without involvement of VHL. These data suggest the existence of potential epigenetic mechanisms that mimic the VHL-deficient phenotype in samples without the inactivating mutation, and therefore we sequenced the VHL coding region in our sample collection. Four of the six tumors displayed VHL mutations. However, no clear pattern emerged between accessibility regulation of genes in this pathway and VHL genotype, with varying numbers genes being affected independent of VHL status. Furthermore, one VHL-proficient tumor demonstrated two accessibility-regulated genes in the HIF pathway, and the other revealed none (Supplementary Figure 7). Thus, the HIF1A-signaling pathway could be upregulated by those genes and/or by VHL mutations. Our results suggest epigenetic mimicking of a VHL-deficient phenotype may occur independently of VHL mutations in ccRCC tumors.
Discussion
Both genetic and DNA methylation aberrations have been described in ccRCC tumors (35,37). However, most of the defined alterations appear to be passenger events that do not lead to functional changes(10,11). Mutated genes that drive cancer have been identified due to the improvement of analytical techniques, while epigenetic changes beyond DNA methylation that lead to the discovery of driver genes in patient samples are difficult to identify with current technologies (10,11). In this study, we used the AcceSssIble assay (19) developed in our laboratory to investigate tumor-associated changes in chromatin structure by measuring DNA methylation and chromatin accessibility changes between primary ccRCC tumors and normal tissues, and uncovered epigenetically regulated genes that may contribute to ccRCC tumorigenesis. AcceSssIble is rapid and cost-effective, only requiring 20 mg of tissue, the Infinium HumanMethylation450 BeadChip platform, and the CpG methyltransferase M.SssI. Furthermore, we have already established the robustness and reliability of this approach in a previous study(19), in which we demonstrated a strong overlap with DNase-seq and FAIRE-seq data, particularly in TSSs. In addition, HM450 DNA methylation arrays have already been used by TCGA in the comprehensive molecular characterization of over 10,000 primary tumors spanning 30 cancer types, linking molecular data to extensive clinical information(38). The ability to directly cross-correlate our data to this large, rich genome-wide database is another advantage of the AcceSssIble platform. Overall, our study revealed significant changes to the ccRCC epigenome, especially in identifying epigenetically up- (161) or down-regulated (183) genes, which are dependent on accessibility changes with (31%) or without (69%) DNA methylation involvement. The significance of these accessibility changes in promoter regions are further validated with RNA-seq and DNA methylation data from larger cohorts of TCGA ccRCC samples. These differences may also have a universal effect through targeting different genes in the same pathway, as seen in the case of the HIF1A-signaling pathway (Figure 6 and Supplemental Figure 7).
AcceSssIble provides a robust view of chromatin states relevant for accessibility and gene expression. Our data demonstrated that changes in accessibility were enriched in potential functional regions, regardless of their DNA methylation status. ChIP-seq data further revealed distinct mechanisms of chromatin remodeling between DNA methylation-dependent and independent accessibility changes; accessibility changes occurred along with positively correlated gain or loss of H3K4me3 and H3K27ac in promoter regions or H3K27ac only in enhancer regions, yet Polycomb repression was only involved in methylation-dependent chromatin condensation. Combining our AcceSssIble data in gene promoters with large expression datasets in ccRCC, the majority (79%) of DNA methylation alterations occurred without accompanying chromatin accessibility and gene expression changes (Supplementary Figure 1 and Supplementary Figure 6C). Hypermethylation can occur by de novo methylation of promoters with low levels of expression, documented as an “epigenetic switch” between Polycomb and DNA methylation repression during cancer development(27-29,39). In addition, hypomethylation does not necessarily lead to the opening of chromatin(19,22) in the absence of an appropriate transcription factor(40), and therefore the gene remains silenced(19,22). On the other hand, chromatin accessibility changes and gene expression levels were significantly correlated regardless of DNA methylation changes. Collectively, these results underline a central role for accessibility or nucleosome positioning in gene regulation. Therefore, the identification of functionally relevant, epigenetically regulated genes may depend predominantly on the chromatin accessibility status, which may or may not involve DNA methylation. This makes AcceSssIble a powerful method for identifying epigenetically regulated genes, either dependent or independent of DNA methylation status. This aspect of cancer epigenomics has been overlooked because of limited technological advancements.
TCGA has identified a set of 280 genes that are significantly mutated in ccRCC (35), however, there was very little overlap between these and the epigenetically regulated genes from our findings. Our findings also demonstrated that epigenetically regulated expression changes occur at a higher frequency than mutations in ccRCC. Subsequent pathway analyses revealed that the epigenetically regulated expression changes from this study are involved in pathways distinct from commonly mutated genes in ccRCC (Figure 5). Thus, by using AcceSssIble, we have identified novel epigenomic changes that are enriched in gene functional changes, and were unidentifiable by previous DNA methylation analyses.
Interestingly, pathway analyses on our dataset also revealed HIF1A as the top upstream regulator among the uncovered epigenetically regulated genes. This is particularly significant as the HIF1A inhibitor VHL is the most commonly mutated gene in ccRCC (~70%), often serving as the genetic characterization of the disease (35). Furthermore, four genes (RAS, MAPK, VEGF, and LDH) in the HIF1A-signaling pathway were found to be epigenetically-upregulated without DNA methylation involvement in our dataset, all of which mimic increased HIF1A activity and have been previously implicated in tumorigenesis (41,42). Notably, these expression changes could directly alter the HIF1A-signaling pathway independent of VHL mutation status.
Overall, we have expanded the repertoire of epigenetically regulated genes in ccRCC beyond DNA methylation at the same time as having defined the subset of DNA methylation changes that are likely to be functional. However, characterization of these potential epigenetic driver genes has to be confirmed by in vitro or in vivo assays to determine their potential roles in the development in ccRCC(10). We believe that this approach also could lead to more efficacious, personalized treatments to complement current personalized treatments that are mainly dependent on patient’s genetic alterations in cancer.
Supplementary Material
ACKNOWLEDEMENTS
We thank Dr. Fides Lay for critical reading of the manuscript. The results shown here are in part based upon data generated by the TCGA Research Network: http://cancergenome.nih.gov/.
Financial support
Funding for this work was provided by R01CA124518 (G.L.), R01CA083867 (P.A.J. and G.L), R21CA167367 (G.L.), the USC CTSI Pilot Funding Program (G.L.), Glen and Wendy Miller/ Inderbir Gill Kidney Cancer Research Program (G.L), the AP Giannini Postdoctoral Research Fellowship Foundation (E.B.), and the NIH Viral and Chemical Carcinogenesis Training Grant 5T32CA009320-28 (E.B.).
Footnotes
Disclosure of potential conflicts of interests
P.A.J. and D.J.W. are paid consultants of Zymo Research Corporation, but otherwise the authors declare that they have no competing interests.
References
- 1.Gupta KM, J. D, Li JZ, Russell MW, Charbonneau C. Epidemiologic and socioeconomic burden of metastatic renal cell carcinoma (mRCC): A literature review. Cancer Treatment Reviews. 2008;34(3):193–205. doi: 10.1016/j.ctrv.2007.12.001. [DOI] [PubMed] [Google Scholar]
- 2.Rini BI, Campbell SC, Escudier B. Renal cell carcinoma. Lancet. 2009;373(9669):1119–32. doi: 10.1016/S0140-6736(09)60229-4. [DOI] [PubMed] [Google Scholar]
- 3.Bhatt JR, Finelli A. Landmarks in the diagnosis and treatment of renal cell carcinoma. Nat Rev Urol. 2014;11(9):517–25. doi: 10.1038/nrurol.2014.194. [DOI] [PubMed] [Google Scholar]
- 4.Bignell GR, Greenman CD, Davies H, Butler AP, Edkins S, Andrews JM, et al. Signatures of mutation and selection in the cancer genome. Nature. 2010;463(7283):893–8. doi: 10.1038/nature08768. [DOI] [PMC free article] [PubMed] [Google Scholar]
- 5.Dancey JE, Bedard PL, Onetto N, Hudson TJ. The genetic basis for cancer treatment decisions. Cell. 2012;148(3):409–20. doi: 10.1016/j.cell.2012.01.014. [DOI] [PubMed] [Google Scholar]
- 6.Cancer Genome Atlas Research N Comprehensive molecular characterization of clear cell renal cell carcinoma. Nature. 2013;499(7456):43–9. doi: 10.1038/nature12222. [DOI] [PMC free article] [PubMed] [Google Scholar]
- 7.Morris MR, Maher ER. Epigenetics of renal cell carcinoma: the path towards new diagnostics and therapeutics. Genome Med. 2010;2(9):59. doi: 10.1186/gm180. [DOI] [PMC free article] [PubMed] [Google Scholar]
- 8.Jones PA. Functions of DNA Methylation: islands, start sites, gene bodies, and beyond. Carcinogenesis. 2012;31(1):27–36. doi: 10.1038/nrg3230. [DOI] [PubMed] [Google Scholar]
- 9.Morgan MA, Shilatifard A. Chromatin signatures of cancer. Genes Dev. 2015;29(3):238–49. doi: 10.1101/gad.255182.114. [DOI] [PMC free article] [PubMed] [Google Scholar]
- 10.Vogelstein B, Papadopoulos N, Velculescu VE, Zhou S, Diaz LA, Jr., Kinzler KW. Cancer genome landscapes. Science. 2013;339(6127):1546–58. doi: 10.1126/science.1235122. [DOI] [PMC free article] [PubMed] [Google Scholar]
- 11.De Carvalho DD, Sharma S, You JS, Su SF, Taberlay PC, Kelly TK, et al. DNA methylation screening identifies driver epigenetic events of cancer cell survival. Cancer Cell. 2012;21(5):655–67. doi: 10.1016/j.ccr.2012.03.045. [DOI] [PMC free article] [PubMed] [Google Scholar]
- 12.Kelly TK, De Carvalho DD, Jones PA. Epigenetic modifications as therapeutic targets. Nat Biotechnol. 2010;28(10):1069–78. doi: 10.1038/nbt.1678. [DOI] [PMC free article] [PubMed] [Google Scholar]
- 13.Heyn H, Esteller M. DNA methylation profiling in the clinic: applications and challenges. Nat Rev Genet. 2012;13(10):679–92. doi: 10.1038/nrg3270. [DOI] [PubMed] [Google Scholar]
- 14.Wee S, Dhanak D, Li H, Armstrong SA, Copeland RA, Sims R, et al. Targeting epigenetic regulators for cancer therapy. Ann N Y Acad Sci. 2014;1309:30–6. doi: 10.1111/nyas.12356. [DOI] [PubMed] [Google Scholar]
- 15.You JS, Jones PA. Cancer genetics and epigenetics: two sides of the same coin? Cancer Cell. 2012;22(1):9–20. doi: 10.1016/j.ccr.2012.06.008. [DOI] [PMC free article] [PubMed] [Google Scholar]
- 16.Shen H, Laird PW. Interplay between the cancer genome and epigenome. Cell. 2013;153(1):38–55. doi: 10.1016/j.cell.2013.03.008. [DOI] [PMC free article] [PubMed] [Google Scholar]
- 17.Baylin SB, Jones PA. A decade of exploring the cancer epigenome - biological and translational implications. Nat Rev Cancer. 2011;11(10):726–34. doi: 10.1038/nrc3130. [DOI] [PMC free article] [PubMed] [Google Scholar]
- 18.Bell O, Tiwari VK, Thoma NH, Schubeler D. Determinants and dynamics of genome accessibility. Nat Rev Genet. 2011;12(8):554–64. doi: 10.1038/nrg3017. [DOI] [PubMed] [Google Scholar]
- 19.Pandiyan K, You JS, Yang X, Dai C, Zhou XJ, Baylin SB, et al. Functional DNA demethylation is accompanied by chromatin accessibility. Nucleic Acids Res. 2013 doi: 10.1093/nar/gkt077. [DOI] [PMC free article] [PubMed] [Google Scholar]
- 20.Campan MW, D. J, Trinh B, Laird PW. MethyLight. Methods in Molecular Biology. 2009;507:325–37. doi: 10.1007/978-1-59745-522-0_23. [DOI] [PubMed] [Google Scholar]
- 21.Yang X, Han H, De Carvalho DD, Lay FD, Jones PA, Liang G. Gene body methylation can alter gene expression and is a therapeutic target in cancer. Cancer Cell. 2014;26(4):577–90. doi: 10.1016/j.ccr.2014.07.028. [DOI] [PMC free article] [PubMed] [Google Scholar]
- 22.Lay FDL Y, Kelly TK, Witt H, Farnham PJ, Jones PA, Berman BP. The role of DNA methylation in directing the functional organization of the cancer epigenome. Genome Research. 2015;25(4):467–77. doi: 10.1101/gr.183368.114. [DOI] [PMC free article] [PubMed] [Google Scholar]
- 23.Chodavarapu RK, Feng S, Bernatavichute YV, Chen PY, Stroud H, Yu Y, et al. Relationship between nucleosome positioning and DNA methylation. Nature. 2010;466(7304):388–92. doi: 10.1038/nature09147. [DOI] [PMC free article] [PubMed] [Google Scholar]
- 24.Lorch YL, J. W, Kornberg RD. Nucleosomes inhibit the initiation of transcription but allow chain elongation with the displacement of histones. Cell. 1987;49(2):203–10. doi: 10.1016/0092-8674(87)90561-7. [DOI] [PubMed] [Google Scholar]
- 25.Ay A, Arnosti DN. Nucleosome positioning: an essential component of the enhancer regulatory code? Curr Biol. 2010;20(9):R404–6. doi: 10.1016/j.cub.2010.03.051. [DOI] [PubMed] [Google Scholar]
- 26.Taberlay PC, Kelly TK, Liu CC, You JS, De Carvalho DD, Miranda TB, et al. Polycomb-repressed genes have permissive enhancers that initiate reprogramming. Cell. 2011;147(6):1283–94. doi: 10.1016/j.cell.2011.10.040. [DOI] [PMC free article] [PubMed] [Google Scholar]
- 27.Widschwendter M, Fiegl H, Egle D, Mueller-Holzner E, Spizzo G, Marth C, et al. Epigenetic stem cell signature in cancer. Nat Genet. 2007;39(2):157–8. doi: 10.1038/ng1941. [DOI] [PubMed] [Google Scholar]
- 28.Kondo Y, Shen L, Cheng AS, Ahmed S, Boumber Y, Charo C, et al. Gene silencing in cancer by histone H3 lysine 27 trimethylation independent of promoter DNA methylation. Nat Genet. 2008;40(6):741–50. doi: 10.1038/ng.159. [DOI] [PubMed] [Google Scholar]
- 29.Gal-Yam EN, Egger G, Iniguez L, Holster H, Einarsson S, Zhang X, et al. Frequent switching of Polycomb repressive marks and DNA hypermethylation in the PC3 prostate cancer cell line. Proc Natl Acad Sci U S A. 2008;105(35):12979–84. doi: 10.1073/pnas.0806437105. [DOI] [PMC free article] [PubMed] [Google Scholar]
- 30.Kelly TK, Liu Y, Lay FD, Liang G, Berman BP, Jones PA. Genome-wide mapping of nucleosome positioning and DNA methylation within individual DNA molecules. Genome Res. 2012;22(12):2497–506. doi: 10.1101/gr.143008.112. [DOI] [PMC free article] [PubMed] [Google Scholar]
- 31.Pekowska A, Benoukraf T, Zacarias-Cabeza J, Belhocine M, Koch F, Holota H, et al. H3K4 tri-methylation provides an epigenetic signature of active enhancers. EMBO J. 2011;30(20):4198–210. doi: 10.1038/emboj.2011.295. [DOI] [PMC free article] [PubMed] [Google Scholar]
- 32.Rada-Iglesias A, Bajpai R, Swigut T, Brugmann SA, Flynn RA, Wysocka J. A unique chromatin signature uncovers early developmental enhancers in humans. Nature. 2011;470(7333):279–83. doi: 10.1038/nature09692. [DOI] [PMC free article] [PubMed] [Google Scholar]
- 33.Komashko VM, Farnham PJ. 5-azacytidine treatment reorganizes genomic histone modification patterns. Epigenetics. 2010;5(3):229–40. doi: 10.4161/epi.5.3.11409. [DOI] [PubMed] [Google Scholar]
- 34.Wolff EM, Chihara Y, Pan F, Weisenberger DJ, Siegmund KD, Sugano K, et al. Unique DNA methylation patterns distinguish noninvasive and invasive urothelial cancers and establish an epigenetic field defect in premalignant tissue. Cancer Res. 2010;70(20):8169–78. doi: 10.1158/0008-5472.CAN-10-1335. [DOI] [PMC free article] [PubMed] [Google Scholar]
- 35.Network. CGAR Comprehensive molecular characterization of clear cell renal cell carcinoma. Nature. 2013;499(7456):43–9. doi: 10.1038/nature12222. [DOI] [PMC free article] [PubMed] [Google Scholar]
- 36.Duns GvdB E, van Duivenbode I, Osinga J, Hollema H, Hofstra RM, Kok K. Histone methyltransferase gene SETD2 is a novel tumor suppressor gene in clear cell renal cell carcinoma. Cancer Research. 2010;70(11):4287–91. doi: 10.1158/0008-5472.CAN-10-0120. [DOI] [PubMed] [Google Scholar]
- 37.Dalgliesh GL, Furge K, Greenman C, Chen L, Bignell G, Butler A, et al. Systematic sequencing of renal carcinoma reveals inactivation of histone modifying genes. Nature. 2010;463(7279):360–3. doi: 10.1038/nature08672. [DOI] [PMC free article] [PubMed] [Google Scholar]
- 38.Weisenberger DJ. Characterizing DNA methylation alterations from The Cancer Genome Atlas. J Clin Invest. 2014;124(1):17–23. doi: 10.1172/JCI69740. [DOI] [PMC free article] [PubMed] [Google Scholar]
- 39.Schlesinger Y, Straussman R, Keshet I, Farkash S, Hecht M, Zimmerman J, et al. Polycomb-mediated methylation on Lys27 of histone H3 pre-marks genes for de novo methylation in cancer. Nat Genet. 2007;39(2):232–6. doi: 10.1038/ng1950. [DOI] [PubMed] [Google Scholar]
- 40.Han H, Cortez CC, Yang X, Nichols PW, Jones PA, Liang G. DNA methylation directly silences genes with non-CpG island promoters and establishes a nucleosome occupied promoter. Hum Mol Genet. 2011;20(22):4299–310. doi: 10.1093/hmg/ddr356. [DOI] [PMC free article] [PubMed] [Google Scholar]
- 41.Cassano AB,C, Battelli C, Schinzari G, Quirino M, Ratto C, Landriscina M, Barone C. Expression of vascular endothelial growth factor, mitogen-activated protein kinase and p53 in human colorectal cancer. Anticancer Research. 2002;22(4):2179–84. [PubMed] [Google Scholar]
- 42.Allison SJK,JR, Granchi C, Rani R, Minutolo F, Milner J, Phillips RM. Identification of LDH-A as a therapeutic target for cancer cell killing via (i) p53/NAD(H)-dependent and (ii) p53-independent pathways. Oncogenesis. 2014;3:1–11. doi: 10.1038/oncsis.2014.16. [DOI] [PMC free article] [PubMed] [Google Scholar]
Associated Data
This section collects any data citations, data availability statements, or supplementary materials included in this article.