Abstract
For goal-directed behavior it is critical that we can both select the appropriate action and learn to modify the underlying movements (e.g. the pitch of a note or velocity of a reach) to improve outcomes. The basal ganglia are a critical nexus where circuits necessary for the production of behavior, such as neocortex and thalamus, are integrated with reward signaling 1 to reinforce successful, purposive actions 2. Dorsal striatum, a major input structure of basal ganglia is composed of two opponent pathways, direct and indirect, thought to select actions that elicit positive outcomes or suppress actions that do not, respectively 3,4. Activity-dependent plasticity modulated by reward is thought to be sufficient for selecting actions in striatum 5,6. Although perturbations of basal ganglia function produce profound changes in movement 7, it remains unknown whether activity-dependent plasticity is sufficient to produce learned changes in movement kinematics, such as velocity. Here we used cell-type specific stimulation delivered in closed-loop during movement to demonstrate that activity in either the direct or indirect pathway is sufficient to produce specific and sustained increases or decreases in velocity without affecting action selection or motivation. These behavioral changes were a form of learning that accumulated over trials, persisted after the cessation of stimulation, and were abolished in the presence of dopamine antagonists. Our results reveal that the direct and indirect pathways can each bidirectionally control movement velocity, demonstrating unprecedented specificity and flexibility in the control of volition by the basal ganglia.
Purposive action requires selection of a goal (e.g. go left or right) and execution parameters (e.g. how fast to go). For example, in bird song selection of both discrete, sequential actions (syllables) as well as the pitch can be controlled by reinforcement in cortico-basal ganglia pathways 8,9. In vertebrates, the striatum is a major input nucleus in basal ganglia1 and the direct and indirect pathway are primarily composed of two molecularly-distinct10 populations of projection neurons (MSNs): direct striatonigral (dMSN) and indirect striatopallidal (iMSN) neurons. Sustained activation of dMSNs increases movement whereas sustained activation of iMSNs reduces movement 11. As a result, the balance of activity-dependent plasticity at cortical synapses onto dMSNs and iMSNs is thought to underlie the selection of successful goal-directed actions 3,5,12. While it is known that stimulation of direct pathway neurons can support self-stimulation 13 and bias concomitant choice behavior 14, there is little direct evidence that MSN activity is sufficient to produce persistent, specific changes in subsequent actions.
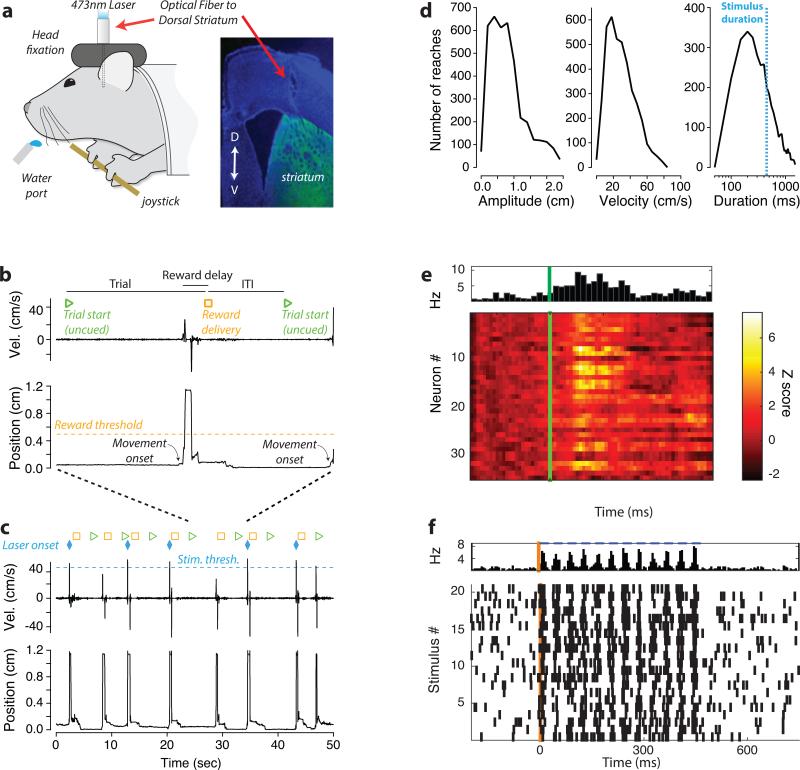
We trained mice expressing channelrhodopsin-2 (ChR2) in either dMSNs or iMSNs to perform self-paced, bimanual arm movements while head-fixed to obtain a water reward (Fig. 1a; Supplementary Videos). These single, discrete movements provided a reliable, repeatable behavior from which we could extract movement parameters (Fig. 1b-d). To determine whether activity in MSNs during a voluntary action is sufficient to control movement parameters, we administered closed-loop photostimulation to the dorsomedial striatum during the fastest third of movements. Stimulation intensity was adjusted to be subthreshold for direct effects on movement, but sufficient to modulate activity to a similar magnitude as endogenous modulation of striatal activity during arm movements (Fig. 1e-f; Extended Data Fig. 1). Stimulation onset occurred within 15 ms of the beginning of a movement and persisted for 450 ms (comparable to movement duration; 505 ms; Fig. 1c-d). To maintain motivation to perform the task independent of stimulation, all movements that crossed the criterion amplitude threshold elicited a delayed liquid reward.
Figure 1. Paradigm for closed-loop stimulation in dorsomedial striatum.
a) Mice were head-fixed in front of a side-mounted joystick and a water port. Optical fibers were chronically implanted. Tips were positioned in the dorsomedial striatum and coupled to a 473 nm laser. Insert shows fiber position. Fluorescenct image is from iMSN neurons expressing ChR2-YFP. b) To receive liquid reward, mice made forelimb movements with the joystick (either a pull or push) past the criterion distance. Reward delivered 1 second after threshold crossing. Inter-trial intervals were 3 seconds (uncued). c) Instantaneous velocity and position of joystick for 7 trials (green triangle indicates trial start). Velocity threshold for closed-loop optical stimulation and time of stimulation onset indicated by the blue dashed line and diamonds, respectively. Yellow squares indicate reward. d) Histograms of movement amplitude, peak velocity, and duration for all 8 mice (45 sham sessions). e) Average response (Z-scored change from baseline firing rate) of striatal units aligned to movement onset from a single session. Population average shown above. f) Raster plot of population activity during photostimulation from a single session.
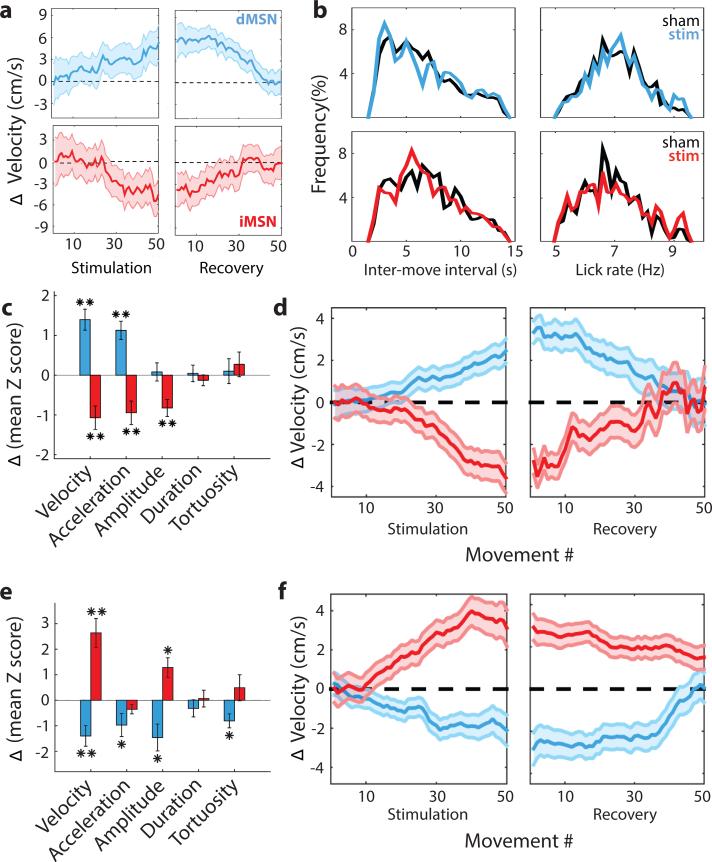
We first asked whether photostimulation of dMSNs during the fastest third of movements could alter the velocity of subsequent movements. Indeed, brief dMSN stimulation was sufficient to produce a significant increase in the peak velocity (1.4 cm/s increase from 29.7 cm/s; p < 7e-5; Fig. 2; Extended Data Fig. 2) of all arm movements. Other movement parameters that were not targeted for closed-loop stimulation such as the amplitude, duration, and tortuosity remained unaltered (p > 0.7). This is despite the fact that mice were capable of rapidly adjusting movement parameters to changing reward contingencies (Extended Data Fig. 3). By contrast, iMSNs stimulation during the fastest third of arm movements produced a significant reduction in peak velocity (−1.1cm/s; p < 7e-4). The effect of iMSN stimulation had its maximal effect on velocity; movement duration and tortuosity were not significantly altered (p>0.3). Prolonged tonic activation of dMSNs tends to be pro-kinetic in that it evokes generalized increases in voluntary movement (‘response vigor’ 15), whereas tonic activation of iMSNs tends to decrease voluntary movement 11. However, we found that neither brief dMSN nor iMSN stimulation during the fastest movements produced a change in the rate of trial initiation or the rate of licking during reward anticipation and consumption (Fig. 2b, Extended Data Table 1). These results thus demonstrate that closed-loop activation of MSNs is sufficient to produce sustained changes in movement parameters without generalized changes in movement or motivation.
Figure 2. Closed-loop stimulation produces opponent, bidirectional control of movement velocity.
a) Difference in peak velocity between stimulation and sham session (‘ΔVelocity’) for sessions in which dMSN (upper, blue throughout) or iMSN (lower, red throughout) were stimulated on the fastest third of 50 trials during stimulation and no stimulus was delivered during recovery. Example session shown. b) Histograms of inter-movement-interval (left) and lick rate during reward consumption (right) for sham (black; 25 sessions in 4 dMSN mice, 20 sessions in 4 iMSN mice) and stimulation (colored; 22 sessions in dMSN mice, 26 sessions in iMSN mice) sessions. c) Population average of change in movement parameters when fastest third of reaches were stimulated. d) Population average ΔVelocity as a function of movement (trial) number when fastest third of reaches were stimulated. e-f) Same as c-d but for sessions in which stimulation occurred on the slowest third of movements. *, p < 0.05; **, p < 0.005, two tailed t-test. Shaded area indicates standard error of the mean. Data come from 16 stimulation and 18 sham sessions in the same 4 dMSN mice, 20 stimulation, 16 sham sessions in the same 4 iMSN mice.
We next examined the effect of successive stimulation on arm movement velocity. If stimulation merely altered the velocity of the current movement, then repeated stimulation should produce an immediate, but constant offset. However, stimulation drove a steady change in velocity that accumulated over the course of several trials (Fig. 2d) apparent in individual sessions (Fig. 2a; Extended Data Fig. 2). We also found that unstimulated movements (trials with subthreshold velocity) were changed to a similar extent. dMSN stimulation produced a 0.9 cm/s increase (p = 0.014) in velocity on unstimulated movements whereas iMSN stimulation produced a −1.0 cm/s decrease (p = 0.001) in the velocity of unstimulated movements. Moreover, there was no change in variance of the distribution of velocities throughout the session (F test, p > 0.5 for both groups, Extended Data Fig. 4). Together these observations argue that selective stimulation produced a gradual, accumulating shift in the entire distribution of velocities, rather than a change restricted to the stimulated subset (e.g. making only fast, stimulated arm movements even faster). These cumulative changes in behavior may be contrasted with previous reports of optogenetic stimulation that have observed transient effects confined to the stimulated trial 13,14 or concomitant with stimulus delivery 11.
If stimulation of the fastest movements produces a persistent change in the selection of movement parameters the change should persist without stimulation. We plotted the velocity of movements made during the block of trials immediately following the stimulation block. In this recovery block, no stimulation was delivered. We found that stimulation-induced changes in the distribution of velocities persisted for tens of trials before gradually returning to the pre-stimulation baseline during the recovery block (Fig. 2a,d; paired t-test, p = 0.64, 0.90, dMSN and iMSN, respectively). Importantly, this return to the pre-stimulation distribution had a similar timecourse whether it required a decrease or increase in the mean velocity following dMSN or iMSN stimulation, respectively.
We have shown that dMSN and iMSN have opponent roles in the reinforcement of movement parameters with unprecedented specificity. The changes above are signed: dMSN stimulation increases a kinematic parameter of movement (velocity) whereas iMSN stimulation decreases the same property. However, there is a limitation to this simple opponency for learning: reinforcement should, in principle, alter behavior so as to increase a reinforcing outcome regardless of the sign of the behavioral change 16. It should be possible, for example, to learn to move more slowly to obtain more reward. Our data are also consistent with an alternative possibility: dMSN stimulation may be sufficient to drive changes towards movements that elicit stimulation independent of the sign of the change. To distinguish between these alternatives, we stimulated MSNs during the slowest, rather than the fastest, third of arm movements. This stimulation protocol produced the opposite effects for both dMSN and iMSN stimulation (Fig. 2e, f). Under these conditions, stimulation of dMSN was sufficient to produce a cumulative decrease in velocity (−1.1 cm/s, p = 0.008). Conversely, iMSN stimulation produced an accumulating increase in velocity (0.9, p = 0.012). Thus, the direct and indirect pathways of the basal ganglia are opponent pathways that are also sufficient for bidirectional changes in a continuous parameter that specifies purposive movement.
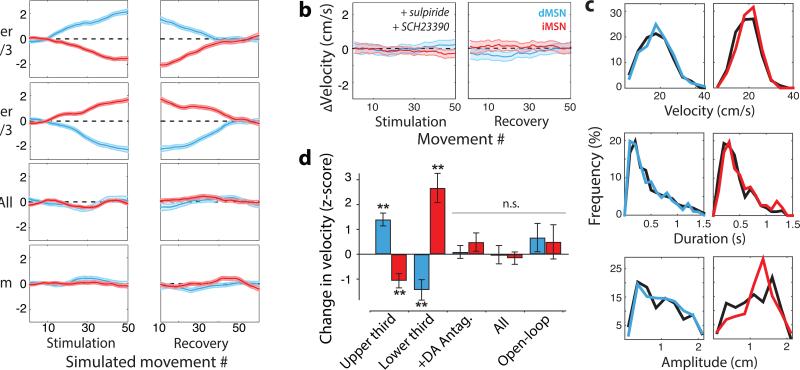
Models of the basal ganglia in which reinforcement learning acts to select amongst mutually exclusive actions can explain a broad array of empirical results in the learning literature12. However, such models cannot readily account for reinforcement acting on a continuous parameter of movement such as velocity12 (see Supplementary Discussion). By contrast, a learning rule in which closed-loop stimulation provides a pathway-specific, signed learning signal that determines the mean of the velocity distribution could reproduce our data (Fig. 3, Methods). Due to the bidirectional behavioral changes observed, this learning rule makes a specific prediction: stimulation on every trial or at random throughout a session should produce no net change in velocity. Consistent with this prediction, each stimulation protocol failed to produce a detectable change in movement velocity (p > 0.2 for all conditions, Fig. 3, Extended Data Fig. 5).
Figure 3. Changes in velocity are consistent with dopamine-dependent reinforcement learning.
a) Simulation of MeSH learning rule (see text for details). Change in average peak velocity (arbitrary units) as a function of trial number for dMSN-stimulation (blue) and iMSN-stimulation (red) simulations. b) ΔVelocity as a function of trial for stimulation of dMSN (blue) and iMSN (red) on the fastest third of 50 stimulation trials in the presence of dopamine receptor antagonists. Data from 14 stimulation and 11 sham dMSN sessions; 8 stimulation and 9 iMSN sham sessions. c) Movement parameter distributions for control sessions (black) and sessions following dopamine antagonist administration (colored). d) Summary of the changes in velocity for experiments as indicated for dMSN (blue) and iMSN (red) stimulation sessions as defined in text. Shaded area and error bars indicate standard error of the mean. **, p < 0.005, two tailed t-test.
As formulated, this learning rule would induce a persistent change in velocity following stimulation. Extinction formulated as a fixed decay in synaptic weight12 would not produce symmetric recovery as observed (Fig. 2; Supplementary Discussion). To account for this feature of the data, we assumed a homeostatic component and refer to the rule as ‘Mean Shift with Homeostasis’ or MeSH. Thus, the mean velocity of movement was a set point opposing learned changes and restoring velocity towards baseline during recovery. When incorporated into the learning rule, we found that simulations closely reproduced the data during stimulation and recovery epochs. Selective stimulation that biased the reward-based feedback steadily drove velocity towards (dMSN) or away (iMSN) from the threshold that elicited stimulation (Fig. 3a). Upon cessation of stimulation recovery to the pre-stimulation baseline within 50 trials occurred with a homeostatic rate 15% as large as the reward-based feedback (Fig. 3a).
MeSH assumes an explicit interaction between reward signaling, putatively carried by midbrain dopaminergic inputs to the dorsal striatum 6, and exogenous activation of MSNs. In contrast to this prediction, previous work has suggested that intracranial self-stimulation supported by striatal stimulation is independent of dopamine receptor activation 13. However, the movement-related activity of striatal populations and our use of brief 450ms stimulation both differ from the sustained, post-movement stimulation used previously. Thus, we next asked if dopamine was necessary for stimulation to elicit changes in movement velocity. We found that a low concentration of D1 and D2 receptor antagonists (SCH23390 0.02 mg/kg and sulpiride 25 mg/kg) injected prior to a behavioral session 13 eliminated persistent changes in velocity following closed-loop stimulation of either dMSN or iMSN (Fig. 3b, d) while largely sparing normal task performance (Fig. 3c, all dMSN parameters p>0.2; all iMSN parameters p>0.3). Dopamine antagonists significantly reduced the magnitude of the stimulation effect for both dMSN stimulation (92% decrease; 1.3 cm/s, p<1e-8) and iMSN stimulation (109% increase; 1.2 cm/s, p=1.5e-7).
Our results suggest that stimulation-dependent changes engage a dopamine-dependent, bidirectional plasticity. While a learning rule that acts directly on a parameter specifying the velocity distribution can account for our behavioral results, MeSH is abstract and it is unclear how it could be implemented in corticostriatal circuits critical for goal-directed, instrumental behavior 17. Thus, we implemented a simplified corticostriatal circuit model with the following key features (Extended Data Fig. 6).
While an action-value formulation implies that movements of different velocities are represented as a set of distinguishable neural states, MeSH implies a continuous representation of speed. There is little empirical evidence for representation of specific velocity ranges in cortical activity 18. By contrast, there is substantial evidence that cortical 19,20 and striatal 21 representations of forelimb movements are monotonically tuned to speed. Consistent with the anatomy of corticostriatal pathway1, we assume that the speed of a movement is determined by both cortical and basal ganglia output (Extended Data Fig. 6). In combination with monotonic tuning this implies that the mean movement velocity is proportional to the average weight of corticostriatal synapses (Methods).
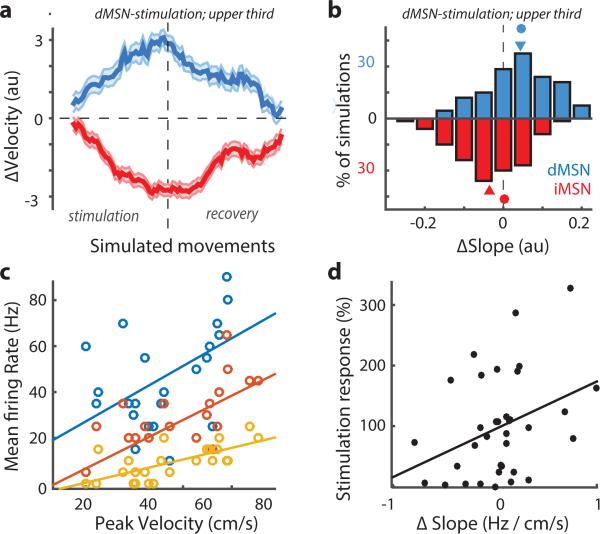
Dopamine and spike-timing dependent plasticity (STDP) has been described in the striatum22,23. STDP can result in bidirectional plasticity with the balance of potentiation and depression adapted to the range of population activity (i.e. BCM-type plasticity 24) in the presence of variable spike trains 25. We assume a balance of potentiation and depression such that movements made at the average speed produce no net change. We posit that photostimulation enhances both potentiation and depression consistent with our observation that selective stimulation produces biased changes whereas non-selective stimulation produces not net change (Fig. 2-3; Supplementary Discussion). Balanced synaptic plasticity that is enhanced by stimulation is sufficient to produce bidirectional changes in the average corticostriatal synapse weight during selective photostimulation. When incorporated into a corticostriatal circuit model, this plasticity rule produces opponent, bidirectional, and symmetric changes in movement speed (Fig. 4a-b; Extended Data Fig. 6).
Figure 4. Corticostriatal circuit model implements MeSH rule and experimental validation.
a) Change in movement velocity (au) as a function of number of simulated trials (shaded area indicates standard deviation; N=100) for simulations in which dMSN (blue) or iMSN (red) were stimulated during fastest ~30% of reaches. b) Histogram of the change in the average slope between dMSN (blue) or iMSN (red) activity and movement velocity for simulations with dMSN stimulation. Triangles indicate mean. Circles indicate mean change in weight of corticostriatal synapse (see text for details). c) Mean firing rate during movement (0-505ms after onset) is plotted as a function of peak movement velocity with overlaid linear fit (‘tuning slope’) for 3 of 35 example striatal units. d) Stimulation Response (percent change in baseline firing rate during photostimulation) as a function of the change in the tuning slope (‘ΔSlope’) for unstimulated trials (subthreshold velocity) of sessions in which dMSN were stimulated on the fastest third of movements. Linear fit overlaid (r = 0.47).
Finally, we sought to validate our circuit model with electrophysiological recordings from dorsomedial striatum. Individual units (putative MSNs) recorded from mice performing the task were monotonically tuned to movement velocity (Fig. 4c), confirming previous observations21,26. An important feature of our behavioral results was that closed-loop stimulation does not simply reinforce stimulated movements, but rather produces a change in the mean velocity. Thus, changes in striatal activity should be apparent even for unstimulated movements. Specifically, the slope relating firing rate to velocity should be changed (Fig. 4b). Moreover, if photostimulation is necessary to alter plasticity in the recorded neuron then slope changes should correlate with photostimulation (Fig. 4b). To test this prediction we analyzed a population of striatal units (N=35) during closed-loop stimulation of dMSNs on the fastest third of movements. Consistent with the model predictions, we observed an increase in the slope of the velocity tuning associated with an increase in the average velocity (Fig. 4d). Changes in tuning tended to be most prominent on units responsive to photostimulation (putative dMSNs; Fig. 4d) whereas neurons with weak stimulation responses (putative iMSNs or distant dMSNs) tended to show decreases in apparent tuning slope (Fig. 4d).
Here we provide the first demonstration that the innate biases in the direct and indirect pathway to increase or decrease the frequency of movement, respectively, do not extend to fixed biases in the control of movement parameters. The direct and indirect pathways engage opponent, activity-dependent plasticity mechanisms that can produce sustained biases in future behavior. Each pathway is sufficient to produce bidirectional changes and, to some extent, is innervated by distinct cortical populations 27, suggesting that bidirectional control by each pathway could allow for adaptive control of goal-directed actions in different contexts or under different demands. These data argue that phasic activity in the striatum during specific movements is sufficient to selectively reinforce changes in a movement parameter independent of a generalized change in motivation consistent with a role for dopamine-dependent signaling in dorsal striatum in the control of movement vigor 21,26,28.
Our results reveal a bidirectional control of behavior by MSNs that may be contrasted with the observation that self-stimulation supported by MSNs is opponent and dopamine-independent13. The differences between the findings may reflect the different experimental paradigms. Selectively biasing striatal activity in the context of a reward-based operant task could engage mechanisms distinct from the reinforcing properties of photostimulation itself. In the latter case strong stimulation may be sufficient to replace dopaminergic inputs or support self-stimulation in a dopamine-independent manner29. In addition, we observed a symmetric recovery to baseline following cessation of stimulation that is also distinct from the differential extinction of self-stimulation 13. However, a recent modeling study argued that apparent differences in extinction are consistent with equivalent learning rates following dMSN and iMSN stimulation12 consistent with our observation of opponent, but symmetric effects.
Here we proposed a circuit implementation by which a continuous parameter defining a purposive movement can be selectively reinforced by a stimulation-dependent enhancement of bidirectional synaptic plasticity. Importantly, it has been shown that striatal neurons are capable of bidirectional synaptic plasticity22,23; however, plasticity is mediated by distinct signaling events in the two populations23. Resolving the roles played by the intersection of these different cellular and circuit factors that govern bidirectional plasticity will be critical to understand the role of dopamine in instrumental learning. In addition to kinematic parameters of movement, other aspects of reinforcement learning are governed by continuous parameters such as rates30 or value6. The circuit implementation we propose, albeit simplified, could provide a general mechanism by which activity-dependent plasticity in striatum produces learned changes in continuous parameters with monotonic representations in neural activity.
Online-only Methods
Subjects
Experimental subjects were 8 adult (over 2 months old) male mice, 4 each of Drd1a-cre (http://www.informatics.jax.org/allele/MGI:3836631) or Drd2-cre (http://www.informatics.jax.org/allele/MGI:3836635) crossed with a mouse with an allele for cre-dependent expression of channelrhodopsin-2 fused to enhanced yellow fluorescent protein (Ai32; https://www.jax.org/strain/012569). Mouse lines expressing cre-recombinase were produced by the GENSAT project (GENSAT project, Rockefeller University, NY, USA) 31,32 and obtained from the MMRC (https://www.mmrrc.org). Ai32 mice were obtained from Jackson Laboratory and produced by the Allen Institute for Brain Science (https://www.alleninstitute.org) 33. Number animals and sessions based upon previous studies using an intersession control model. Experimenters were not blinded to the condition or animal strain. All animals were handled in accordance with guidelines approved by the Institutional Animal Care and Use Committee (IACUC) of Janelia Research Campus which is IAAALAC accredited.
Animal care
Mice were individually housed in a temperature- and humidity-controlled room maintained on a reversed 12-h light/dark cycle. Following 1 week of recovery from surgery, the water consumption of the mice was limited to at least 1 ml qd. Mice underwent daily health checks, and water restriction was eased if mice fell below 70% of their body weight at the beginning of deprivation. Mice were acclimated to head fixation and trained to lick drops of water sweetened with saccharin.
Behavioral training
Mice spent 4-8 weeks adjusting to being head-fixed and learning to displace a side-mounted joystick, placed 2.7cm away from their platform, to a threshold of roughly 0.5 cm. After this initial training, the threshold for a successful trial (‘criterion threshold’) was reduced 0.1 cm so that every joystick movement would be rewarded. Reaching movements were self-paced. Most movement amplitudes easily exceeded this amplitude threshold (Fig 1c).
Mice were restricted to consume 1.5mL of water per day to maintain motivation for task completion. Movement was measured by recording voltage changes applied across the variable potentiometer connected to the joystick and were found to be linearly proportional to displacement over the range of movement amplitudes used by mice. At the start of each trial, joystick position was centered to coordinates (0,0), and animals were trained to maneuver the joystick to certain displacement thresholds equal to a set resistance change of a potentiometer. Both movements away from and towards the body were allowed. Delivery of a sweetened water reward (~0.05-0.1 mL per trial; controlled by an audible solenoid valve) signaled a successful movement and advancement to the next trial. Water delivery was delayed by 1000 ms after the joystick position crossed a specific distance threshold. The threshold was set at an arbitrary, low value such that false positives were not detected, but all trial-initiating movements in well trained mice were rewarded. A force of ~0.1 N was required to displace and hold the joystick at an eccentric position. For reference, this is at least 5× less than a mouse can pull towards itself using its forelimbs for several seconds34.
No other task-related stimulus was present and the behavior was performed in a darkened behavior box. Rewards were followed by a 4000 ms intertrial interval (ITI) in which no movements would be rewarded. The joystick position at the end of the ITI (almost always near the central default position) was used as the initial position for the subsequent trial. Mice performed at least 125 trials per session. The initial 25 trials were only used for daily acclimation of the animal to the behavioral setup. Blocks of 50 trials were performed with the stimulation block followed by the no stimulation block. Many blocks could be completed, but only the first block from each condition were used in these analyses. Sham stimulation sessions were identical to stimulation sessions, including the attachment of the optic fiber to the mouse's head, with the exception that the laser was not turned on.
Fiber implantation and optical stimulation
Implantation surgery was performed under full anesthesia (1.5% isoflurane). The skull was exposed and fiber optic probes were unilaterally inserted 2.2 mm into the brain at 0.5mm anterior and 1.8mm lateral to bregma. Fiber optic probes were made of glass fibers (100 μm core) fitted with zirconia LC connectors. Head fixation caps were implanted at the end of the procedure and all elements and remaining skull were covered with dental acrylic as described previously 35. All surgical procedures were performed under aseptic conditions.
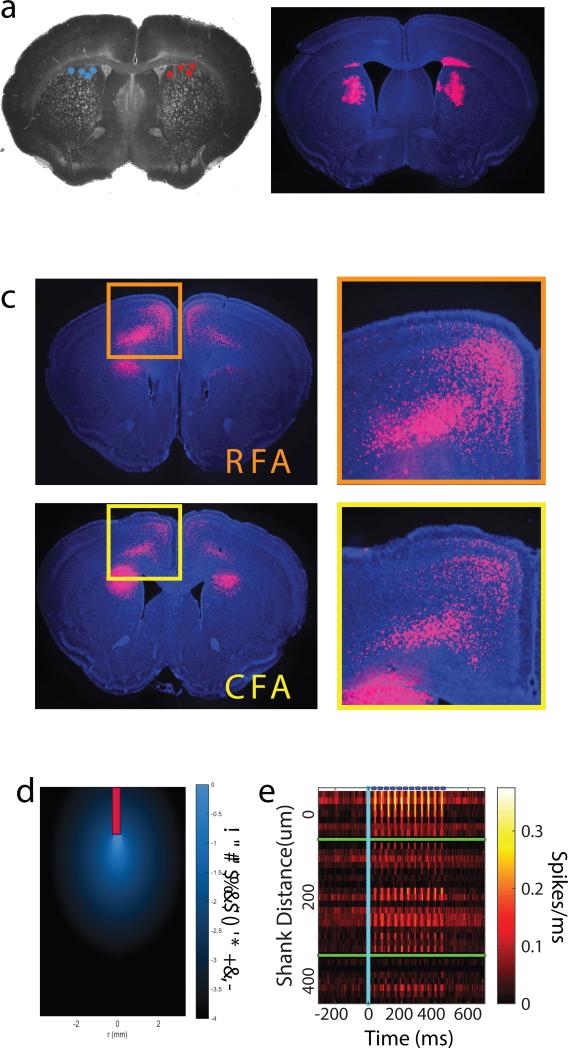
Fiber implants, as described in the Methods, were targeted to the dorsomedial aspect of the striatum (DMS) 1. Extended Data Figure 1a shows the localization of the tips of optical fibers implanted for dMSN and iMSN stimulation. To characterize this specific location in more detail we performed bilateral injections of a retrograde tracer (Lumiflor beads) into the approximate DMS location of fiber implants. We found extensive retrograde labeling of neocortical neurons over a relatively extended rostro-caudal axis that was biased towards the medial aspect of neocortex (Extended Data Figure 1b,c), consistent with previous results from our lab 36. Based upon the anatomical atlas of the mouse brain 37 these cortical structures are annotated as M2 (secondary motor cortex) and Cg (cingulate cortex). However, we note that recent functional mapping of neocortex indicates that these sites are also within the boundaries of the rostral and caudal forelimb regions (Extended Data Figure 1c) – areas that are sufficient to produce forelimb movements in response to microstimulation 38.
Closed-loop photostimulation on high and low velocity blocks was accomplished through online monitoring of instantaneous joystick velocity. Thresholds for triggering the laser were set for each animal such that approximately one-third of baseline movements would be suprathreshold. The velocity threshold within a session was fixed, but on occasion it was changed from one session to the next. Thresholds for all mice and all sessions were within 6% of each other. For stimulation of all movements, we set the velocity threshold low enough that all movements were suprathreshold. For low-velocity triggering (Fig 3), we took advantage of the reliable, stereotyped nature of the reaches to predict peak velocity from early velocity. To trigger photostimulation, velocity needed to initially pass a low, “onset” threshold while not exceeding a higher “too fast” threshold for the next 20 ms. Using our real-time velocity triggering, we correctly stimulated 96% of upper-third (fast) reaches protocol and 84% of lower-third (slow) reaches protocol. Our false positive stimulation rate was 9% for both protocols. Photostimulation consisted 10ms pulses at 16.7 Hz for 450ms from a 473nm blue laser set so that the power at the tip of the implanted optic probe was 3-6 mW. This was at a frequency below that which individual neurons could reliably follow (Extended Data Fig. 7). Upper third stimulation data consist of 22 stimulation and 25 sham sessions in dMSN mice, 26 stimulation and 20 sham sessions in iMSN mice. Loweer third stimulation data consist of 16 stimulation and 18 sham sessions in dMSN mice, 20 stimulation, 16 sham sessions in iMSN mice.
We next sought to estimate the extent of light spread based upon the laser power, fiber diameter and duty cycle of our pulse train using a combination of simulation 39 and electrophysiology. The simulation result is shown in Extended Data Figure 1d. Briefly, the peak intensity of light stimulation was reduced to 1% maximum by ~1mm below and 0.5mm lateral to the optical fiber. To directly estimate the change in stimulation efficacy as a function of distance we performed recordings with a 4-shank silicon probe (NeuroNexusTech; Buzsaki32 site layout) on which 1 shank was affixed with an optical fiber. Consistent with the estimate of light scattering from the simulation we found that direct light activation was substantially weaker on the neighboring shanks (Extended Data Figure 1e). At the location of our fibers (Extended Data Figure 1) the dorsal striatum extends for ~2mm is all dimensions and the DMS roughly extends for 1mm. Thus, these data indicate that direct photostimulation was restricted to the dorsal striatum.
Behavioral analysis
All behavioral events were recorded on separate channels at 1kHz (BlackRock Microsystems; Salt Lake City, UT). Data analysis was performed using written routines in Matlab 2014a,b (MathWorks; Natick, MA) to extract individual forelimb movement trajectories (‘reaches’; Extended Data Figure 8). Quantification of individual movements considered only the outward component of the reach and quantified the peak amplitude and velocity. The beginning of the reach was assessed offline for each reach and was determined to be the first timepoint constituting the increasing velocity associated with that reach. The duration was computed as the full duration of the movement and tortuosity is a measure of the directness of the reach path, defined as the path length divided by the end point distance. Z scores were computed for each stimulation session, using the average sham session mean and standard deviation, within each animal, then combined across animals. Non-selective stimulation “all” was composed of Simulations of behavioral learning were implemented in Matlab and are described in detail in the Extended Results. Unless otherwise noted, statistical significance refers to p<0.05, two-tailed Student's t-test.
Electrophysiology
Extracellular electrophysiology was performed in the dorsal striatum of awake, behaving mice. 32 channel silicon probe arrays with attached integrated optical fibers (NeuroNexus; Ann Arbor, MI; ‘Buzsaki32’ site arrangement) were acutely implanted in the dorsal striatum (center of array was positioned 0.5 anterior and 1.8 mm lateral to bregma and −2.0 mm to −3.0 mm depth from surface). Electrodes were prepared for recording by reducing the site impedance below 750 kOhm. Broadband continuous data (0.1Hz-7.5kHz) were recorded with simultaneous sampling of voltage from the joystick, the lick port, and digital signals from the behavior control system (30kHz sample rate on all channels, Blackrock Microsystems, Salt Lake City, UT). Continuous voltage signals were highpass filtered (0.5-7kHz) offline and events that exceeded 4 times the standard deviation of the continuous voltage signal were extracted (spikes). Spike sorting into individual units was performed in Matlab using custom-written software. Spikes were isolated according to waveform amplitude distribution and principal components of the amplitude array across the 8 electrodes (~25um spacing) of each shank (N=8) of the silicon probe array. The event times for each individual single unit were then aligned to movement start as extracted from the continuous voltage signal from the joystick. Velocity-firing rate slopes were computed using the mean activity of each unit over the epoch spanning 0 to 400 ms after reach initiation. The evoked response for each stimulus (Figure 1f) was averaged across all isolated neurons, with spikes placed into 2ms-wide bins.
Pharmacology
We injected D1 and D2 receptor antagonists (SCH23390 0.02 mg/kg and sulpiride 25 mg/kg, co-injected intraperitoneally) prior to stimulation sessions. Sham sessions were ones in which the same animals received 0.9% saline injection instead of drug.
The MeSH learning rule
To determine whether the changes in reach velocity due to stimulation were consistent with a reinforcement learning rule, we developed a simple computational model:
| (1) |
where, M is the Gaussian distribution of values m for a given movement parameter, from which mi is chosen at random on trial i. Performance reinforcement in the form of reward, r, shifts the mean of M relative the reward r, to which is always given and therefore will be present in every trial. Additional stimulation-induced reinforcement also occurs, shifting the mean according to the type of stimulation, S (+1 or −1 for dMSN or iMSN, respectively; 0 for no stimulation) at a fixed proportion of the reward rate, i.e. ωS=Csωr. Finally, we have added a restorative set point, P, which is based upon the original mean of the distribution.
Corticostriatal circuit model
We implemented a simple simulation of 500 D1 and 500 D2 striatal units. Activity was continuously varied between 0 and 1. The activity of a given unit was defined as
Movement velocity was a product of the total cortical output summed with the net contribution of striatal activity (see schematic in Extended Data Figure 6). This is an explicit model of the structure of the corticostriatal projection where striatal neurons receive collateral input from corticocortical and coorticofugal outputs from neocortex 1. Thus, movement velocity was:
Simulations were conducted with a variety of weightings, but for examples in the manuscript we used α=0.5, β=1, γ=1. Synapse weights were updated incrementally according to a simple update equation
Thus, if the unit was active its weight was increased by αlearn or otherwise decreased by βlearn if inactive. Various parameterizations of learning rates could be used, but we typically used αlearn=− βlearn =0.05 in the absence of photostimulation and αlearn=− βlearn =0.09 during photostimulation. Altered learning rates were only applied to the stimulated population.
In vitro intracellular recordings
Methods for Extended Data Figure 7 were as described previously 40. Briefly, for the preparation of in vitro brain slices, mice were deeply anesthetized with isoflurane, decapitated, and the brain placed into ice-cold modified artificial cerebral spinal fluid (aCSF) (in mM: 52.5 NaCl, 100 Sucrose, 26 NaHCO3, 25 Glucose, 2.5 KCl, 1.25 NaH2PO4, 1 CaCl2, 5 MgCl2 and in uM: 100 Kynurenic Acid) that had been saturated with 95%O2/5%CO2. 300 μM thick coronal slices were cut (Leica VT1200S; Leica Microsystems, Germany), transferred to a holding chamber and incubated at 35°C for 30 minutes in modified aCSF (in mM: 119 NaCl, 25 NaHCO3, 28 Glucose, 2.5 KCl, 1.25 NaH2PO4, 1.4 CaCl2, 1 MgCl2, 3 Na Pyruvate and in uM: 400 Ascorbate and 100 Kynurenic Acid, saturated with 95%O2/5%CO2) and then stored at room temperature.
For recordings, slices were transferred to a recordings chamber and superfused with modified aCSF (in mM: 119 NaCl, 25 NaHCO3, 18 Glucose, 2.5 KCl, 1.25 NaH2PO4, 1.4 CaCl2, 1 MgCl2, 3 Na Pyruvate and in μM: 400 Ascorbate and saturated with 95%O2/5%CO2) maintained at 32-34°C, at a flow rate of 2-3mL per minute. Patch pipettes (resistance 5-8 MΩ) were pulled on a laser micropipette puller (Model P-2000, Sutter Instrument Co., Sunnyvale,CA) and filled with a KGluconate based intracellular solution (in mM: 137.5 KGluconate, 2.5 KCl, 10 HEPES, 4 NaCl, 3 GTP, 40 ATP, 10 phosphocreatine, pH 7.5). Intracellular recordings were made using a MultiClamp700B amplifier (Molecular Devices, Sunnyvale, CA) interfaced to a computer using an analog to digital converter (PCI-6259; National Instruments, Austin, TX) controlled by custom written scripts in Igor Pro (Wavemetrics, Eugene, OR). Software is available at http://www.dudmanlab.org
Extended Data
Extended Data Figure 1. Anatomical localization of stimulated neurons and their corticostriatal inputs.
a) Schematic showing the histological reconstruction of optic fiber endpoints in dMSN (cyan) and iMSN (red) mice. Hemispheric segregation for display purposes only; actual implants were randomized left and right. b) Location of retrobead tracer injection just below the coordinates of fiber implant terminus. c) Location of the labeled projection neurons innervating the retrobead injection site corresponding to the rostral forelimb area (RFA, orange) and caudal forelimb area (CFA, yellow). d) Results of simulation of light intensity and spread through the brain based upon the model of Stujenske et al 39. Light intensity drops below 10% peak intensity 285 μm below the fiber. At this depth the lateral fall-off is a drop to 1% peak intensity 250 μm. Contour lines for 10% intensity and 1% intensity are overlaid in white and gray, respectively. e) Average photostimulation-evoked activity of individual neurons (each row = 1 neuron) sorted by electrode shank. We observed minimal fidelity in the light-evoked responses of neurons on the farthest shank consistent with the predicted fall off in light intensity from simulations. Blue dashes at top identify timing of laser pulses. Robust entrainment of spiking to photostimulation was also observed in vitro (Extended Data Fig. 7)
Extended Data Figure 2. Selective stimulation of MSNs produces changes in peak velocity.
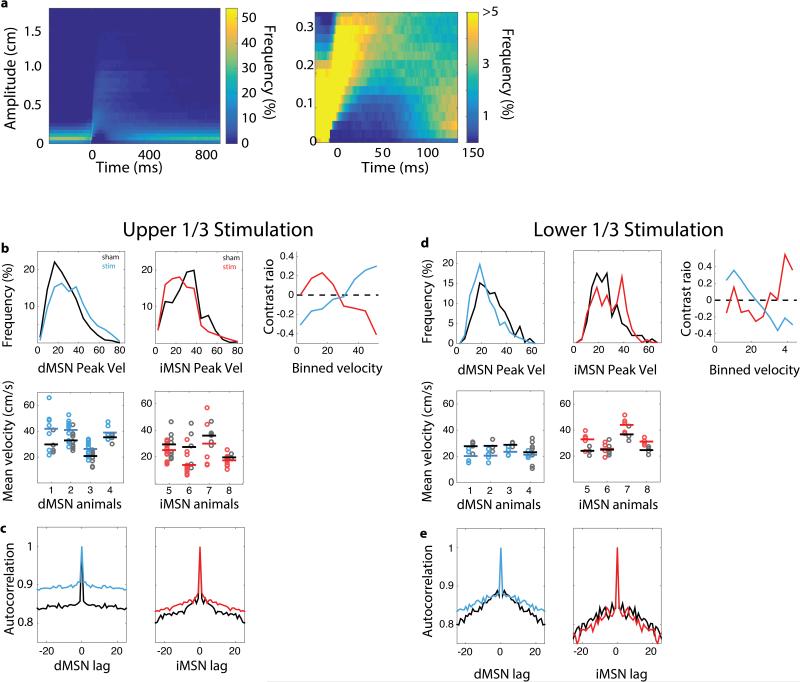
A) Density plot of movement trajectories showing the percentage of movements that passed through a given amplitude throughout time, aligned to movement onset. Particularly in the zoomed-in plot on the right, we can see that very few movement trajectories passed near the central 0.2 cm within the first 100ms. B) Peak velocity distributions for sham and stimulation datasets for dMSN stimulation (blue, left column), and iMSN stimulation (red, middle column). Top row shows complete distributions across animals - note that no particular part of the distribution is pronounced following stimulation. Bottom row shows means for all experimental sessions by animal. Animal number is for indexing purposes only. Most experiments were carried out concurrently across animals. The right column shows the contrast ratio (difference divided by sum) for dMSN and iMSN stimulation effects (blue and red respectively). These data show a steady mean shift in the data; for instance, iMSN stimulation (red) is positive for velocities slower than the sham (control) mean (an increase in frequency), and is negative for velocity values greater than the sham mean (a decrease in frequency). We have curtailed the contrast ratio plot where too few values existed to achieve reliable estimates (55cm/s). C) Autocorrelation of movement velocities for dMSN stim (blue), iMSN (red), and sham (black) data. D-E exhibit the same analyses as B-C, but for those sessions in which stimulation occurred on the slower, lower 1/3 of movement velocities.
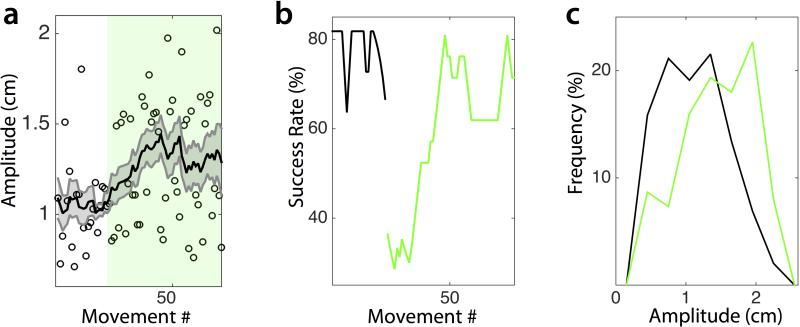
Extended Data Figure 3. Trained animals can adjust amplitude to changing task requirements.
A) Reach amplitudes from a sample of 7 sessions in 2 mice in which the eccentricity of the threshold to receive reward was suddenly increased at random. Green field identifies reaches performed with the increased amplitude threshold. Shaded area represents standard error of the mean. B) Success rate before (black) and after (green) the jump in amplitude threshold. C) Distribution of reach amplitudes across sessions for pre- (green) and post- (black) amplitude threshold jump. These data indicate that the mean amplitude was not saturated and suggest that behavior remains outcome dependent (i.e. goal-directed).
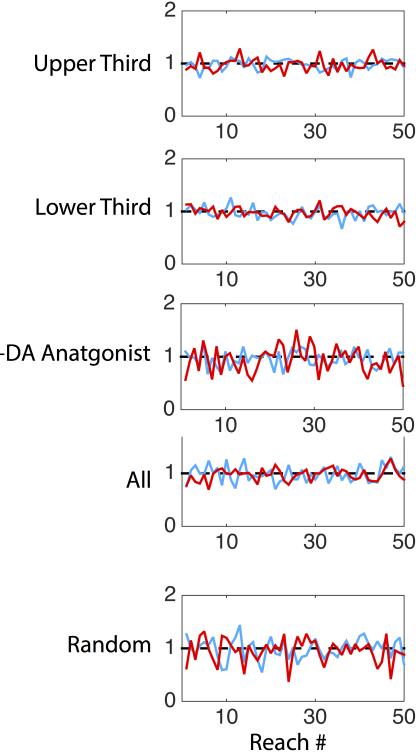
Extended Data Figure 4. Variance of movement velocity does not change throughout a session.
Each session was z-scored and the standard deviation for each movement number is plotted for dMSN (cyan) and iMSN (red) stimulation
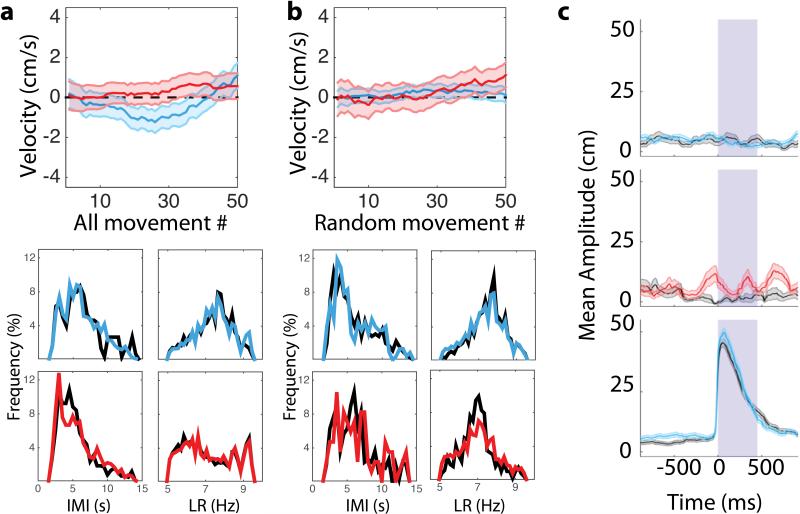
Extended Data Figure 5. Non-selective stimulation does not affect motor control or initiation.
A) “All-stim” (15 stimulation and 17 sham sessions from 4 dMSN mice; 17 stimulation and 20 sham sessions from 4 iMSN mice) and B) “random stim” (11 stimulation and 15 sham dMSN sessions from 3 dMSN mice, 8 stimulation and 12 sham sessions from 3 iMSN mice) summary data showing (top) the mean velocity as a function of movement number for dMSN (cyan) and iMSN (red) stimulation sessions and (bottom) histograms of the inter-move interval (IMI; left) and lick rate (LR; right). Shaded area indicates standard error of the mean. We found no differences between sham (black lines) and stimulation (colored lines) sessions for either dMSN stimulation (cyan) or iMSN stimulation (red). C) Plot of average trajectory position aligned to stimulation onset for random dMSN (top) and iMSN stimulation (middle) for stimulation (colored) and sham (black) sessions (In sham sessions, timing was randomly chosen, but no stimulation was given). Stimulation did not systematically induce forelimb movement. For reference, the bottom trace displays closed-loop dMSN aligned to stimulation onset. Gray field represents the 450 ms stimulation period.
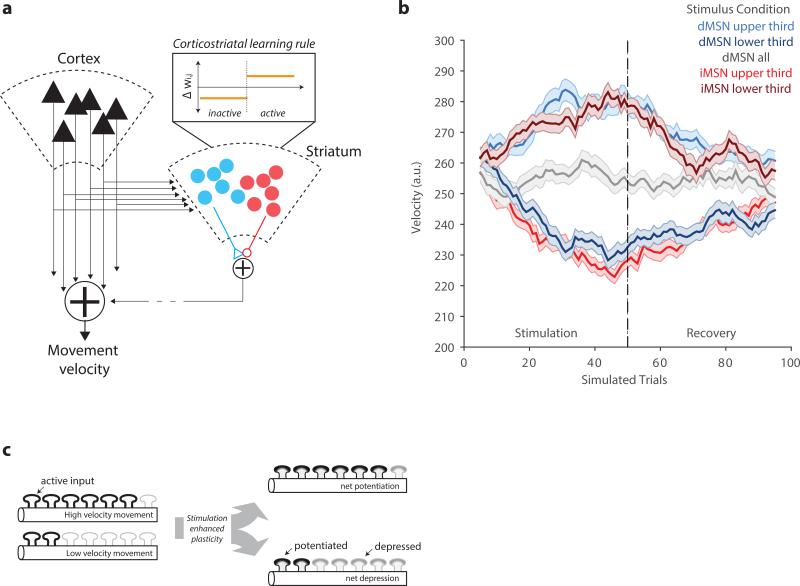
Extended Data Figure 6. A corticostriatal circuit model that implements the MeSH learning rule.
a) In the left panel, we present a schematic of the corticostriatal pathway consistent with known anatomical data 1. Descending cortical outputs, largely from Layer 5 of the neocortex project subcortically and intracortically elaborating axon collaterals onto direct (blue) and indirect (red) MSNs in the dorsal striatum. By typical convention we assume that dMSN have a net positive effect on behavior (increase in velocity in this case) and iMSN have a net inhibitory effect (decrease in velocity). These pathways are combined at the basal ganglia output nucleus (substantia nigra pars reticulata; not shown) and then combined with cortical drive to produce the net movement velocity. The model assumes that both dMSN and iMSN are positively correlated with cortical activity and with movement velocity. We assume a monotonic relationship between cortical activity and movement velocity20. The model is initialized at a presumptive steady-state in which weights between cortical inputs and dMSN and iMSN units are noisy, but distributed around 0.5 and bounded [0,1]. Most simulations were performed with 100 cortical units and 250 dMSN and iMSN each. Under all conditions weights are subject to updating according to a balanced plasticity rule (inset) in which inactive units are subject to depression and active units are subject to potentiation. All synapses drift back towards a mean of 0.5 thereby implementing a homeostatic set point to the weight distribution. Finally, photostimulation is assumed to enhance (90% increase) the magnitude of both depression and potentiation on stimulated trials in the stimulated population. Random sets of cortical inputs are assumed to be active on any given reach and are drawn from a Gamma (shape parameters: 8, 63) distribution that gives a distribution of velocities similar to that observed experimentally. Further details of the model are provided in the Methods. b) Example simulations of 100 trials (first 50 receive stimulation according to conditions described in legend followed by 50 un-stimulated recovery trials). Curves reflect averages and standard errors of 100 repetitions of the simulated condition. Other conventions as in main figures. c) Schematic of dendrite of MSN containing synapses active during arm movements. Synaptic plasticity enhanced by stimulation (inset, a) produces a net bias in synaptic weights when delivered in closed-loop. This bias can become uniform by permuting the active synapses on each simulated trial.
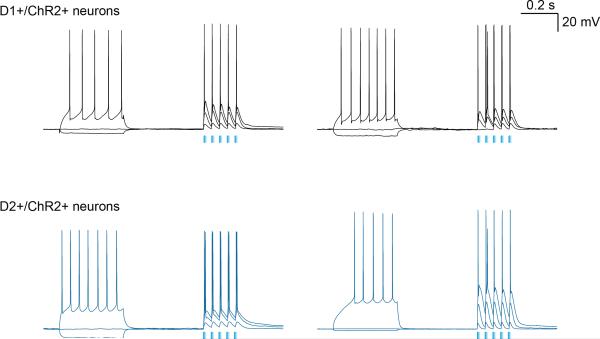
Extended Data Figure 7. D1+ and D2+ MSNs can follow repetitive stimulus trains of ~20 Hz photostimulation in vitro.
Example MSNs recorded in vitro in brain slices containing the DMS. Upper row are two example D1+ positive dMSN recorded from DMS of a Drd1a-cre::Ai32 mouse. Lower row are two example D2+ positive dMSN recorded from DMS of a Drd2a-cre::Ai32 mouse. 3 example traces shown from each. Spiking is evoked by increasing current injection (traces selected for approximately similar evoked spiking rate) and ~500 ms later by a train of 5 pulses of blue light of increasing duty cycle. All cells recorded were able to follow rapid phasic stimulation and action potentials were reliably evoked on every stimulus of these 20 Hz trains (approximately similar to the stimulus trains used in stimulation experiments described in the text). Examples were selected from 7 neurons from 3 D1+ animals, and 4 neurons, from 3 D2+ animals that were recorded for this particular stimulation design.
Extended Data Figure 8. Characterization of movement onset and reach initiation threshold crossing time.
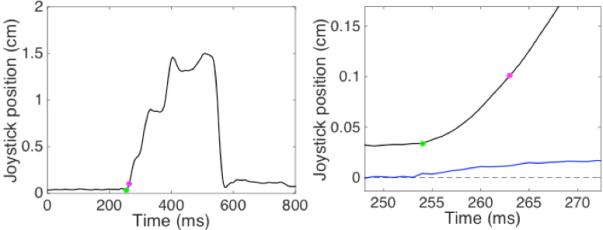
A sample reach from a sham block of 50 is shown, with eccentricity in black and velocity in blue (in right panel). The reach start is identified with the greed dot, the threshold crossing, 9 ms later when the reach eccentricity surpassed 0.1 cm, is identified with the magenta dot. The beginning of the reach (green) was assessed offline for each reach and was determined to be the first time point, sampled at 1kHz, constituting the increasing velocity associated with that reach.
Extended Data Table 1.
Lick and move rates from each animal for sham upper 1/3 stimulation sessions. Increases in the mean for lick frequency indicate a faster rate of licking (more motor output), while increases in the mean for inter-move interval indicate a slower rate of licking (less motor output). Lick rate changes per animal were not significant (p > 0.4 for all but one iMSN animal, which exhibited a a paradoxically faster lick rate, p = 0.18 ). Inter-move interval changes were also not significant within each animal (p > 0.3 except one dMSN animal which paradoxically showed an increased inter-move interval, p=0.15). Mouse number is only meant as an index and does not reflect timing or order of experiments, most of which were done in the same period of time.
| dMSN lick frequency (Hz): | Sham (sem) | Stim (sem) |
|---|---|---|
| Mouse 1 | 7.2 (0.3) | 7.4 (0.3) |
| Mouse 2 | 7.0 (0.1) | 6.9 (0.1) |
| Mouse 3 | 7.2 (0.1) | 7.2 (0.2) |
| Mouse 4 | 7.3 (0.1) | 7.2 (0.1) |
| iMSN lick frequency [Hz): | ||
| Mouse 5 | 7.1 (0.6) | 7.4 (0.3) |
| Mouse 6 | 6.9 (0.9) | 6.6 (0.3) |
| Mouse 7 | 6.8 (0.1) | 7.1 (0.2) |
| Mouse 8 | 6.7 (0.1) | 6.8 (0.1) |
| dMSN inter-move interval (seconds): | ||
| Mouse 1 | 5.9 (0.6) | 5.6 (0.5) |
| Mouse 2 | 6.2 (0.3) | 5.9 (0.3) |
| Mouse 3 | 6.1 (0.4) | 6.8 (0.2) |
| Mouse 4 | 5.7 (0.3) | 6.7 (0.4) |
| iMSN inter-move interval (seconds): | ||
| Mouse 5 | 7.6 (0.4) | 7.3 (0.4) |
| Mouse 6 | 5.9 (0.3) | 6.2 (0.3) |
| Mouse 7 | 6.2 (0.4) | 6.8 (1.1) |
| Mouse 8 | 6.0 (0.3) | 6.3 (0.4) |
Supplementary Material
Acknowledgements
This work was supported by funding from the Howard Hughes Medical Institute. J.T.D. is a Group Leader at Janelia Research Campus. We thank Albert Lee, Alla Karpova, Nelson Spruston, and members of the lab for critical reading and feedback on the manuscript. We also thank Michael Frank for helpful discussions of the OpAL model.
Footnotes
Author Contributions
E.A.Y. performed the experiments and analyzed the data. E.A.Y. and J.T.D. designed the experiments, performed the modeling, and wrote the paper.
References
- 1.Dudman JT, Gerfen CR. In: The Rat Nervous System. Paxinos G, editor. Elsevier; 2015. Ch. 17. [Google Scholar]
- 2.Balleine BW, Liljeholm M, Ostlund SB. The integrative function of the basal ganglia in instrumental conditioning. Behav Brain Res. 2009;199:43–52. doi: 10.1016/j.bbr.2008.10.034. doi:10.1016/j.bbr.2008.10.034. [DOI] [PubMed] [Google Scholar]
- 3.Mink JW. The Basal Ganglia: Focused selection and inhibition of competing motor programs. Progress in Neurobiology. 1996;50:381–425. doi: 10.1016/s0301-0082(96)00042-1. [DOI] [PubMed] [Google Scholar]
- 4.Frank MJ. Computational models of motivated action selection in corticostriatal circuits. Curr Opin Neurobiol. 2011;21:381–386. doi: 10.1016/j.conb.2011.02.013. doi:10.1016/j.conb.2011.02.013. [DOI] [PubMed] [Google Scholar]
- 5.Gurney KN, Humphries MD, Redgrave P. A new framework for cortico-striatal plasticity: behavioural theory meets in vitro data at the reinforcement-action interface. PLoS biology. 2015;13:e1002034. doi: 10.1371/journal.pbio.1002034. doi:10.1371/journal.pbio.1002034. [DOI] [PMC free article] [PubMed] [Google Scholar]
- 6.Schultz W. Behavioral theories and the neurophysiology of reward. Annual review of psychology. 2006;57:87–115. doi: 10.1146/annurev.psych.56.091103.070229. [DOI] [PubMed] [Google Scholar]
- 7.Desmurget M, Turner RS. Motor sequences and the basal ganglia: kinematics, not habits. Journal of Neuroscience. 2010;30:7685–7690. doi: 10.1523/JNEUROSCI.0163-10.2010. doi:10.1523/JNEUROSCI.0163-10.2010. [DOI] [PMC free article] [PubMed] [Google Scholar]
- 8.Tumer EC, Brainard MS. Performance variability enables adaptive plasticity of 'crystallized' adult birdsong. Nature. 2007;450:1240–1244. doi: 10.1038/nature06390. doi:10.1038/nature06390. [DOI] [PubMed] [Google Scholar]
- 9.Andalman AS, Fee MS. A basal ganglia-forebrain circuit in the songbird biases motor output to avoid vocal errors. Proceedings of the National Academy of Sciences of the United States of America. 2009;106:12518–12523. doi: 10.1073/pnas.0903214106. doi:10.1073/pnas.0903214106. [DOI] [PMC free article] [PubMed] [Google Scholar]
- 10.Gerfen CR, et al. D1 and D2 dopamine receptor-regulated gene expression of striatonigral and striatopallidal neurons. Science. 1990;250:1429–1432. doi: 10.1126/science.2147780. [DOI] [PubMed] [Google Scholar]
- 11.Kravitz AV, et al. Regulation of parkinsonian motor behaviours by optogenetic control of basal ganglia circuitry. Nature. 2010;466:622–626. doi: 10.1038/nature09159. doi:10.1038/nature09159. [DOI] [PMC free article] [PubMed] [Google Scholar]
- 12.Collins AG, Frank MJ. Opponent actor learning (OpAL): modeling interactive effects of striatal dopamine on reinforcement learning and choice incentive. Psychological review. 2014;121:337–366. doi: 10.1037/a0037015. doi:10.1037/a0037015. [DOI] [PubMed] [Google Scholar]
- 13.Kravitz AV, Tye LD, Kreitzer AC. Distinct roles for direct and indirect pathway striatal neurons in reinforcement. Nature neuroscience. 2012;15:816–818. doi: 10.1038/nn.3100. doi:10.1038/nn.3100. [DOI] [PMC free article] [PubMed] [Google Scholar]
- 14.Tai LH, Lee AM, Benavidez N, Bonci A, Wilbrecht L. Transient stimulation of distinct subpopulations of striatal neurons mimics changes in action value. Nature neuroscience. 2012;15:1281–1289. doi: 10.1038/nn.3188. doi:10.1038/nn.3188. [DOI] [PMC free article] [PubMed] [Google Scholar]
- 15.Niv Y, Daw ND, Joel D, Dayan P. Tonic dopamine: opportunity costs and the control of response vigor. Psychopharmacology. 2007;191:507–520. doi: 10.1007/s00213-006-0502-4. doi:10.1007/s00213-006-0502-4. [DOI] [PubMed] [Google Scholar]
- 16.Sutton RS, Barto AG. Reinforcement learning : an introduction. MIT Press; 1998. [Google Scholar]
- 17.Yin HH, Ostlund SB, Knowlton BJ, Balleine BW. Eur J Neurosci. 2005;22:513–523. doi: 10.1111/j.1460-9568.2005.04218.x. [DOI] [PubMed] [Google Scholar]
- 18.Paninski L, Fellows MR, Hatsopoulos NG, Donoghue JP. Spatiotemporal tuning of motor cortical neurons for hand position and velocity. Journal of neurophysiology. 2004;91:515–532. doi: 10.1152/jn.00587.2002. doi:10.1152/jn.00587.2002. [DOI] [PubMed] [Google Scholar]
- 19.Churchland MM, Shenoy KV. Temporal complexity and heterogeneity of single-neuron activity in premotor and motor cortex. Journal of neurophysiology. 2007;97:4235–4257. doi: 10.1152/jn.00095.2007. doi:10.1152/jn.00095.2007. [DOI] [PubMed] [Google Scholar]
- 20.Moran DW, Schwartz AB. Motor cortical representation of speed and direction during reaching. Journal of neurophysiology. 1999;82:2676–2692. doi: 10.1152/jn.1999.82.5.2676. [DOI] [PubMed] [Google Scholar]
- 21.Panigrahi B, et al. Dopamine Is Required for the Neural Representation and Control of Movement Vigor. Cell. 2015;162:1418–1430. doi: 10.1016/j.cell.2015.08.014. doi:10.1016/j.cell.2015.08.014. [DOI] [PubMed] [Google Scholar]
- 22.Pawlak V, Kerr JN. Dopamine receptor activation is required for corticostriatal spike-timing-dependent plasticity. The Journal of neuroscience : the official journal of the Society for Neuroscience. 2008;28:2435–2446. doi: 10.1523/JNEUROSCI.4402-07.2008. doi:10.1523/JNEUROSCI.4402-07.2008. [DOI] [PMC free article] [PubMed] [Google Scholar]
- 23.Shen W, Flajolet M, Greengard P, Surmeier DJ. Dichotomous dopaminergic control of striatal synaptic plasticity. Science. 2008;321:848–851. doi: 10.1126/science.1160575. [DOI] [PMC free article] [PubMed] [Google Scholar]
- 24.Cooper LN, Bear MF. The BCM theory of synapse modification at 30: interaction of theory with experiment. Nat Rev Neurosci. 2012;13:798–810. doi: 10.1038/nrn3353. doi:10.1038/nrn3353. [DOI] [PubMed] [Google Scholar]
- 25.Izhikevich EM, Desai NS. Relating STDP to BCM. Neural Comput. 2003;15:1511–1523. doi: 10.1162/089976603321891783. doi:10.1162/089976603321891783. [DOI] [PubMed] [Google Scholar]
- 26.Turner RS, Desmurget M. Basal ganglia contributions to motor control: a vigorous tutor. Curr Opin Neurobiol. 2010;20:704–716. doi: 10.1016/j.conb.2010.08.022. doi:10.1016/j.conb.2010.08.022. [DOI] [PMC free article] [PubMed] [Google Scholar]
- 27.Wall NR, De La Parra M, Callaway EM, Kreitzer AC. Differential innervation of direct- and indirect-pathway striatal projection neurons. Neuron. 2013;79:347–360. doi: 10.1016/j.neuron.2013.05.014. doi:10.1016/j.neuron.2013.05.014. [DOI] [PMC free article] [PubMed] [Google Scholar]
- 28.Mazzoni P, Hristova A, Krakauer JW. Why don't we move faster? Parkinson's disease, movement vigor, and implicit motivation. The Journal of neuroscience : the official journal of the Society for Neuroscience. 2007;27:7105–7116. doi: 10.1523/JNEUROSCI.0264-07.2007. [DOI] [PMC free article] [PubMed] [Google Scholar]
- 29.Phillips AG, Fibiger HC. The role of dopamine in maintaining intracranial self-stimulation in the ventral tegmentum, nucleus accumbens, and medial prefrontal cortex. Can J Psychol. 1978;32:58–66. doi: 10.1037/h0081676. [DOI] [PubMed] [Google Scholar]
- 30.Gallistel CR, Gibbon J. Time, rate, and conditioning. Psychological review. 2000;107:289–344. doi: 10.1037/0033-295x.107.2.289. [DOI] [PubMed] [Google Scholar]
Additional References
- 31.Gerfen CR, Paletzki R, Heintz N. GENSAT BAC cre-recombinase driver lines to study the functional organization of cerebral cortical and basal ganglia circuits. Neuron. 2013;80:1368–1383. doi: 10.1016/j.neuron.2013.10.016. doi:10.1016/j.neuron.2013.10.016. [DOI] [PMC free article] [PubMed] [Google Scholar]
- 32.Gong S, et al. Targeting Cre recombinase to specific neuron populations with bacterial artificial chromosome constructs. The Journal of neuroscience : the official journal of the Society for Neuroscience. 2007;27:9817–9823. doi: 10.1523/JNEUROSCI.2707-07.2007. doi:10.1523/JNEUROSCI.2707-07.2007. [DOI] [PMC free article] [PubMed] [Google Scholar]
- 33.Madisen L, et al. A toolbox of Cre-dependent optogenetic transgenic mice for light-induced activation and silencing. Nature neuroscience. 2012;15:793–802. doi: 10.1038/nn.3078. doi:10.1038/nn.3078. [DOI] [PMC free article] [PubMed] [Google Scholar]
- 34.Deacon RM. Measuring the strength of mice. J Vis Exp. 2013 doi: 10.3791/2610. doi:10.3791/2610. [DOI] [PMC free article] [PubMed] [Google Scholar]
- 35.Osborne JE, Dudman JT. RIVETS: a mechanical system for in vivo and in vitro electrophysiology and imaging. PloS one. 2014;9:e89007. doi: 10.1371/journal.pone.0089007. doi:10.1371/journal.pone.0089007. [DOI] [PMC free article] [PubMed] [Google Scholar]
- 36.Pan WX, Mao T, Dudman JT. Inputs to the dorsal striatum of the mouse reflect the parallel circuit architecture of the forebrain. Frontiers in neuroanatomy. 2010;4:147. doi: 10.3389/fnana.2010.00147. [DOI] [PMC free article] [PubMed] [Google Scholar]
- 37.Paxinos G, Franklin K. The mouse brain in stereotaxic coordinates . 2004 [Google Scholar]
- 38.Tennant KA, et al. The organization of the forelimb representation of the C57BL/6 mouse motor cortex as defined by intracortical microstimulation and cytoarchitecture. Cereb Cortex. 2011;21:865–876. doi: 10.1093/cercor/bhq159. doi:10.1093/cercor/bhq159. [DOI] [PMC free article] [PubMed] [Google Scholar]
- 39.Stujenske JM, Spellman T, Gordon JA. Modeling the Spatiotemporal Dynamics of Light and Heat Propagation for In Vivo Optogenetics. Cell reports. 2015;12:525–534. doi: 10.1016/j.celrep.2015.06.036. doi:10.1016/j.celrep.2015.06.036. [DOI] [PMC free article] [PubMed] [Google Scholar]
- 40.Brown J, Pan WX, Dudman JT. The inhibitory microcircuit of the substantia nigra provides feedback gain control of the basal ganglia output. Elife. 2014;3:e02397. doi: 10.7554/eLife.02397. doi:10.7554/eLife.02397. [DOI] [PMC free article] [PubMed] [Google Scholar]
Associated Data
This section collects any data citations, data availability statements, or supplementary materials included in this article.


