Abstract
Transcription factors (TFs) are the proteins involved in the transcription process, ensuring the correct expression of specific genes. Numerous diseases arise from the dysfunction of specific TFs. In fact, over 30 TFs have been identified as therapeutic targets of about 9% of the approved drugs. In this study, we created a structural database of small molecule-transcription factor (SM-TF) complexes, available online at http://zoulab.dalton.missouri.edu/SM-TF. The 3D structures of the co-bound small molecule and the corresponding binding sites on TFs are provided in the database, serving as a valuable resource to assist structure-based drug design related to TFs. Currently, the SM-TF database contains 934 entries covering 176 TFs from a variety of species. The database is further classified into several subsets by species and organisms. The entries in the SM-TF database are linked to the UniProt database and other sequence-based TF databases. Furthermore, the druggable TFs from human and the corresponding approved drugs are linked to the DrugBank.
Keywords: Transcription factor, gene regulation, structural database, therapeutic target, drug design
INTRODUCTION
Transcription factors (TFs) are the proteins involved in the process of transcribing genetic information from DNA to RNA. TFs play crucial roles in the regulation of gene expression. Dysfunction of specific TFs results in a wide variety of diseases such as cancer, autoimmunity, neurological disorders, diabetes, cardiovascular disease, and obesity,[1] making TFs ideal targets for novel drug design. Indeed, about 9% of approved drugs (153 out of 1691) in the DrugBank, Version 3,[2] target 32 different TFs, confirming that TFs are an important class of druggable targets.
In the modern era of drug development, computer-aided drug design (CADD) is widely used for drug discovery. Virtual screening (VS),[3] one of the most commonly used CADD methods, sieves a daunting database of millions of small molecules for an enriched subset of no more than a few hundreds of compounds that have greater chances to be leads of a given target in experimental assays. The VS process dramatically reduces the cost and increases the success rate of new drug development. In recent years, an inverse strategy of traditional VS, referred to as inverse virtual screening (IVS), has been developed to face the challenge of the high attrition rate (about 90%) in late-stage clinical trials due to efficacy or safety issues.[4,5] IVS can be used to search for potential targets of a given ligand, predicting possible side-effects for compounds of interest. Both VS and IVS methods require either a target database or a ligand database, or both.
Due to the importance of TFs in therapeutic application, several sequence-based TF databases have been developed. RegulonDB,[6] collecting experimental knowledge regarding transcriptional regulation in Escherichia coli (E. coli) K-12, is one of the earliest TF databases. After more than a decade of development, the latest version (Ver 8.0)[7] becomes an abundant source of TFs in E. coli. Another well-developed TF database is TRANSFAC,[8] which focuses on transcriptional regulation in eukaryotic organisms. Lately, TFClass,[9] a classification of human transcription factors, was provided by the same group. Databases focusing on other organisms, such as AnimalTFDB[10] for animal TFs and PlantTFDB[11] for plant TFs, have also been developed. The DBD[12] database provides a pool of resource consisting of predicted TFs for all publicly available proteomes. However, all the existing TF databases are based on sequences, while the structural information is absent, limiting their applications to CADD studies, especially to structure-based drug design. A novel structural database of TFs providing with binding pocket information is urgently needed for VS and IVS studies for therapeutic applications on gene regulation.
Here, we present a structural database of small molecule-transcription factor (SM-TF) complexes, including the structures of targetable TFs and co-bound small molecules. Structures of TFs that bind DNAs in a sequence-specific manner were collected from Protein Data Bank (PDB)[13]. Totally, SM-TF contains 934 entries covering 176 TFs from a variety of species. For each TF in the database, multiple conformations of binding pockets and corresponding small molecule binding partners are provided. SM-TF serves as a valuable TF database to assist structure-based drug design and is suitable for both VS and IVS studies targeting gene regulation.
MATERIAL AND METHODS
Transcription factors
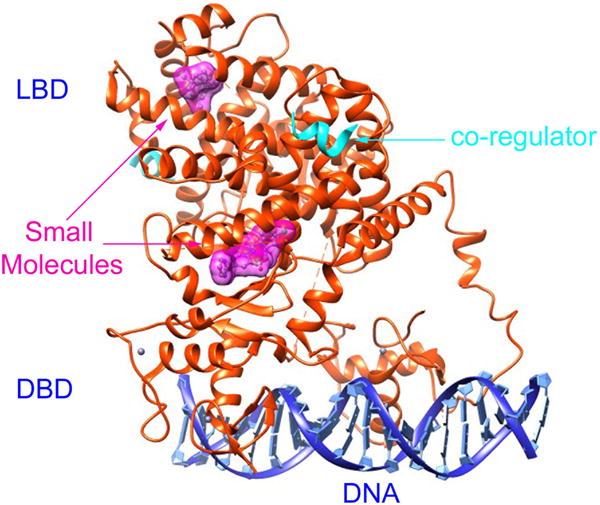
Generally, a TF is a protein that binds to specific DNA sequences called enhancer, promoter, silencer, or response element, thereby regulating the transcription of genes. The region that binds to specific sequences of DNA is called DNA-binding domain (DBD), as shown in Figure 1. Another structural feature of TFs is that they contain a trans-activating domain (TAD) and an optional signal sensing domain (SSD) (also known as ligand binding domain, LBD). TAD binds other proteins like co-regulators and the binding regions are often referred to as activation functions (AFs). SSD senses signals such as small molecules and ions, resulting in up- or down-regulation of related gene expressions. Notably, TAD and SSD may locate in the same domain, and both ligand binding sites and AFs are druggable. Figure 1 also shows the small molecules and co-regulators binding to the LBD.
Figure 1.

An example of the TF-small molecule complex: Peroxisome proliferator-activated receptor γ (PPAR γ) complexed with DNA (PDB id: 3DZU). The heterodimer of the TF is plotted in ribbon diagram (orange). Each TF consists of a DBD and a LBD. The two DBDs bind to a sequence-specific DNA (blue). The two LBDs bind with two small molecules, represented in surface diagram (magenta), and two co-regulators, shown in ribbon diagram (cyan). The figure is created by the Chimera program.[14]
Database setup
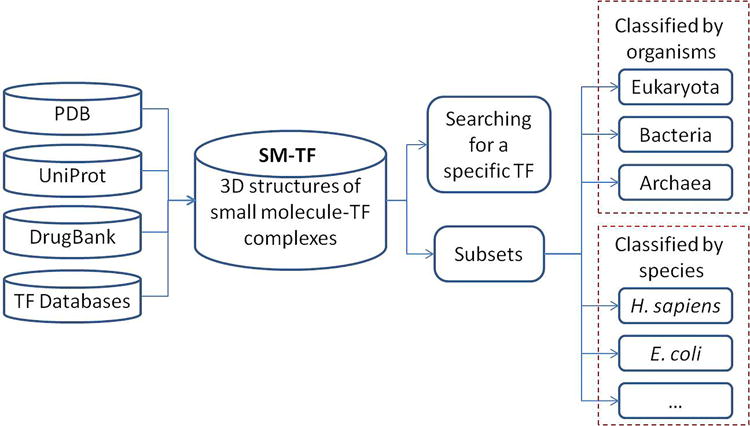
A brief flowchart about the preparation and the organization of the database is shown in Figure 2. The structures of TFs were extracted from PDB using the following key words: “transcription factor”, “transcriptional regulator”, “transcriptional activator”, “transcriptional repressor”, “gene regulator”, “gene activator”, or “gene repressor”. Only X-ray or NMR structures were kept in the SM-TF database. Totally, 3077 PDB entries (July 3rd, 2015) were downloaded. The downloaded PDB entries were processed as follows:
Step 1: The PDB entries were grouped using the UniProt id of each protein. Proteins with the “sequence-specific DNA binding” function, according to the “Gene Orthology – molecular function” information provided by the UniProt database[15], were kept.
Step 2: Each PDB entry was searched for the HET information. The entries with only water molecules or ions were removed.
Step 3: The remaining entries were manually examined. Entries other than TFs were discarded.
Step 4: The remaining PDB entries were further reviewed. Entries containing functional small molecules were kept, and the entries containing only buffer or detergent ligands were removed. If there were more than one PDB entries containing an identical small molecule binding to the same pocket of the same protein, the structure with a higher resolution was kept.
Step 5: For each remaining entry, the small molecules of interest were extracted and named as “[PDB_id]_[HET_name]_[chain_id]_[resSeq].pdb”. Amino acid residues and other ligands (such as water molecules and ions, excluding the small molecules saved in “[PDB_id]_[HET_name]_[chain_id]_[resSeq].pdb”) within 6.5 Å around each small molecule were defined as the binding site, named as “[small molecule file name]_site.pdb”. Then, these ligands were removed, resulting in a pdb format file of the binding site that contains only the amino acid residues. The resulting file was named as “[small molecule file name]_site_clean.pdb”. There are several reasons for using the PDB format. First, most CADD programs use PDB format files as input. Second, the PDB format does not require hydrogen atoms, partial charges and atom types and therefore does not introduce artificial uncertainties. Finally, format conversion is straightforward via a third-party program such as OpenBabel[16].
Step 6: The TFs were categorized according to TF organisms and species.
Step 7: The data in the SM-TF database were linked to related databases such as UniProt, DrugBank, and other TF databases to provide detailed biological information.
Figure 2.

A brief flowchart of the SM-TF database. The 3D structures of the TFs and the co-bound small molecules are extracted from PDB. The features of individual entries in the SM-TF database are linked to related databases such as PDB, UniProt, DrugBank, and other TF databases. A specific TF target and its bound small molecules can be accessed through keyword searching. The whole database and the subsets can be downloaded freely.
RESULTS
Web interface
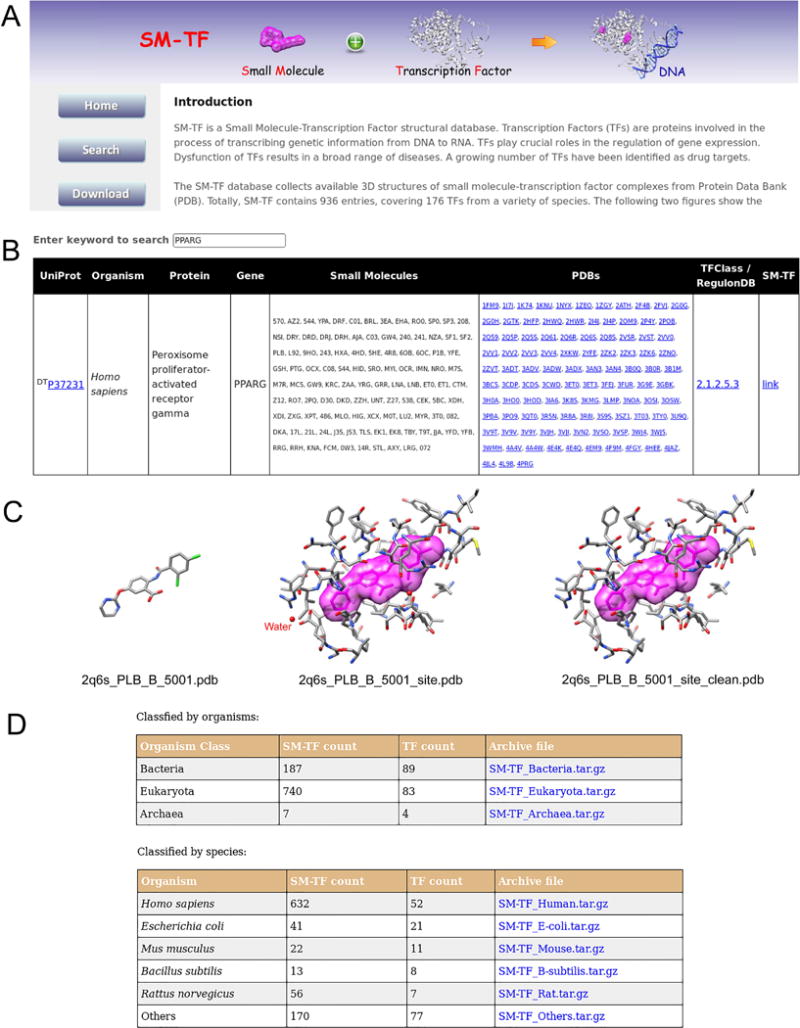
The manually reviewed data are deposited in the SM-TF database, which is freely available at the website, http://zoulab.dalton.missouri.edu/SM-TF. The database consists of Home, Search, and Download. The snapshots of each web page are shown in Figure 3. The Home page provides a summary of the SM-TF database, including an introduction of the database, TF structural features, database setup, and an example SM-TF entry.
Figure 3.

Snapshots of the SM-TF database. The website consists of three web pages: Home, Search, and Download. A. The Home page provides a summary of the database. B. The Search page lists the SM-TF data in a searchable table. This panel displays the output of an example search with the keyword “PPARG”. C. One entry of the search results for PPARG. The left plot shows the bound conformation of the small molecule colored by atom types in stick representation. The middle plot displays the binding pocket, shown in stick representation and colored by atom types. For clarity, the co-bound small molecule is also shown in surface representation (magenta). The right plot is the clean binding pocket, which contains only the amino acid residues. D. The Download page provides the links for downloading the whole or part of the database.
Next, the Search page shows a searchable table that lists all the collected TFs in the database. A subset or a specific TF will be displayed when the user performs a search with a keyword (Figure 3B). Each TF is provided with the information on UniProt id, organism type, protein name, gene name, the HET name of the co-bound small molecules, and the corresponding PDB entries. The druggable TFs are marked “DT” in front of their UniProt id entries. The TFs from Homo sapiens and Mus musculus are linked to TFClass, and the TFs from E. coli are linked to RegulonDB. The 3D structures of the binding pockets and the co-bound small molecules can be downloaded from the link in the last column of the table.
Finally, the Download page provides the link for downloading the whole SM-TF database. The web page also provides an excel table containing the related TF information. To facilitate users working on individual specific species, the database is classified in two ways: either according to organisms or according to species, as described in the next subsection. The download links for individual subsets are also provided (Figure 3D).
Data distribution
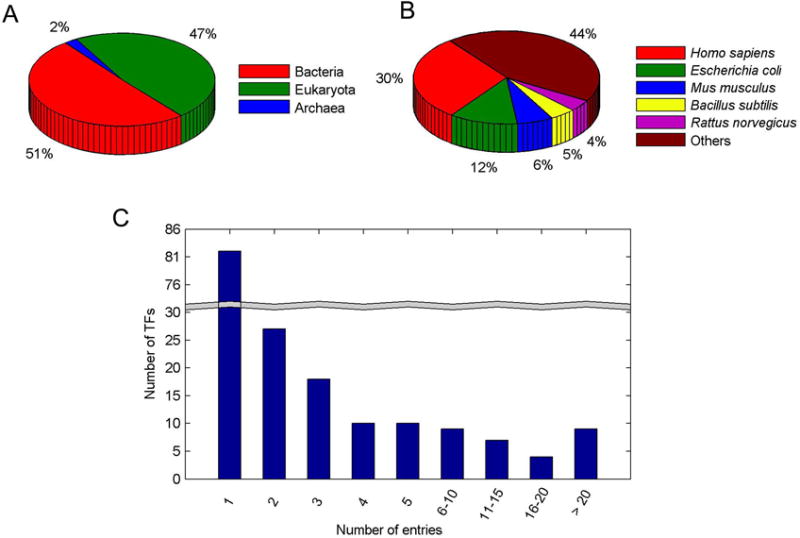
The SM-TF database consists of the known 3D structures of the transcription factors complexed with small molecules. In the current version, the SM-TF contains 934 entries covering 176 TFs from a variety of species. Figure 4A shows the distribution of TFs classified by organisms. The majority of TFs are derived from bacteria and eukaryota, accounting for 51% and 47%, respectively. Only 2% of TFs are from archaea.
Figure 4.

Distributions of data in the SM-TF database. (A) The distribution of TFs classified by organisms. (B) The distribution of TFs classified by species. (C) The distribution of the number of entries vs the number of the corresponding TFs.
A further classification of the TFs based on species is shown in Figure 4B. The largest class, which is about 30% of the database, consists of 52 different TFs from Homo sapiens. The second-largest class (12% of the database) is composed of 21 TFs from E. coli. The TFs from Mus musculus, Bacillus subtilis, and Rattus norvegicus comprise the other three classes with significant sizes, accounting for 6%, 5%, and 4% of the database, respectively. The species information for the remaining TFs is described on the SM-TF website.
Different TFs usually have different number of entries, with each entry bound with different small molecules or exhibiting distinct binding sites. Figure 4C shows the distribution of the number of entries of TFs in the database. Over half (94 out of 176) of TFs have more than two entries. Remarkably, nine TFs are associated with more than 20 entries each. TFs with multiply entries are usually well-studied therapeutic targets. For example, peroxisome proliferator-activated receptor γ (PPARγ) from Homo sapiens (UniProt id P37231, with 126 entries) has been identified as a druggable target for various diseases such as obesity, diabetes, hypertension, and cancer.[17] Estrogen receptor (ESR1) from Homo sapiens (UniProt id P03372, with 83 entries) is another important therapeutic target for many diseases such as cancer, osteoporosis, neurodegenerative diseases, cardiovascular disease, insulin resistance, lupus erythematosus, endometriosis, and obesity.[18]
Data presentation
The TFs in the database are indexed by UniProt id. Each TF is provided with information such as “Organism”, “Protein”, or “Gene” extracted from the UniProt database. Each entry of a TF is given three files in the PDB format, the bound conformation of the small molecule, the corresponding binding site, and a clean binding site containing only the amino acid residues. The entry files are named by the PDB id followed by the small molecule information. One example is presented in Figure 3C, which is the entry of PPARγ from Homo sapiens (UniProt id P37231). The bound conformation of the small molecule is represented in stick mode, as shown on the left panel of Figure 3C. The file “2q6s_PLB_B_5001.pdb” is named as follows: “2q6s” is the PDB id; “PLB” is the HET name of the small molecule; “B” is the chain id; “5001” is the “residue sequence number” in the PDB that represents the specific small molecule. The middle panel of Figure 3C shows the binding pocket formed by the amino acid residues and ligands (e.g. water molecules) within 6.5 Å around the small molecule “PLB”. The clean binding pocket, in which water, ion and other ligands are removed, is shown in the right panel of Figure 3C.
The files containing the small molecules are recommended to be used as a positive control (“known ligands”) for virtual screening studies on TFs. The files containing the binding site structures can be used as a target database for inverse docking. Because most molecular docking programs do not consider structural water molecules and ions, users are usually recommended to use the files containing the clean binding sites, in which the water molecules and ions are removed.
Links to other databases
Each entry in the SM-TF database is linked to the corresponding PDB entry, which provides detailed structural information about the entry. Each TF is linked to the corresponding entry in the UniProt database, which provides important information such as biological functions and related diseases. In addition, The TFs from Homo sapiens and E. coli are each linked to the entries in the TFClass and RegulonDB, two well-developed TF databases for human and E. coli, respectively. Because the TFClass also provides the data for the mouse orthologs, each TF from Mus musculus in the SM-TF database is also linked to the TFClass.
Moreover, the therapeutic TF targets in the SM-TF database are also linked to DrugBank, which contains comprehensive information on drugs and drug targets. Specifically, we combined DrugBank with TFClass, the database of human TFs, using the UniProt id to identify TFs in DrugBank Version 3. A total of 32 druggable TFs have been extracted, which are the targets of 9% of the approved drugs (153 out of 1691). Over a half of these druggable TFs (20 out of 32) are available in the SM-TF database. A table containing druggable TFs and corresponding approved drugs is provided on the SM-TF web site. Each drug entry is linked to DrugBank for detailed information.
DISCUSSION
Although TFs play essential roles in gene expression, the definition of TF remains ambiguous.[19,20] In the preparation of the SM-TF database, we used a conservative definition for TFs, which refers to the proteins that are involved in gene expression and manifest sequence-specific DNA binding. The collected proteins were manually reviewed before being deposited to the database. This definition is consistent with the preparation of other TF databases such as DBD and TFClass. The DBD database predicts a novel TF according to the sequence of DNA binding domain, and TFs in the TFClass are classified based on the DNA binding domain.
In addition to SM-TF, several other structural databases with regard to targetable proteins have been developed in recent years. sc-PDB[21] collects all high-resolution crystal structures of protein-ligand complexes from PDB, forming an abundant ligandable protein structural database. In the most recently released version (v.2013), sc-PDB contains 9283 entries, corresponding to 3678 different proteins and 5608 different ligands. The structure of the binding pocket for each entry is provided, for the convenience of CADD and IVS studies. However, the large data with unclassified targets may complicate the post-analysis of the screening results. Potential Drug Target Database (PDTD),[22] focusing on therapeutic targets, contains 1207 entries covering 841 known and potential drug targets in its most recently released version in 2008. The structure of the binding pocket for each entry is provided, facilitating CADD and IVS applications.[23] For the convenience of specific studies, the targets in this database are categorized into multiple subsets according to two criteria: therapeutic areas and biochemical criteria. However, the majority of the proteins in PDTD are enzymes, and therefore PDTD cannot be used for TF-related studies. In other targetable databases, such as Therapeutic Target Database (TTD)[24] and Drug Adverse Reaction Database (DART),[25] 3D structures are not available and have to be prepared by users.
In summary, we present the first version of the SM-TF database that contains 934 entries covering 176 targetable TFs. With the increase of the number of TF structures deposited in PDB, the SM-TF database will be updated periodically. In addition, the number of TF entries from one species is extendable through homology modeling based on TF entries from other species.
In the current version, the user is referred to related databases, such as UniProt and DrugBank, for more biological information through hyperlinks provided in the SM-TF database. We are preparing a separate web page with detailed structural and biological information for each TF. Then, we will add a search engine to the web interface. These new features will appear in the next version of the database.
Acknowledgments
This work was supported by the NSF CAREER Award [DBI-0953839], the American Heart Association (Midwest Affiliate) [13GRNT16990076], and the National Institutes of Health (NIH) [R01GM109980] to XZ.
References
- 1.Lee TI, Young RA. Cell. 2013;152:1237–1251. doi: 10.1016/j.cell.2013.02.014. [DOI] [PMC free article] [PubMed] [Google Scholar]
- 2.Wishart DS, Knox C, Guo AC, Shrivastava S, Hassanali M, Stothard P, Chang Z, Woolsey J. Nucleic Acids Res. 2006;34:D668–D672. doi: 10.1093/nar/gkj067. [DOI] [PMC free article] [PubMed] [Google Scholar]
- 3.Walters WP, Stahl MT, Murcko MA. Drug Discov Today. 1998;3:160–178. [Google Scholar]
- 4.Xie L, Xie L, Bourne PE. Curr Opin Struct Biol. 2011;21:189–199. doi: 10.1016/j.sbi.2011.01.004. [DOI] [PMC free article] [PubMed] [Google Scholar]
- 5.Nwaka S, Hudson A. Nat Rev Drug Discov. 2006;5:941–955. doi: 10.1038/nrd2144. [DOI] [PubMed] [Google Scholar]
- 6.Huerta AM, Salgado H, Thieffry D, Collado-Vides J. Nucleic Acids Res. 1998;26:55–59. doi: 10.1093/nar/26.1.55. [DOI] [PMC free article] [PubMed] [Google Scholar]
- 7.Salgado H, Peralta-Gil M, Gama-Castro S, Santos-Zavaleta A, Muñiz-Rascado L, García-Sotelo JS, Veiss V, Solano-Lira H, Martinez-Flores I, Medina-Rivera A, Salgado-Osorio G, Alquicira-Hernández S, Alquicira-Hernández K, López-Fuentes A, Porrón-Sotelo L, Huerta AM, Bonavides-Martínez C, Balderas-Martínez YI, Pannier L, Olvera M, Labastida A, Jiménez-Jacinto V, Vega-Alvarado L, del Moral-Chávez V, Hernández-Alvarez A, Morett E, Collado-Vides J. Nucleic Acids Res. 2013;41:D203–D213. doi: 10.1093/nar/gks1201. [DOI] [PMC free article] [PubMed] [Google Scholar]
- 8.Matys V, Kel-Margoulis OV, Fricke E, Liebich I, Land S, Barre-Dirrie A, Reuter I, Chekmenev D, Krull M, Hornischer K, Voss N, Stegmaier P, Lewicki-Potapov B, Saxel H, Kel AE, Wingender E. Nucleic Acids Res. 2006;34:D108–D110. doi: 10.1093/nar/gkj143. [DOI] [PMC free article] [PubMed] [Google Scholar]
- 9.Wingender E, Schoeps T, Haubrock M, Dönitz J. Nucleic Acids Res. 2015;43:D97–D102. doi: 10.1093/nar/gku1064. [DOI] [PMC free article] [PubMed] [Google Scholar]
- 10.Zhang HM, Liu T, Liu CJ, Song S, Zhang X, Liu W, Jia H, Xue Y, Guo AY. Nucleic Acids Res. 2015;43:D76–D81. doi: 10.1093/nar/gku887. [DOI] [PMC free article] [PubMed] [Google Scholar]
- 11.Jin J, Zhang H, Kong L, Gao G, Luo J. Nucleic Acids Res. 2014;42:D1182–D1187. doi: 10.1093/nar/gkt1016. [DOI] [PMC free article] [PubMed] [Google Scholar]
- 12.Wilson D, Charoensawan V, Kummerfeld SK, Teichmann SA. Nucleic Acids Res. 2008;36:D88–D92. doi: 10.1093/nar/gkm964. [DOI] [PMC free article] [PubMed] [Google Scholar]
- 13.Berman HM, Westbrook J, Feng Z, Gilliland G, Bhat TN, Weissig H, Shindyalov IN, Bourne PE. Nucleic Acids Res. 2000;28:235–242. doi: 10.1093/nar/28.1.235. [DOI] [PMC free article] [PubMed] [Google Scholar]
- 14.Pettersen EF, Goddard TD, Huang CC, Couch GS, Greenblatt DM, Meng EC, Ferrin TE. J Comput Chem. 2004;25:1605–1612. doi: 10.1002/jcc.20084. [DOI] [PubMed] [Google Scholar]
- 15.The UniProt Consortium. Nucleic Acids Res. 2015;43:D204–D212. doi: 10.1093/nar/gku989. [DOI] [PMC free article] [PubMed] [Google Scholar]
- 16.O’Boyle NM, Banck M, James CA, Morley C, Vandermeersch T, Hutchison GR. J Cheminform. 2011;3:33. doi: 10.1186/1758-2946-3-33. [DOI] [PMC free article] [PubMed] [Google Scholar]
- 17.Kersten S, Desvergne B, Wahli W. Nature. 2000;405:421–424. doi: 10.1038/35013000. [DOI] [PubMed] [Google Scholar]
- 18.Deroo BJ, Korach KS. J Clin Invest. 2006;116:561–570. doi: 10.1172/JCI27987. [DOI] [PMC free article] [PubMed] [Google Scholar]
- 19.Vaquerizas JM, Kummerfeld SK, Teichmann SA, Luscombe NM. Nat Rev Genet. 2009;10:252–263. doi: 10.1038/nrg2538. [DOI] [PubMed] [Google Scholar]
- 20.Spitz F, Furlong EE. Nat Rev Genet. 2012;13:613–626. doi: 10.1038/nrg3207. [DOI] [PubMed] [Google Scholar]
- 21.Desaphy J, Bret G, Rognan D, Kellenberger E. Nucleic Acids Res. 2015;43:D399–D404. doi: 10.1093/nar/gku928. [DOI] [PMC free article] [PubMed] [Google Scholar]
- 22.Gao Z, Li H, Zhang H, Liu X, Kang L, Luo X, Zhu W, Chen K, Wang X, Jiang H. BMC Bioinformatics. 2008;9:104. doi: 10.1186/1471-2105-9-104. [DOI] [PMC free article] [PubMed] [Google Scholar]
- 23.Grinter SZ, Liang YY, Huang SY, Hyder SM, Zou XQ. J Mol Graph Model. 2011;29:795–799. doi: 10.1016/j.jmgm.2011.01.002. [DOI] [PMC free article] [PubMed] [Google Scholar]
- 24.Qin C, Zhang C, Zhu F, Xu F, Chen SY, Zhang P, Li YH, Yang SY, Wei YQ, Tao L, Chen YZ. Nucleic Acids Res. 2014;42:D1118–D1123. doi: 10.1093/nar/gkt1129. [DOI] [PMC free article] [PubMed] [Google Scholar]
- 25.Ji ZL, Han LY, Yap CW, Sun LZ, Chen X, Chen YZ. Drug Saf. 2003;26:685–690. doi: 10.2165/00002018-200326100-00002. [DOI] [PubMed] [Google Scholar]


