

Abstract
The bromodomain and extra terminal domain (BET) inhibitor, JQ1 has marked antitumor activity against several hematologic malignancies as well as solid tumor models. Here we investigated its activity in vitro and in vivo against models of childhood rhabdomyosarcoma and Ewing sarcoma. In vitro, JQ1 (but not the inactive enantiomer JQ1R) inhibited cell proliferation, and increased G1 fraction of cells, although there was no correlation between cell line sensitivity and suppression of c-MYC or MYCN. In vivo, xenografts showed significant inhibition of growth during the period of treatment, and rapid regrowth after treatment was stopped, activity typical of antiangiogenic agents. Further, xenografts derived from cell lines intrinsically resistant or sensitive to JQ1 in vitro had similar sensitivity in vivo as xenografts. Further investigation showed that JQ1 reduced tumor vascularization. This was secondary to both drug-induced down regulation of tumor-derived growth factors and direct effects of JQ1 on vascular elements. JQ1 suppressed VEGF-stimulated vascularization of Matrigel plugs in mice, and in vitro suppressed differentiation, proliferation and invasion of human umbilical cord vascular endothelial cells (HUVECs). In HUVECs JQ1 partially suppressed c-MYC levels, but dramatically reduced AP-1 levels and activity through suppression of the AP-1 associated protein FOSL1. Our data suggest that the antitumor activity of JQ1 in these sarcoma models is largely a consequence of its anti-angiogenic activity.
Keywords: BET inhibitors, childhood cancer, sarcomas, angiogenesis, AP-1, c-MYC
Introduction
The transcriptional regulator c-MYC is the most frequently deregulated oncogene in human tumors including pediatric cancer. Both c-MYC and MYCN are frequently amplified or overexpressed in rhabdomyosarcoma (1–3) and musculoskeletal neoplasms (4). C-MYC is overexpressed in Ewing sarcoma (5), and expression of the EWS-FLI1 fusion protein upregulates c-MYC expression (6) through an indirect mechanism (7). Thus c-MYC oncogene amplification or overexpression may play an important role in the development of childhood sarcomas as it has been found for other human malignancies. c-MYC regulates cell proliferation, inflammation, suppression of differentiation, apoptosis and stimulation of angiogenesis. Thus, as with many other malignancies, downregulation of c-MYC would be predicted to retard tumor progression of childhood sarcoma.
Recently, small molecule inhibitors of BRD4, a member of the bromodomain and extra terminal domain (BET) protein family have been described that bind competitively to acetyl-lysine recognition motifs, or bromodomains (8). The most studied compound, JQ1, exerts broad-spectrum antitumor activity, possibly by selective inhibition of oncogenes, including c-MYC, through disruption of super-enhancers (9). Notable activity has been demonstrated in non-clinical models of several hematologic malignancies (10, 11), and in MYC `driven' tumors such as neuroblastoma (12), and medulloblastoma (13). Sensitivity to JQ1 in a series of serous ovarian cancer cells correlated with elevated expression of MYCN (14), whereas GLI2-dependent upregulation of c-MYC was shown to mediate JQ1 resistance in pancreatic cancer cell lines (15). Downregulation of c-MYC by JQ1 induced cell cycle arrest and apoptosis in ovarian cancer cell lines and downregulated lactate dehydrogenase A (LDHA) resulting in decreased lactate production and reduced energy supply (16). JQ1 has been shown to impair estrogen-mediated growth and transcription (17), and inhibit androgen receptor variants from chromatin binding in prostate cancer cells thereby overcoming resistance to endocrine-based therapies (18). JQ1 reduced oncogenic IκB activity in diffuse large B-cell lymphoma (DLBCL) (19), and has been proposed for the treatment of DLBCL, although the in vivo activity against the one xenograft model tested was marginal with an increase in event-free survival advantage of only 3 days for JQ1 treated mice over control animals (20). JQ1 suppressed TNF-α mediated NF-κB activation and NF-κB-dependent target gene activation in A549 lung adenocarcinoma cells (21). Further, a subset of lung adenocarcinoma cell lines were sensitive to JQ1 through a mechanism independent of c-MYC downregulation (22). JQ1 reduces osteosarcoma viability and is a potent inhibitor of osteoblast and osteoclast differentiation associated with suppression of MYC and RUNX2 expression (23). JQ1 has also been reported to synergize with rapamycin in osteosarcoma models (24).
Tumor progression and maintenance requires the development of an ample blood supply therefore neovascularization is critical to tumor growth and metastasis. c-MYC not only promotes cell proliferation and transformation, but also vascular and hematopoietic development, by functioning as a master regulator of angiogenic factors (25). In mice lethality of c-myc−/− embryos is associated with profound defects in vasculogenesis and primitive erythropoiesis (25). Oncogenes such as c-myc suppress the expression of the anti-angiogenic factor thrombospondin-1 (26), and transgenic studies have shown that transformation induced by several oncoproteins, including c-MYC, is sufficient to induce an angiogenic response and the expression of VEGF (27, 28).
Here we present evidence that BRD4 inhibitor JQ1 has potent antiangiogenic activity in pediatric sarcoma models. Our data demonstrate that JQ1 can regulate angiogenesis to block tumor-derived angiogenic factors, directly suppress VEGF-driven angiogenesis, and impair the proliferation and differentiation of human vascular endothelial cells. These findings support the notion that BRD4 may represent a relevant target for therapeutic intervention in pediatric sarcomas.
Material and Methods
Reagents
Medium 200, RPMI1640, fetal bovine serum (FBS), and Alamar Blue (AB) were purchased from Invitrogen (Life Technologies, Grand Island, NY). Low serum growth supplement (LSGS) was obtained from Cascade Biologics Inc. (Life Technologies). Endothelial Tube Formation Assay Kits were from Cell Biolabs, Inc. (San Diego, CA). Growth factor–reduced Matrigel for in vivo experiments and precoated Matrigel inserts for invasion assays were purchased from BD Biosciences (San Jose, CA). JQ1 and JQ1R (inactive enantiomer) were kindly provided by Dr. James E. Bradner (Dana-Farber Cancer Institute). Anti-CD34 antibody (ab27448) was from Abcam (Cambridge, MA, USA). VEGF was purchased from R&D Systems Inc. (Minneapolis, MN).
Cell lines and xenograft models
Human umbilical vein vascular endothelial cells (HUVEC) were obtained from the American Type Culture Collection (ATCC). All experiments were done using endothelial cells between passages 3 and 8. HUVECs were maintained in medium M200 (Life Technologies) with 15% FBS, endothelial cell growth supplements (LSGS Medium, Cascade Biologics), and 2 mmol/L glutamine at 37°C with 5% CO2. All cells were maintained as sub confluent cultures and split 1:3, 24 hours before use. Rhabdomyosarcoma (RMS) and Ewing sarcoma (EWS) cells were cultured in RPMI-1640 supplemented with 10% fetal bovine serum (FBS). The cell lines and xenografts were developed in this laboratory. Cryopreserved early passage cells were re-established in culture and were used within 6 months of short tandem repeat (STR) analysis and verification of authenticity.
In vitro growth inhibition studies
Sarcoma cells were cultured in RPMI medium and HUVECs in M200. Cells were seeded on 6-well plates at a density of approximately 1 × 10⁵ cells/well and allowed to attach overnight. JQ1 was dissolved in DMSO, and used at final concentrations of <0.1% DMSO in medium. Cells were treated with various concentrations of JQ1 1 day after seeding. After 4 days, Calcein AB (Life Technologies) was added directly into culture media at a final concentration of 10% and the plates were incubated at 37°C. Optical density was measured spectrophotometrically at 540 and 630 nm after adding Calcein AB for 3 to 4 hours. As a negative control, Calcein AB was added to medium without cells.
Cell invasion assays
For the invasion assays, 1 × 10⁵ cells were added into the upper chamber of the insert precoated with Matrigel (BD Biosciences). Cells were plated in medium without serum, and medium containing 10% FBS in the lower chamber served as chemo-attractant. After several hours of incubation, the cells that did not invade through the pores were carefully wiped away from the upper side of the membrane using an absorbent cotton swab. Then the inserts were stained with 20% methanol and 0.2% crystal violet, imaged, and counted with an IX71 inverted microscope (Olympus). All the experiments were repeated 3 times independently.
Cell cycle analysis
Distinct phases of the cell cycle were distinguished by DNA staining with the fluorescent dye propidium iodide (PI) and measured by flow cytometry. Cells were washed in ice cold PBS, fixed in 70% ethanol, and stained for 30 min at 37°C with PI (50μg/mL propidium iodide in hypotonic sodium citrate solution containing 50 μg/mL RNase) followed by flow cytometric analysis. The percentages of cells in G1, S, and G2/M phases was determined using the cell-cycle analysis program Modfit LT 3.2 (Verity Software House, Portland, ME). RMS and Ewing sarcoma cells (60% confluent) were treated with JQ1 (500nM), for 24 Hr and cell cycle distribution was determined by FACs analysis staining with Propidium Iodide (BD Bioscience) according to the manufacturer's protocol.
Western blotting
Cell lysis, protein extraction, and immunoblotting were as described previously (6, 9). We used primary antibodies to glyceraldehyde-3-phosphate dehydrogenase (GAPDH), c-MYC and MYCN (Cell Signaling Technologies, Danvers, MA). Immunoreactive bands were visualized by using Super Signal Chemiluminiscence substrate and Biomax MR and XAR film (Perkin Elmer, Boston, MA). Fifteen microliters of total sample was resolved on a 4% to 12% SDS-polyacrylamide gel. Proteins were transferred to a PVDF membrane and immune-detection was conducted with specific primary antibodies.
Endothelial cell tube formation assay
For the Endothelial Tube Formation Assay (CBA200, Cell Biolabs Inc., San Diego), ECM gel was thawed at 4°C and mixed to homogeneity using cooled pipette tips. Cell culture plates (96-well) were bottom-coated with a thin layer of ECM gel (50 μL/well), which was left to polymerize at 37°C for 60 minutes. HUVECs (2−3 × 10⁴) stimulated with vascular endothelial growth factor (VEGF) in 150 μL medium were added to each well on the solidified ECM gel. Culture medium was added to each well in the presence or absence of JQ1. The plates were incubated at 37°C for 12 to 18 hr and the endothelial tubes were observed using a fluorescent microscope after staining with Calcein AM. Three microscope fields were selected at random and photographed. Tube-forming ability was quantified by counting the total number of cell clusters and branches under a 4× objective and 4 different fields per well. The results are expressed as mean fold change of branching compared with the control groups. Each experiment was conducted at least three times.
Vascularization of Matrigel plugs in vivo
For animal experiments mice were maintained under barrier conditions and experiments were conducted using protocols and conditions approved by the institutional animal care and use committee of the Research Institute at Nationwide Children's Hospital (AR-09-0036). To characterize anti-angiogenic properties of JQ1 in vivo, we conducted murine Matrigel plug experiments. PBS was used as a negative control, and VEGF (100 ng/mL) as a positive control. Matrigel was injected subcutaneously into CB17SC scid−/− female mice (n=3/group), forming semi-solid plugs. Animals received treatment of JQ1 administered by oral gavage (50 mg/kg; formulated in DW5 (5% dextrose in water), 10% DMSO) daily for 7 days. On day 7, plugs were excised under anesthesia, fixed in PBS-buffered 10% formalin containing 0.25% glutaraldehyde, and were processed for hematoxylin-eosin (H&E), and vascular identity of the infiltrating cells was established with CD34 immunostaining. The regions containing the most intense areas of neovascularization (“hotspots”) were chosen for analysis. Eight hotspots were identified for each Matrigel or tumor section. The ImagePro Plus analysis system was used to quantify the percentage of area occupied by the vessel-like structures in each field. The mean ± SE from each group were compared. The negative IHC control was obtained by tissue staining with secondary antibody only. For hemoglobin determination, the Matrigel plug was weighed and dissolved in physiological saline (0.9% NaCl), and hemoglobin content assayed using Drabkin's reagent (Sigma Diagnostics, St. Louis, MO). The results are reported as blood volume per unit weight of Matrigel.
Evaluation of JQ1 against sarcoma tumor xenografts
All experiments were conducted under Institutional Animal Care and Use Committee–approved protocol (AR09-0036). Four tumor models were selected. Two Ewing's sarcomas (EW5, EW8) and 2 rhabdomyosarcoma (Rh10, Rh28) were selected for in-vivo experiments. Tumor lines and methods have been reported previously (29). Tumors were implanted subcutaneously in the left flank. Treatment was started when tumors exceeded 200 mm3. Mice received JQ1 (50 mg/kg), daily for a planned 3 weeks treatment with a further 3 weeks observation. Tumor volumes (cm3) and tumor responses were determined as previously described (29). In another experiment tumors were grown and JQ1 daily treatment (7 or 14 days) was started when tumors exceeded 100 mm3. Tumors were harvested for formalin fixed and frozen tissue. Sections were stained for CD34-positive cells to assess microvessel formation and for Ki67 staining for proliferation. Frozen tumor samples were powdered under liquid N2, and protein was extracted as described previously for angiogenesis array processing (30, 31).
Human Angiogenesis Array
Proteome profiler antibody array (R & D systems; Cat no ARY007, Minneapolis, MN) was used according to manufacturer's instructions to detect the relative levels of expression of 55 angiogenesis related proteins in control and treated tumors. After blocking the membranes 300 μg of protein from the tumor tissue lysate from control and JQ1 treated groups were added and incubated overnight at 4°C. Next day the membranes were washed and streptavidin-HRP was added or 30 min. Immunoreactive signals were visualized by using Super Signal Chemiluminiscence substrate (Life Technologies) and Biomax MR and XAR film (Perkin Elmer). Array data on developed X-ray film was quantified by scanning the film using a BioRad Molecular Image Gel Doc™ XR+ and data analyzed using Image Lab™ software.
Transcription factor profiling array
The activity of 47 human transcription factors in human endothelial cells was assayed using a plate array according to the manufacturer's instructions (Signosis Inc., Santa Clara, CA). Briefly, nuclear proteins were isolated from cells and 12 × g nuclear extract was added to a mixture of DNA sequences that encoded 47 different human transcription factor–binding sites. This mixture was incubated at 16°C for 30 min to allow for the formation of transcription factor–DNA complexes, then passed through an isolation column to separate the transcription factor–DNA complexes from free DNA probes. 100 μl elution buffer was then added to the column to elute the transcription factor–DNA complexes, which were subsequently denatured by incubation at 98°C. 95 μl of each sample was then added to each well of a 96-well plate containing an immobilized complementary sequence to 1 of the 47 transcription factors. The 96-well plate was sealed and incubated overnight at 42°C to hybridize the complementary strands of DNA. After hybridization, the plate was washed 3 times, streptavidin-HRP conjugate and substrate was added, and resulting chemiluminescence was detected using a multi-detection microplate reader (SpectraMax, Molecular Devices, Sunnyvale, CA).
AP-1/c-Jun ELISA assay
The nuclear fractions from the cells maintained in each culture condition were used to measure the AP-1 activity. AP-1 ELISA assay was performed using AP-1 activity assay kit (GeneCopoeia Inc., Rockville, MD) according to the manufacturer's protocol. Briefly, the 50 μg of nuclear fraction was mixed with transcription factor binding buffer supplied by the manufacturer and then applied to the each well of 96-well plate coated with oligo-DNA fragment containing consensus AP-1 binding sequence. After incubation for 1 hr at room temperature with gentle rocking, the wells were washed with 200 μL washing buffer supplied by manufacturer for 1 min with gentle rocking. After the final wash, 100 μL of diluted anti- AP-1 antibody (1:1000) solution was added to each well except the blank wells, and the plate was incubated for 1 hr at room temperature with gentle rocking. Each well was washed two more times using washing buffer and then incubated with 100 μL of diluted peroxidase-conjugated secondary antibody (1:1000) for 1 hr at room temperature with gentle rocking. After two washes, each well was then treated with chemiluminescence developing solution. After a 30 min incubation at room temperature with gentle agitation, protected from light, 100 μL of the stop solution was added to each well and absorbance was measured at a wavelength of 450 nm using a spectrophotometric plate reader. Nuclear extract of MCF-7 cells was also used as positive control for this assay.
Statistical Analysis
Significance of correlations was done using GraphPad Prism software. Unpaired t tests were used for all analyses assuming Gaussian populations with a 95% confidence interval. Data are presented as mean ± SE. Differences were analyzed with the Student t test, and significance was set at P less than <0.05. For in vivo testing xenograft models, criteria for defining an event (4 times the tumor volume at the start of treatment) were similar to that used by the Pediatric Preclinical Testing Program (29). Log-rank test was used to compare the time-to-event curves between groups.
Results
Sensitivity to JQ1 in vitro
To evaluate the sensitivity of RMS and EWS cell lines to JQ1 and JQ1R (inactive enantiomer), cells were incubated with or without drugs for 4 days, and viability was assessed by Alamar Blue staining (Table 1). Representative dose response curves are shown in Figure 1A. For most RMS cell lines the IC50 concentration was below 1 μM. Rh4 and Rh41 (derived from the same patient) were the most sensitive whereas cell lines Rh18 and Rh30 the IC50 concentration exceeded 10 μM. Ewing sarcoma cell lines showed a similar range of sensitivities as the RMS cell lines with ES-6 and EW-8 being less sensitive than other EWS cell lines. Flow cytometric analysis revealed significant changes in the cell-cycle distribution profile of EWS and RMS cells after exposure to JQ1(500 nM). The inactive enantiomer, JQ1R, did not inhibit proliferation of any cell line up to a concentration of 10μM. The treatment of cells with JQ1 resulted in an increase in the G0/G1 fraction and decreased S phase cell population, but there was no significant drug-induced sub-G1 population suggesting that the effect of JQ1 is largely cytostatic against these cell lines (Supplemental Figure 1).
Table 1.
Sensitivity of rhabdomyosarcoma and Ewing sarcoma cell lines to JQ1 and JQ1R.
| Cell Line | JQ1 IC50 | JQ1R IC50 |
|---|---|---|
| Mean ± SD (nM) | Mean ± SD (nM) | |
| Rhabdomyosarcoma | ||
| Rh3 | 390 ± 10 | >10,000 |
| Rh4 | 193 ± 15 | >10,000 |
| Rh5 | 163 ± 10 | >10,000 |
| Rh10 | 823 ± 153 | >10,000 |
| Rh18 | >10,000 ± 0 | >10,000 |
| Rh28 | 257 ± 49 | >10,000 |
| Rh30 | >10,000 ± 0 | >10,000 |
| Rh36 | 569 ± 49 | >10,000 |
| Rh41 | 377 ± 75 | >10,000 |
| Ewing sarcoma | ||
| ES-1 | 967 ± 289 | >10,000 |
| ES-2 | 527 ± 55 | >10,000 |
| ES-3 | 613 ± 109 | >10,000 |
| ES-4 | 533 ± 116 | >10,000 |
| ES-6 | 7966 ± 680 | >10,000 |
| ES-7 | 487 ± 8 | >10,000 |
| ES-8 | 700 ± 0 | >10,000 |
| EW-8 | >10,000 ± 0 | >10,000 |
| TC-71 | 630 ± 121 | >10,000 |
| CHLA258 | 4750 ± 289 | >10,000 |
Figure 1. JQ1 inhibits proliferation irrespective of c-MYC downregulation.

A. Representative concentration response curves for RMS (Rh41, Rh30) and EWS (ES-7, CHLA258) with greatest and least sensitivity to JQ1. Cells were exposed to JQ1 for 96 hr and stained with Calcein AB. Data are mean ± SD (n=3). Solid line, JQ1; broken line JQ1R. B. Levels of c-MYC and MYCN in RMS cell lines exposed, or not exposed to JQ1 (0.5 μM) for 24 hr. C. Levels of c-MYC and MYCN in EWS cell lines exposed, or not exposed to JQ1 (0.5 μM) for 24 hr. Samples were loaded in triplicate and GAPDH was used as a loading control.
Effect of JQ1 on MYC Expression in vitro
JQ1 potently inhibits Binding of a tetra-acetylated Histone H4 peptide to BRD4 with IC50 values of 77 nM and 33 nM for the first and second bromodomain, respectively (8) Thus, to examine whether JQ1 induced significant changes in MYC levels cells were incubated 24 hr with or without JQ1 (500 nM), and processed for immunoblotting for c-MYC and MYCN proteins. The results clearly indicated that JQ1 treatment reduced c-MYC in Rh4 and Rh41 cells, and MYCN was reduced in Rh5 cells (Figure 1B). For EWS cells, the highest endogenous levels of c-MYC were detected in ES-2 and ES-8 cells, where JQ1 did not decrease c-MYC (Figure 1C; immunoblots quantified in Supplemental Figure 2), although the lines were relatively sensitive to treatment (Table 1). Thus, there was no clear relationship between cellular sensitivity and suppression of c-MYC.
In vivo efficacy of JQ1
JQ1 treatment has shown antitumor activity against both genetically engineered models of human cancer, and against a range of human tumor xenografts. To determine the activity of JQ1 against childhood sarcoma xenografts, we used Rh10 and Rh28 models that in vitro are sensitive (IC50<1μM). The EW-5 model is one of relatively few patient derived EWS xenograft models available, hence of value to test for responsiveness to JQ1. No cell line from EW-5 has been established. The other model, EW-8, that in vitro is resistant to JQ1 was used to determine whether in vivo and in vitro drug sensitivity correlated. Drug was administered by oral gavage at 50 mg/kg daily for 21 days. As shown in Figure 2A JQ1 treatment retarded growth of each tumor line including EW-8. After stopping treatment (day 21) tumor growth resumed in all lines within one week returning to approximately the same rate of growth as the control tumors. JQ1 significantly inhibited growth of each tumor line relative to controls (P<0.0001 for Rh10 and Rh28; P=0.0044 and 0.0016 for EW-5 and EW-8, respectively). These results suggest that JQ1 is cytostatic during the period of treatment, and has minimal cytotoxicity in vivo. This is consistent with the rapid resumption of tumor growth at the end of treatment in these sarcoma models.
Figure 2.

JQ1 retards sarcoma growth and inhibits angiogenesis. A. Growth of sarcoma xenografts in treated (black lines) or untreated (gray lines) mice. The left panel depicts the mean relative tumor growth for control and treated tumors whereas the right graphs show individual tumor growth curves; B. Representative results of an angiogenesis array for Rh28 tumor extracts from untreated mice, or mice treated daily with JQ1 (50 mg/kg) for 14 days; specific angiogenic factors are indicated (colored boxes), correspond to the same factors on each array and are labeled accordingly; C. Quantitation of Rh28 assaying tumor-derived angiogenic factors extracted from tumors harvested from untreated mice (open bars), or mice treated daily with JQ1 (50 mg/kg) for 14 days (grey bars); D. Photomicrographs of CD34 IHC for Rh28 tumors in control or tumors harvested from mice after 7 or 14 days JQ1 treatment (magnification 20X. Higher resolution (417X magnification) are shown in Supplemental Figure 3); E. Quantitation of CD34-positive cell infiltration into Rh28 xenografts in control tumors or tumors harvested from JQ1 treated mice after 7 or 14 days. Data are mean ± SD (n=3 high power fields counted).
JQ1 Inhibits Angiogenesis in xenograft models
The antitumor activity of JQ1 was reminiscent of agents that suppress angiogenesis in these xenograft models (32–34). Further, the EW-8 xenograft responded equally to that of Rh28 xenografts whereas the respective cell lines were resistant (IC50 >10μM or sensitive IC50=0.26 μM, respectively), consistent with the drug acting indirectly on tumor growth. To examine the potential anti-angiogenic activity of JQ1, cohorts of mice (n=3) were treated for 7 or 14 days (50 mg/kg daily), and tumors harvested. Tumor tissue was harvested, and either angiogenic factors were extracted and assayed, or tumor tissue was fixed and CD34-positive vessels counted. As c-MYC promotes vascular and hematopoietic development, by functioning as a master regulator of various angiogenic factors (25), we also examined the levels of 55 angiogenesis-associate proteins using a human angiogenesis array. We analyzed the array data in all the four-xenograft tumors. Antibody array studies of the tumor lysates were derived from control and JQ1 tumors following 14 days treatment. As shown for Rh28 xenografts harvested after 14 days JQ1 treatment (Figure 2B), the levels of angiogenic factors were significantly lower in treated tumor than in control tumors (Figure 2C). Immunohistochemical staining for CD34 positive cells showed minimal effects after 7 days treatment, but a significant reduction in CD34-positivity by day 14 in Rh28 xenografts (Figures 2D and E). Similar results were obtained for rhabdomyosarocmas Rh10, and Rh28 (Supplemental Figure 3), and EW-5 and EW-8 Ewing sarcoma xenograft models (Supplemental Figure 4). These data suggest that in part, JQ1 suppresses tumor growth through downregulation of tumor-derived angiogenic factors. Relative to control xenograft tumors, JQ1 treated tumors showed a significant decrease of VEGF, Angiopoietin, tissue factor (TF) and FGF-1, critical regulators of angiogenesis (Supplemental Figure 5).
JQ1 directly inhibits angiogenesis in vivo
To directly test the antiangiogenic activity of JQ1 in vivo independent of drug action on tumor, mice were implanted subcutaneously with Matrigel plugs infused with PBS or VEGF165. Mice were treated with JQ1 (50 mg/kg) administered by oral administration immediately after implantation of the plug and daily for 7 days. Plugs were excised at day 7 and angiogenesis quantified as described in the Materials and Methods. VEGF165 increased the number of vessels detected in Matrigel plugs by more than 10-fold over that in PBS-infused (control) plugs. There was significant reduction in vessel formation in the treated group as compared with controls (Figure 3). For the hemoglobin assay, the results are expressed as mg/dl of hemoglobin per gram of Matrigel. The hemoglobin content correlates with the extent of angiogenesis in this assay. Comparison of the hemoglobin values for the Matrigel plugs from the untreated control animals at 7 days after implantation versus the values for the JQ1 treated animals (Figure 3) supports the CD34 staining results confirming JQ1 has the ability to substantially inhibit VEGF-driven angiogenesis in vivo.
Figure 3.
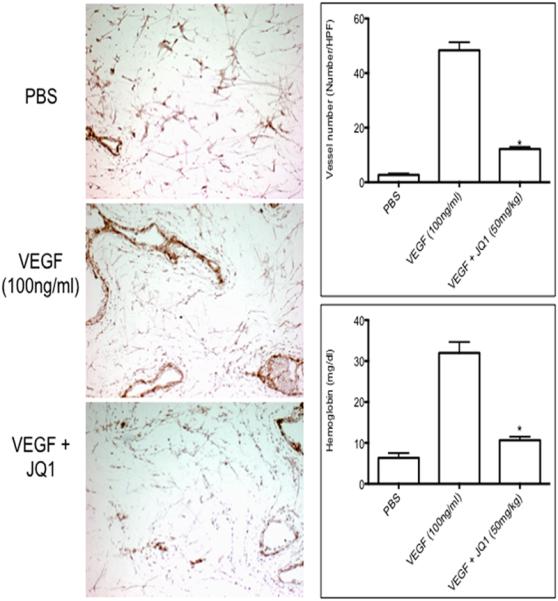
JQ1 directly inhibits angiogenesis in vivo.. Invasion of CD34-positive cells into VEGF-infused Matrigel plugs. Matrigel plugs were implanted subcutaneously in CB17 scid mice, that received no treatment (control) or JQ1 (50 mg/kg) daily for 7 days. On day 7 plugs were removed, and processed as described in Materials and Methods. Left panels show representative IHC for CD34 staining. Right panels show quantitation of CD34 staining (upper) and hemoglobin content of the Matrigel plugs (lower) from control and treated mice. The numbers of CD34-positive vessels per high-power field (magnification, 200×) were counted for each experimental condition. Results are mean ± SD (n = 5) *, P < 0.05 versus VEGF alone. Hemoglobin content of Matrigel plugs as determined by the Drabkin's method.
JQ1 inhibits HUVEC tube formation and proliferation and invasion in vitro
We next examined whether JQ1 could inhibit VEGF165–induced tube formation of HUVECs, focusing on a drug concentration range from 0.25 – 2 μM. HUVECs were stimulated with VEGF165 (10 ng/mL) on Matrigel to form tubes in the absence or presence of JQ1 (Figure 4A). Reduction in tube formation by JQ1 was concentration-dependent, reaching statistical significance at 1 μM, although there was clear effect at 500 nM. JQ1 (500 nM) also inhibited endothelial cell invasion whereas the inactive enantiomer (JQ1R) had no effect (Figure 4B,C). To examine the impact of JQ1 on proliferation, HUVEC cells were stimulated with VEGF165 in the absence or presence of JQ1 and cell number determined by Alamar Blue staining after 2 days. As shown in Figure 4D, JQ1 inhibited proliferation in a concentration-dependent manner with 70% or more inhibition at 2 μM. The inactive enantiomer, JQ1R also had no effect on either tube formation or cell proliferation at concentrations up to 2 μM (data not shown). To characterize the direct effect of JQ1 in endothelial cells we assessed secreted angiogenesis factors by angiogenesis array in HUVECs with or without JQ1 treatment (500 nM/24 hr). Even at concentrations of JQ1 that had little effect on HUVEC proliferation (0.5 μM) secretion of angiogenic factors was decreased. Interestingly TGF-β, TIMP, Ang1, angiostatin and endothelin levels were significantly reduced as was noted following treatment of sarcoma xenografts with JQ1 (Supplemental Figure 5).
Figure 4.
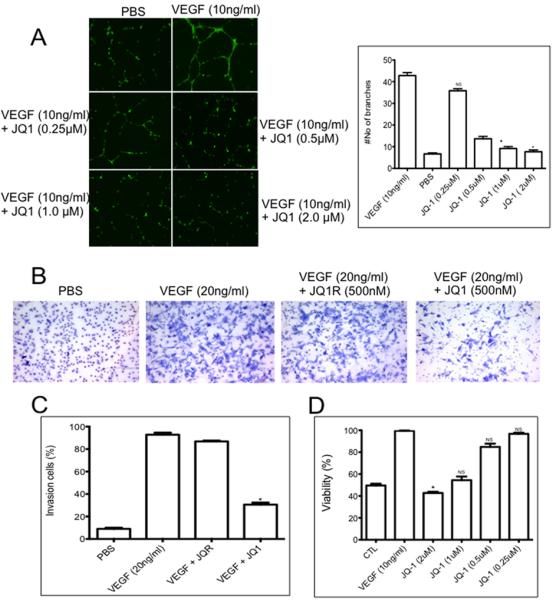
JQ1 suppresses HUVEC differentiation in vitro. A. HUVECs were grown under serum-deficient conditions and stimulated with PBS or VEGF (10 ng/mL) in the absence or presence of JQ1 (0.25, 0.5 1 and 2 μM). Tube formation was determined after 12–18 hr. The photomicrograph shows representative microscope fields; right panel show quantitation of data. * indicates statistical difference (P<0.05) between VEGF-stimulated HUVEC angiogenesis and JQ1 treated HUVEC angiogenesis in the presence of VEGF; B. JQ1 inhibits vascular endothelial cell invasion. Assays were conducted as described in Materials and Methods. Photomicrographs show representative invasion through membranes using PBS as the chemo-attractant, or serum in the absence or presence of JQ1 (0.5 μM) or the inactive enantiomer JQ1R (0.5 μM); C. Quantitation of data from B (mean ± SD, n=3). * indicates statistical difference (P<0.05) between VEGF-stimulated HUVEC invasion and JQ1 treated HUVEC invasion in the presence of VEGF D. JQ1 inhibits HUVEC proliferation. HUVECs were stimulated with VEGF (10 ng/ml) in the presence or absence of JQ1 at increasing concentration. Cells were enumerated after 48 hr. * indicates statistical difference (P<0.05) between VEGF-stimulated HUVEC proliferation and JQ1 treated HUVEC proliferation in the presence of VEGF. Data are mean ± SD (n=3). NS, no significant difference from VEGF-stimulated controls.
Involvement of AP-1 in the inhibition of cMYC by JQ1 in Endothelial cells
It has been proposed that BET inhibitors may exert context specific effects that could be independent of c-MYC (22). Using transcription factor arrays we examined the levels of 47 transcription factor in HUVECs treated or not treated with JQ1 (3 μM/24 hr). As shown in Figure 5A, levels of AP-1 were high in HUVECs, but dramatically downregulated within 24 hr. Other transcription factors were expressed at lower levels, but all were decreased by JQ1 treatment. To assay AP-1 activity, nuclear fractions from JQ1 treated or untreated HUVECs were prepared and an AP-1 ELISA assay was performed using AP-1 activity assay kit as described in Materials and Methods. AP1/c-Jun activity was reduced >80% in treated cells compared to control HUVECs (Figure 5B).
Figure 5.
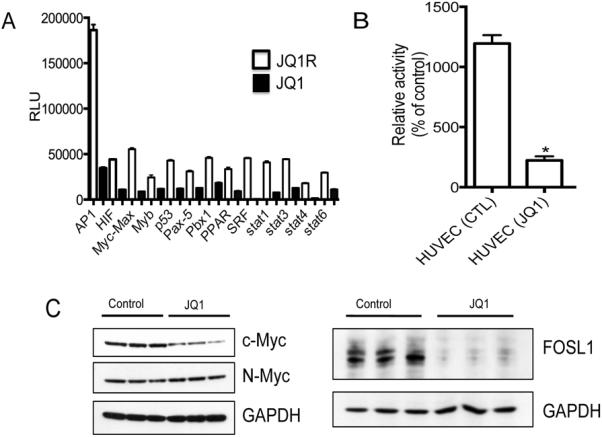
JQ1 suppresses multiple transcription factors in HUVECs. A. Equal quantities of nuclear extract from control of JQ1 or JQ1R treated (3 μM, 24 hr) HUVEC cultures were assayed as described in Materials and Methods; B. AP-1 activity in nuclear extracts from control and JQ1 treated HUVEC cultures; C. JQ1 (0.5 μM) suppresses c-MYC in HUVEC cultures. HUVECs were stimulated with VEGF in the absence or presence of JQ1 and harvested after 24 hr. c-MYC was determined by western blotting; D. JQ1 (0.5 μM) suppresses FOSL1. Conditions similar to those in C. GAPDH was used as a loading control. Each sample is run in triplicate.
The JQ1 sensitivity of lung adenocarcinoma cells has previously been related to drug-induced decrease in the AP-1 component FOSL1, and not to decreased c-MYC (22). As shown in Figure 5C, JQ1 treatment only slightly decreased c-MYC levels in HUVECs, however it had a far greater effect on suppressing FOSL1, Figure 5D.
Discussion
The bromodomain and extra terminal domain (BET) family of proteins function as readers that associate with acetylated histones and regulate assembly of chromatin complexes and transcription activators at specific promoter sites. Recently, BETs have been shown to control genes involved in a number of cellular processes including cell cycle, as well as pathologic states such as inflammation and cancer, possibly by regulating transcription from specific promoters in a cell context specific manner (35–38). JQ1, one of many inhibitors of BET proteins, has marked antitumor activity against several hematologic malignancies (8, 38–41). JQ1 has also been shown to impair tumor growth in models relevant to childhood solid malignancies including a genetically engineered neuroblastoma mouse model, and to a lesser extent against patient derived neuroblastoma xenografts and a c-MYC-driven medulloblastoma (13). Here, we evaluated JQ1 against rhabdomyosarcoma and Ewing sarcoma cell lines and xenografts derived from childhood patients. JQ1 clearly downregulated c-MYC (Rh4, Rh41) and MYCN (Rh5), cell lines sensitive to JQ1, while c-MYC levels were low in Rh18 and Rh30 cells that were intrinsically resistant to drug (IC50>10μM). In contrast there was only slight downregulation of c-MYC in Rh36 cells sensitive to JQ1, and in EWS cell lines that had similar sensitivity to JQ1 as Rh36. Thus, there was no clear relationship between suppression of c-MYC and tumor cell sensitivity. These data are concordant with those generated in lung adenocarcinoma cell lines treated with JQ1 (22), and several other studies suggesting that the antitumor activity of JQ1 is independent of its ability to suppress MYC (21, 42, 43). Of note, for most Ewing sarcoma and rhabdomyosarcoma cell lines used in the current study, the IC50 concentrations were < 1μM, whereas the in vitro sensitivity of osteosarcoma cell lines reported by Lee et al (24) was considerably greater with 4 of 7 lines having IC50 values > 5μM (range 0.83–24.25μM).
We next evaluated JQ1 against four xenograft models generated from cell lines including Rh28 (the most sensitive line), and EW-8 (a cell line intrinsically resistant to JQ1). Tumor responses were characterized by slowing of progression with relatively static growth during the period of drug treatment, followed by rapid resumption of tumor growth after discontinuation of treatment. Thus, similar to other reports, the antitumor activity of JQ1 against solid tumors is relatively modest, with slowing of tumor growth without tumor regression (21, 43, 44). This pattern of retarding tumor progression with rapid resumption of tumor growth at the end of treatment is similar to the growth inhibition patterns of antiangiogenic agents we have previously tested (32, 34, 45), and similar to the activity of JQ1 against c-MYC-driven medulloblastoma (13). Further, given that growth of tumor xenografts generated from both sensitive and resistant cell lines was equally impacted by JQ1 treatment in vivo, JQ1 was likely impacting tumor growth through an indirect mechanism.
Although JQ1 modulates tumor growth of in several different models, a direct effect upon tumor angiogenesis has not been previously reported. As the angiogenesis arrays are specific for detecting human proteins, our data suggest that JQ1 suppresses tumor-derived angiogenic factors, and has direct effects on vascular endothelial cells both in mice and in vitro. Examination of xenograft tissue harvested from mice treated for 14 days with JQ1 showed a marked decrease in CD34-positive cell infiltration indicating reduced vascular development. In support of this, assay of tumor-associated angiogenic factors showed a significant decrease of Serpin F1, and VEGF in all tumor models. Of note, cross-reactivity for mouse-derived vegf in the array is <5 per cent, thus JQ1 treatment decreases tumor-derived VEGF. Consistent decreases (3 of 4 tumor models) of IGFBPs, FGF2, endothelin 1 were determined, whereas TGF-β1 was decreased in two models only. A direct effect on JQ1 blocking angiogenesis was demonstrated by inhibition of vascularization of VEGF165-infused Matrigel plugs implanted subcutaneously in mice. In this 7-day assay, JQ1 significantly decreased invasion of CD34-positive cells indicating a direct effect on murine vascular endothelial cells. It is of interest that in this Matrigel assay JQ1 significantly reduced angiogenesis, whereas in the tumor experiments there was no decreased vascularization at day 7, but a significant decrease from control levels by day 14. This may indicate that in tumors the effect of JQ1 suppressing angiogenic factors may require several days and that during that time tumor cells are still able to induce infiltration of vascular elements. Furthermore, despite the reduced vascularity, JQ1 did not cause a decrease in KI67 staining in tumor tissue from rhabdomyosarcoma xenografts (Supplemental Figure 6), or Ewing sarcoma xenografts (Supplemental Figure 7), again suggesting that its antitumor activity is a consequence of effects on angiogenesis.
To examine the mechanism of JQ1 activity in vitro, we used HUVECs as a model system. JQ1 treatment reduced HUVEC tube formation at 0.5 μM, whereas significant inhibition of proliferation required a higher concentration (2 μM); JQ1 (at 3 μM) also reduced invasion of endothelial cells. Treatment of HUVECs also led to decreased levels of VEGF, TIMP endothelin 1 and TGF-β1. Because inhibition of BRD4 and possibly other BET proteins may have pleiotropic effects, we surveyed levels of transcription factors that were altered by JQ1 treatment in HUVECs. Although MYC-MAX was decreased significantly, most notable was the dramatic decrease in AP1 levels and activity. AP1 has been implicated in regulating VEGFD, uPA, uPAR and proliferin through c-FOS, FRA1 and c-JUN or JUNB, respectively (46–48). AP-1 also regulates invasiveness (49), consistent with the observation that AP-1 activity is suppressed by JQ1 in HUVECs. JQ1 treatment of HUVECs did reduce levels of c-MYC, however, levels of FOSL1, an AP-1-associated protein were completely suppressed, consistent with previous reports of JQ1 activity in lung cancer cells (22), and osteosarcoma cell lines (43). However, these results are in contrast to those of Zhou et al. (21) who reported that TNF-α-induced expression of c-JUN, activated downstream of AP-1 was not inhibited by JQ1 in A549 cells. Of note, FOSL1 was not detected in any of the sarcoma cell lines used in the present study. Exactly how JQ1 suppresses angiogenesis remains to be determined, although BRD4 is a positive regulatory component of P-TEFb (50) and an inhibitor of P-TEFb suppresses angiogenesis (51). Further VEGFA is listed as a super-enhancer-associated actively transcribed gene in the GBM cell line U-87 and the SCLC cell line H2171 (9).
In summary, our results indicate that in sarcoma xenograft models of childhood cancer, JQ1 significantly suppresses tumor progression, but does not induce tumor regression. The results are consistent with an anti-angiogenic effect mediated by suppression of tumor-derived angiogenic factors, and a direct effect on vascular endothelial cells. This is the first description of a role for JQ1 as an antiangiogenic drug. Our data suggest BET inhibitors may hold promise as an antiangiogenic agents in pediatric sarcoma potentially overcoming resistance to existing antiangiogenic therapies, although their ultimate role may be in combination with cytotoxic or molecular targeted agents.
Supplementary Material
Acknowledgements
We thank the Technical Services Department at Bio-Techne, Minneapolis, MN for determining the cross-reactivity between human and mouse VEGF on the angiogenesis arrays.
This work was supported by CA165995 (to P.J. Houghton) from the National Cancer Institute, and through an award from the Sarcoma Alliance for Research through Collaboration (SARC) to (to P.J. Houghton).
Footnotes
Conflict of Interest Statement. The authors have no actual of perceived conflicts to report.
References
- 1.Dias P, Kumar P, Marsden HB, Gattamaneni HR, Heighway J, Kumar S. N-myc gene is amplified in alveolar rhabdomyosarcomas (RMS) but not in embryonal RMS. International journal of cancer Journal international du cancer. 1990;45:593–6. doi: 10.1002/ijc.2910450403. [DOI] [PubMed] [Google Scholar]
- 2.Dias P, Kumar P, Marsden HB, Gattamaneni HR, Kumar S. N- and c-myc oncogenes in childhood rhabdomyosarcoma. Journal of the National Cancer Institute. 1990;82:151. doi: 10.1093/jnci/82.2.151. [DOI] [PubMed] [Google Scholar]
- 3.Kouraklis G, Triche TJ, Wesley R, Tsokos M. Myc oncogene expression and nude mouse tumorigenicity and metastasis formation are higher in alveolar than embryonal rhabdomyosarcoma cell lines. Pediatric research. 1999;45:552–8. doi: 10.1203/00006450-199904010-00015. [DOI] [PubMed] [Google Scholar]
- 4.Barrios C, Castresana JS, Falkmer UG, Rosendahl I, Kreicbergs A. c-myc oncogene amplification and cytometric DNA ploidy pattern as prognostic factors in musculoskeletal neoplasms. International journal of cancer Journal international du cancer. 1994;58:781–6. doi: 10.1002/ijc.2910580605. [DOI] [PubMed] [Google Scholar]
- 5.Sollazzo MR, Benassi MS, Magagnoli G, Gamberi G, Molendini L, Ragazzini P, et al. Increased c-myc oncogene expression in Ewing's sarcoma: correlation with Ki67 proliferation index. Tumori. 1999;85:167–73. doi: 10.1177/030089169908500304. [DOI] [PubMed] [Google Scholar]
- 6.Dauphinot L, De Oliveira C, Melot T, Sevenet N, Thomas V, Weissman BE, et al. Analysis of the expression of cell cycle regulators in Ewing cell lines: EWS-FLI-1 modulates p57KIP2 and c-Myc expression. Oncogene. 2001;20:3258–65. doi: 10.1038/sj.onc.1204437. [DOI] [PubMed] [Google Scholar]
- 7.Bailly RA, Bosselut R, Zucman J, Cormier F, Delattre O, Roussel M, et al. DNA-binding and transcriptional activation properties of the EWS-FLI-1 fusion protein resulting from the t(11;22) translocation in Ewing sarcoma. Molecular and cellular biology. 1994;14:3230–41. doi: 10.1128/mcb.14.5.3230. [DOI] [PMC free article] [PubMed] [Google Scholar]
- 8.Filippakopoulos P, Qi J, Picaud S, Shen Y, Smith WB, Fedorov O, et al. Selective inhibition of BET bromodomains. Nature. 2010;468:1067–73. doi: 10.1038/nature09504. [DOI] [PMC free article] [PubMed] [Google Scholar]
- 9.Loven J, Hoke HA, Lin CY, Lau A, Orlando DA, Vakoc CR, et al. Selective inhibition of tumor oncogenes by disruption of super-enhancers. Cell. 2013;153:320–34. doi: 10.1016/j.cell.2013.03.036. [DOI] [PMC free article] [PubMed] [Google Scholar]
- 10.Chaidos A, Caputo V, Gouvedenou K, Liu B, Marigo I, Chaudhry MS, et al. Potent antimyeloma activity of the novel bromodomain inhibitors I-BET151 and I-BET762. Blood. 2014;123:697–705. doi: 10.1182/blood-2013-01-478420. [DOI] [PubMed] [Google Scholar]
- 11.Chaidos A, Caputo V, Karadimitris A. Therapeutic Advances in Hematology. 2015. Inhibition of bromodomain and extra-terminal proteins (BET) as a potential therapeutic approach in haematological malignancies: emerging preclinical and clinical evidence. 2040620715576662. [DOI] [PMC free article] [PubMed] [Google Scholar]
- 12.Puissant A, Frumm SM, Alexe G, Bassil CF, Qi J, Chanthery YH, et al. Targeting MYCN in neuroblastoma by BET bromodomain inhibition. Cancer discovery. 2013;3:308–23. doi: 10.1158/2159-8290.CD-12-0418. [DOI] [PMC free article] [PubMed] [Google Scholar]
- 13.Venkataraman S, Alimova I, Balakrishnan I, Harris P, Birks DK, Griesinger A, et al. Inhibition of BRD4 attenuates tumor cell self-renewal and suppresses stem cell signaling in MYC driven medulloblastoma. Oncotarget. 2014;5:2355–71. doi: 10.18632/oncotarget.1659. [DOI] [PMC free article] [PubMed] [Google Scholar]
- 14.Baratta MG, Schinzel AC, Zwang Y, Bandopadhayay P, Bowman-Colin C, Kutt J, et al. An in-tumor genetic screen reveals that the BET bromodomain protein, BRD4, is a potential therapeutic target in ovarian carcinoma. Proceedings of the National Academy of Sciences of the United States of America. 2015;112:232–7. doi: 10.1073/pnas.1422165112. [DOI] [PMC free article] [PubMed] [Google Scholar]
- 15.Kumar K, Raza SS, Knab LM, Chow CR, Kwok B, Bentrem DJ, et al. GLI2-dependent c-MYC upregulation mediates resistance of pancreatic cancer cells to the BET bromodomain inhibitor JQ1. Scientific reports. 2015;5:9489. doi: 10.1038/srep09489. [DOI] [PMC free article] [PubMed] [Google Scholar]
- 16.Qiu H, Jackson AL, Kilgore JE, Zhong Y, Chan LL, Gehrig PA, et al. JQ1 suppresses tumor growth through downregulating LDHA in ovarian cancer. Oncotarget. 2015;6:6915–30. doi: 10.18632/oncotarget.3126. [DOI] [PMC free article] [PubMed] [Google Scholar] [Retracted]
- 17.Sengupta S, Biarnes MC, Clarke R, Jordan VC. Inhibition of BET proteins impairs estrogen-mediated growth and transcription in breast cancers by pausing RNA polymerase advancement. Breast cancer research and treatment. 2015;150:265–78. doi: 10.1007/s10549-015-3319-1. [DOI] [PMC free article] [PubMed] [Google Scholar]
- 18.Chan SC, Selth LA, Li Y, Nyquist MD, Miao L, Bradner JE, et al. Nucleic acids research. 2015. Targeting chromatin binding regulation of constitutively active AR variants to overcome prostate cancer resistance to endocrine-based therapies. [DOI] [PMC free article] [PubMed] [Google Scholar]
- 19.Ceribelli M, Kelly PN, Shaffer AL, Wright GW, Xiao W, Yang Y, et al. Blockade of oncogenic IkappaB kinase activity in diffuse large B-cell lymphoma by bromodomain and extraterminal domain protein inhibitors. Proceedings of the National Academy of Sciences of the United States of America. 2014;111:11365–70. doi: 10.1073/pnas.1411701111. [DOI] [PMC free article] [PubMed] [Google Scholar]
- 20.Trabucco SE, Gerstein RM, Evens AM, Bradner JE, Shultz LD, Greiner DL, et al. Inhibition of bromodomain proteins for the treatment of human diffuse large B-cell lymphoma. Clinical cancer research : an official journal of the American Association for Cancer Research. 2015;21:113–22. doi: 10.1158/1078-0432.CCR-13-3346. [DOI] [PMC free article] [PubMed] [Google Scholar]
- 21.Zou Z, Huang B, Wu X, Zhang H, Qi J, Bradner J, et al. Brd4 maintains constitutively active NF-kappaB in cancer cells by binding to acetylated RelA. Oncogene. 2014;33:2395–404. doi: 10.1038/onc.2013.179. [DOI] [PMC free article] [PubMed] [Google Scholar]
- 22.Lockwood WW, Zejnullahu K, Bradner JE, Varmus H. Sensitivity of human lung adenocarcinoma cell lines to targeted inhibition of BET epigenetic signaling proteins. Proceedings of the National Academy of Sciences of the United States of America. 2012;109:19408–13. doi: 10.1073/pnas.1216363109. [DOI] [PMC free article] [PubMed] [Google Scholar]
- 23.Lamoureux F, Baud'huin M, Rodriguez Calleja L, Jacques C, Berreur M, Redini F, et al. Selective inhibition of BET bromodomain epigenetic signalling interferes with the bone-associated tumour vicious cycle. Nature communications. 2014;5:3511. doi: 10.1038/ncomms4511. [DOI] [PubMed] [Google Scholar]
- 24.Lee DH, Qi J, Bradner JE, Said JW, Doan NB, Forscher C, et al. Synergistic effect of JQ1 and rapamycin for treatment of human osteosarcoma. International journal of cancer Journal international du cancer. 2015;136:2055–64. doi: 10.1002/ijc.29269. [DOI] [PMC free article] [PubMed] [Google Scholar]
- 25.Baudino TA, McKay C, Pendeville-Samain H, Nilsson JA, Maclean KH, White EL, et al. c-Myc is essential for vasculogenesis and angiogenesis during development and tumor progression. Genes & development. 2002;16:2530–43. doi: 10.1101/gad.1024602. [DOI] [PMC free article] [PubMed] [Google Scholar]
- 26.Tikhonenko AT, Black DJ, Linial ML. Viral Myc oncoproteins in infected fibroblasts down-modulate thrombospondin-1, a possible tumor suppressor gene. The Journal of biological chemistry. 1996;271:30741–7. doi: 10.1074/jbc.271.48.30741. [DOI] [PubMed] [Google Scholar]
- 27.Kerbel RS, Viloria-Petit A, Okada F, Rak J. Establishing a link between oncogenes and tumor angiogenesis. Molecular medicine. 1998;4:286–95. [PMC free article] [PubMed] [Google Scholar]
- 28.Pelengaris S, Khan M, Evan GI. Suppression of Myc-induced apoptosis in beta cells exposes multiple oncogenic properties of Myc and triggers carcinogenic progression. Cell. 2002;109:321–34. doi: 10.1016/s0092-8674(02)00738-9. [DOI] [PubMed] [Google Scholar]
- 29.Houghton PJ, Morton CL, Tucker C, Payne D, Favours E, Cole C, et al. The pediatric preclinical testing program: description of models and early testing results. Pediatric blood & cancer. 2007;49:928–40. doi: 10.1002/pbc.21078. [DOI] [PubMed] [Google Scholar]
- 30.Bid HK, Oswald D, Li C, London CA, Lin J, Houghton PJ. Anti-angiogenic activity of a small molecule STAT3 inhibitor LLL12. PloS one. 2012;7:e35513. doi: 10.1371/journal.pone.0035513. [DOI] [PMC free article] [PubMed] [Google Scholar]
- 31.Bid HK, Zhan J, Phelps DA, Kurmasheva RT, Houghton PJ. Potent inhibition of angiogenesis by the IGF-1 receptor-targeting antibody SCH717454 is reversed by IGF-2. Molecular cancer therapeutics. 2012;11:649–59. doi: 10.1158/1535-7163.MCT-11-0575. [DOI] [PMC free article] [PubMed] [Google Scholar]
- 32.Keir ST, Maris JM, Lock R, Kolb EA, Gorlick R, Carol H, et al. Initial testing (stage 1) of the multi-targeted kinase inhibitor sorafenib by the pediatric preclinical testing program. Pediatric blood & cancer. 2010;55:1126–33. doi: 10.1002/pbc.22712. [DOI] [PMC free article] [PubMed] [Google Scholar]
- 33.Gorlick R, Kolb EA, Houghton PJ, Morton CL, Phelps D, Schaiquevich P, et al. Initial testing (stage 1) of lapatinib by the pediatric preclinical testing program. Pediatric blood & cancer. 2009;53:594–8. doi: 10.1002/pbc.21989. [DOI] [PMC free article] [PubMed] [Google Scholar]
- 34.Maris JM, Courtright J, Houghton PJ, Morton CL, Gorlick R, Kolb EA, et al. Initial testing of the VEGFR inhibitor AZD2171 by the pediatric preclinical testing program. Pediatric blood & cancer. 2008;50:581–7. doi: 10.1002/pbc.21232. [DOI] [PubMed] [Google Scholar]
- 35.Dey A, Nishiyama A, Karpova T, McNally J, Ozato K. Brd4 marks select genes on mitotic chromatin and directs postmitotic transcription. Molecular biology of the cell. 2009;20:4899–909. doi: 10.1091/mbc.E09-05-0380. [DOI] [PMC free article] [PubMed] [Google Scholar]
- 36.LeRoy G, Rickards B, Flint SJ. The double bromodomain proteins Brd2 and Brd3 couple histone acetylation to transcription. Molecular cell. 2008;30:51–60. doi: 10.1016/j.molcel.2008.01.018. [DOI] [PMC free article] [PubMed] [Google Scholar]
- 37.Nicodeme E, Jeffrey KL, Schaefer U, Beinke S, Dewell S, Chung CW, et al. Suppression of inflammation by a synthetic histone mimic. Nature. 2010;468:1119–23. doi: 10.1038/nature09589. [DOI] [PMC free article] [PubMed] [Google Scholar]
- 38.Delmore JE, Issa GC, Lemieux ME, Rahl PB, Shi J, Jacobs HM, et al. BET bromodomain inhibition as a therapeutic strategy to target c-Myc. Cell. 2011;146:904–17. doi: 10.1016/j.cell.2011.08.017. [DOI] [PMC free article] [PubMed] [Google Scholar]
- 39.Zuber J, Shi J, Wang E, Rappaport AR, Herrmann H, Sison EA, et al. RNAi screen identifies Brd4 as a therapeutic target in acute myeloid leukaemia. Nature. 2011;478:524–8. doi: 10.1038/nature10334. [DOI] [PMC free article] [PubMed] [Google Scholar]
- 40.Dawson MA, Prinjha RK, Dittmann A, Giotopoulos G, Bantscheff M, Chan WI, et al. Inhibition of BET recruitment to chromatin as an effective treatment for MLL-fusion leukaemia. Nature. 2011;478:529–33. doi: 10.1038/nature10509. [DOI] [PMC free article] [PubMed] [Google Scholar]
- 41.Mertz JA, Conery AR, Bryant BM, Sandy P, Balasubramanian S, Mele DA, et al. Targeting MYC dependence in cancer by inhibiting BET bromodomains. Proceedings of the National Academy of Sciences of the United States of America. 2011;108:16669–74. doi: 10.1073/pnas.1108190108. [DOI] [PMC free article] [PubMed] [Google Scholar]
- 42.Brondfield S, Umesh S, Corella A, Zuber J, Rappaport AR, Gaillard C, et al. Cancer chemotherapy and pharmacology. 2015. Direct and indirect targeting of MYC to treat acute myeloid leukemia. [DOI] [PMC free article] [PubMed] [Google Scholar]
- 43.Baker EK, Taylor S, Gupte A, Sharp PP, Walia M, Walsh NC, et al. BET inhibitors induce apoptosis through a MYC independent mechanism and synergise with CDK inhibitors to kill osteosarcoma cells. Scientific reports. 2015;5:10120. doi: 10.1038/srep10120. [DOI] [PMC free article] [PubMed] [Google Scholar]
- 44.Garcia PL, Miller AL, Kreitzburg KM, Council LN, Gamblin TL, Christein JD, et al. The BET bromodomain inhibitor JQ1 suppresses growth of pancreatic ductal adenocarcinoma in patient-derived xenograft models. Oncogene. 2015 doi: 10.1038/onc.2015.126. [DOI] [PMC free article] [PubMed] [Google Scholar]
- 45.Maris JM, Courtright J, Houghton PJ, Morton CL, Kolb EA, Lock R, et al. Initial testing (stage 1) of sunitinib by the pediatric preclinical testing program. Pediatric blood & cancer. 2008;51:42–8. doi: 10.1002/pbc.21535. [DOI] [PubMed] [Google Scholar]
- 46.Marconcini L, Marchio S, Morbidelli L, Cartocci E, Albini A, Ziche M, et al. c-fos-induced growth factor/vascular endothelial growth factor D induces angiogenesis in vivo and in vitro. Proceedings of the National Academy of Sciences of the United States of America. 1999;96:9671–6. doi: 10.1073/pnas.96.17.9671. [DOI] [PMC free article] [PubMed] [Google Scholar]
- 47.Kustikova O, Kramerov D, Grigorian M, Berezin V, Bock E, Lukanidin E, et al. Fra-1 induces morphological transformation and increases in vitro invasiveness and motility of epithelioid adenocarcinoma cells. Molecular and cellular biology. 1998;18:7095–105. doi: 10.1128/mcb.18.12.7095. [DOI] [PMC free article] [PubMed] [Google Scholar]
- 48.Toft DJ, Rosenberg SB, Bergers G, Volpert O, Linzer DI. Reactivation of proliferin gene expression is associated with increased angiogenesis in a cell culture model of fibrosarcoma tumor progression. Proceedings of the National Academy of Sciences of the United States of America. 2001;98:13055–9. doi: 10.1073/pnas.231364798. [DOI] [PMC free article] [PubMed] [Google Scholar]
- 49.Eferl R, Wagner EF. AP-1: a double-edged sword in tumorigenesis. Nature reviews Cancer. 2003;3:859–68. doi: 10.1038/nrc1209. [DOI] [PubMed] [Google Scholar]
- 50.Jang MK, Mochizuki K, Zhou M, Jeong HS, Brady JN, Ozato K. The bromodomain protein Brd4 is a positive regulatory component of P-TEFb and stimulates RNA polymerase II-dependent transcription. Molecular cell. 2005;19:523–34. doi: 10.1016/j.molcel.2005.06.027. [DOI] [PubMed] [Google Scholar]
- 51.Krystof V, Rarova L, Liebl J, Zahler S, Jorda R, Voller J, et al. The selective P-TEFb inhibitor CAN508 targets angiogenesis. European journal of medicinal chemistry. 2011;46:4289–94. doi: 10.1016/j.ejmech.2011.06.035. [DOI] [PubMed] [Google Scholar]
Associated Data
This section collects any data citations, data availability statements, or supplementary materials included in this article.