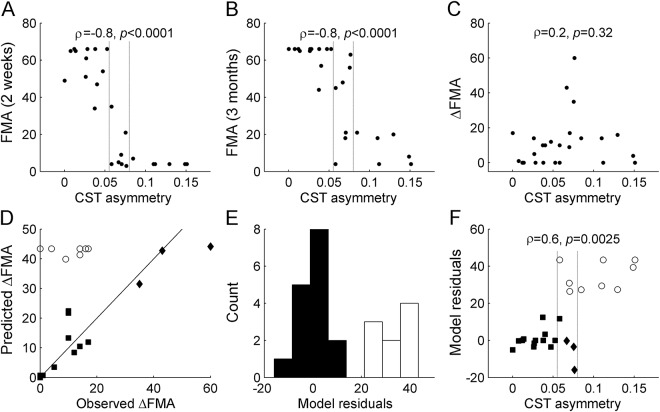
Figure 1. Fugl-Meyer assessment (FMA) and diffusion tensor imaging (DTI) predictors of motor improvement.
Corticospinal tract (CST) asymmetry at 2 weeks correlated with the severity of motor deficits at (A) 2 weeks and (B) 3 months after stroke, but not with (C) the change between these 2 time points. (D) The model ΔFMA = 0.7*(66-FMAintial), represented by a continuous line, predicted future FMA improvement in most patients (filled symbols), but there was a significant recovery-atypical subset (n = 9; unfilled circles). (E) Recovery-atypical patients were defined as cases with model residuals >20 (unfilled bars). (F) CST asymmetry was linearly associated with the residuals of the FMA-based model, and accurately discriminated between recovery-typical and recovery-atypical patients. Dashed vertical lines indicate cutoffs for 100% positive and negative predictive values, respectively.

