Abstract
Differing stimuli affect cell-stiffness while cancer metastasis further relates to cell-stiffness. Cell-stiffness determined by atomic Force Microscopy (AFM) has been limited by measurement over nuclei to avoid spurious substratum effects in thin cytoplasmic domains, and we sought to develop a more complete approach including cytoplasmic areas. 90 μm square fields were recorded from 10 sites of cultured Human Dermal Fibroblasts (HDF), and 3 sites each for melanoma (MM39, WM175, MeIRMu), osteosarcoma (SAOS-2, U2OS), and ovarian carcinoma (COLO316, PEO4) cell lines, each site providing 1,024 measurements as 32x32 square grids. Stiffness recorded below 0.8 μm height was occasionally influenced by substratum, so only stiffness recorded above 0.8 μm was analyzed, but all sites were included for height and volume analysis. COLO316 had the lowest cell height and volume, followed by HDF (p<0.0001), and then PEO4, SAOS-2, MeIRMu, WM175, U2OS, and MM39. HDF were more stiff than all other cells (p < 0.0001), while in descending order of stiffness were PEO4, COLO316, WM175, SAOS-2, U2OS, MM39, and MeIRMu (p < 0.02). Stiffness-fingerprints comprised scattergrams of stiffness values plotted against the height at which each stiffness value was recorded, and appeared unique for each cell type studied, although in most cases the overall form of fingerprints was similar, with maximum stiffness at low height measurements and a second lower peak occurring at high height levels. We suggest our stiffness-fingerprint analytical method provides a more nuanced description than previously reported, and will facilitate study of the stiffness response to cell stimulation.
Keywords: Cell-stiffness, Atomic Force Microscopy, Scanning Strategy, Cancer Cells, Fibroblasts
Introduction
Cancer cells have lower stiffness compared with their normal counterparts, and this is thought consistent with the requirement of cancer cells to migrate through tissues. A variety of techniques have been used to study cancer cell stiffness including: micropipette aspiration (Ward et al. 1991), optical deformity (Guck et al. 2005), particle tracking microrheology (Baker et al. 2010), and observation of cell bound magnetic beads (Swaminathan et al. 2011; Coughlin et al. 2013). Atomic force microscopy (AFM) permits direct physical measurement of the cell surface, and has confirmed the low stiffness of both isolated cancer cells (Lekka et al. 1999; Cross et al. 2007; Cross et al. 2008; Fuhrmann et al. 2011; Xu et al. 2012; Sarna et al. 2013; Efremov et al. 2014; Ramos et al. 2014; Weder et al. 2014), and cancer cells in tissues (Plodinec et al. 2012).
Transformation of fibroblasts correlates with decreased stiffness by AFM, and this is associated with discrete cytoskeletal changes (Efremov, Lomakina et al. 2014). Also, local progression of melanoma is associated with reduced cell-stiffness (Weder, Hendriks-Balk et al. 2014), and bladder cancer cell lines of increasing metastatic potential have decreasing cell-stiffness (Ramos, Pabijan et al. 2014).
While paclitaxel decreases stiffness of Ishikawa and HeLa tumour cells (Kim et al. 2012), separate agents with anti-cancer activity increase malignant cell-stiffness including green tea extract (Cross et al. 2011), chitosan (Lekka et al. 2001), cisplatin (Sharma et al. 2012), and epigallocatechin gallate (Takahashi et al. 2014). Separately, the origin of prostate cancer cells from either lymph node or bone metastatic sites correlates with cell-stiffness (Docheva et al. 2010).
Based on observations such as those summarized above, it has been suggested that study of cell-stiffness may provide increased opportunity for diagnosis of malignant disease (Suresh 2007). The relationship between malignant behavior and cell-stiffness is, however, not simple, such that for example, the presence of melanosomes in melanoma cells correlates with increased cell stiffness (Sarna, Zadlo et al. 2013). Further related to this, is that despite initial reduction in cell-stiffness with melanoma progression, further metastasis is associated with a relative increase in cell-stiffness (Weder, Hendriks-Balk et al. 2014).
Mechanical stress is a measure of the pressure experienced by an object subjected to force, calculated as force per unit area with the units of N/m2 or Pascals (Pa). Strain is a measure of the change in length of an object after being subjected to a certain amount of stress. The relationship between the two defines the stiffness of the material and is known as the modulus of elasticity, or Young’s modulus, and this ratio lends itself to measurement via AFM, in which the precise Z-direction control of the device permits indentation of known distance into samples. The cantilever stiffness can be calculated using the Thermal Tune method, while probes of known tip geometry, such as the spherical indenter we used in our study, can be purchased and used for these purposes. By knowing the stiffness and geometry of the cantilever and probe itself, and measuring how much it bends when coming in contact with the sample, it is possible to use one of several different mathematical models to calculate the pressure applied to the sample and establish a precise measure of the Young’s modulus at the micro-region of indentation (Barthel 2008).
Most studies applying AFM to measure cell-stiffness involve sampling adherent cells over the nuclear region (Cross, Jin et al. 2008; Cross, Jin et al. 2011; Fuhrmann, Staunton et al. 2011; Kim, Cho et al. 2012; Sharma, Santiskulvong et al. 2012; Watanabe et al. 2012; Xu, Mezencev et al. 2012; Krause et al. 2013; Efremov, Lomakina et al. 2014; Ramos, Pabijan et al. 2014; Takahashi, Watanabe et al. 2014; Weder, Hendriks-Balk et al. 2014), and this is to avoid thin peripheral cytoplasmic domains. This is thought necessary because it is well established that substratum effects can distort stiffness values, if the probe approaches the substratum too closely in thin specimens (Akhremitchev and Walker 1999; Costa and Yin 1999), so that likelihood of spurious measurements can be reduced by both minimizing the depth of indentation, and also by measurement over the nucleus which is the thickest part of the cell. Although directed sampling of the central nuclear area by AFM may be further justifiable with regard to cancer, on grounds of the nucleus being the largest organelle that must be forced through tissue spaces during migration (Krause, Te Riet et al. 2013), characterization of cytoplasm separate to the nucleus may be informative. From this, it seemed important to us that an approach be developed for recording cell-stiffness that includes not only the nucleus, but also the surrounding cytoplasm, and we here describe a method which we believe helpful to this end.
Some investigators have exploited the capacity of AFM to scan across discrete fields, in order to build maps of cell-stiffness, but have understandably focused on the nuclear region (Fuhrmann, Staunton et al. 2011; Jin et al. 2012), so that the possible contribution of cytoplasmic domains to overall stiffness remains uncertain.
In the current study, although using well established AFM methods for measuring stiffness, we greatly expand the AFM scanning approach (Fuhrmann, Staunton et al. 2011; Jin, Pi et al. 2012), and describe what appears to be a novel analysis for wide sampling of cultured cells independent of the nuclear domain. This analytical strategy fingerprints cell-stiffness for separate cultured cell types, by generating large data sets plotting many individual stiffness measurements against the height at which they were recorded, so that this fingerprinting analysis provides a more nuanced record of cell-stiffness than has been possible using previously described methods. We also describe an approach for dealing with potentially spurious individual results. Our analysis was dependent on collection of large data sets, and this permitted statistically meaningful comparison of both cell height and stiffness, and hence provided statistically robust description of cell-stiffness-fingerprints. We provide data from a wide variety of cell types including human dermal fibroblasts (HDF), osteosarcoma cells SAOS-2 and U2OS, ovarian carcinoma cells COLO316 and PEO4, and the melanoma cell lines WM175, MeIRMu, and MM39, and argue that this analytical method would be of value for further AFM investigations.
Materials and methods
Materials
All culture media including M199, RPMI, DMEM, α-MEM, Trypsin (0.25%)-EDTA (0.02%) and phosphate buffered saline (PBS), as well as Penicillin (10,000 U/ml)-Streptomycin (10,000 μg/ml) concentrate solution were prepared and supplied by the Memorial Sloan-Kettering Cancer Centre Culture Media Core Facility (New York, NY). Amphoteracin B was purchased from Life Technologies (Grand Island, NY). Gelatin was from TJ Baker Inc (Philipsburgh, NJ). Falcon tissue culture flasks, AFM dishes and centrifuge tubes were purchased from BDBiosciences (Two Oak Park, Bedford, MA). Human dermal fibroblasts (HDF) were from The Coriell Institute (Camden, NJ), while SAOS-2 osteosarcoma cells were from the American Type Culture Collection (VA, USA), and other tumour cell lines were donated from the collection of The Millennium Institute (Westmead, NSW, Australia). Paraformaldehyde (PFA) solution (32%) was purchased from Electron Microscopy Supplies (Hatfield, PA).
Cell culture and preparation of cells for atomic force microscopy
All cells were grown to confluence in 25 cm2 culture flasks prior to seeding for AFM, while the antibiotics penicillin (100 U/ml), streptomycin (100 μg/ml) and amphotericin B (2.5μg/ml) were used throughout all cell culture. Culture conditions differed according to cell type, such that: HDF were always cultured on gelatin coated surfaces (0.1% in PBS) in alpha-MEM (15% FCS); the melanoma cells MM39, WM175, and MeIRMu were cultured in DMEM (10% FCS); the osteosarcoma cells SAOS-2 and U2OS were in M199 (10% FCS); and the ovarian carcinoma cell lines COLO316 and PEO4 were in RPMI (10% FCS). Cells were harvested using trypsin-EDTA, into FCS to neutralize trypsin, and pelleted by centrifugation before seeding at 70% confluence in AFM culture dishes pre-coated for 48 hr at 37ºC with gelatin (0.1% in PBS). Cell lines differed in capacity to bind to AFM culture surfaces, and were permitted 3 days culture prior to three washes with PBS (pre-warmed to 37ºC), fixation for 20 min with solution prepared from PFA (4% in PBS, at 37ºC), and three washes with PBS (pre-warmed to 37º C). Fixed monolayers were stored under PBS at 4ºC for AFM recordings, which were made over three separate days each separated by one week, while there was no clear effect of storage on separate recordings of HDF made on each day of the three week period.
Atomic force microscopy and stiffness measurement
An Asylum Research MFP-3D-BIO AFM was used for all experimentation. The Asylum research software package enabled thermal tune calibration of cantilever stiffness as well as force mapping of the area of interest. AFM probes vary in specific geometry, and this has particular bearing on the current study because both micron-sized spherical and nanometer sized pyramidal probes interrogate differing size scales in composite gel materials (Loparic et al. 2010). For this reason, we selected a 6.1 um spherical polystyrene probe provided by NanoAndMore (Lady’s Island, SC), while the manufacturer provides guarantee of probe size by scanning electron microscopy. With a spherical indenter, the contact area sampled is related to the indentation depth by the following equation:
where a is the contact area, h is the indentation depth, and R is the radius of the probe. Based on test indentations on our samples, we found that the contact area would vary between 800–1600 nm2. Both before and after each use and sample, the probe was thoroughly washed with both 1% SDS followed by ddH2O to prevent tip contamination.
The precise Z-distance calibration of deflection, as well as the probe stiffness (k) of the probe must be measured in order to calculate stiffness values from the observations made. The Inverse Optical Lever Sensitivity (InvOLS) relates the actual Z position of the probe to the location of the laser reflection in the photodiode and was recalibrated prior to each sample since it is subject to thermal drift. The Asylum Research software package enabled thermal tune calibration of cantilever stiffness. Briefly, a dry InvOLS was calculated by collecting a force curve on a hard, clean surface (glass), which calibrated the deflection in distance (nm/V). A thermal noise plot was then collected and the first resonance peak was fit with the software to determine the probe stiffness (k). Finally, a second wet InvOLS was calculated by collecting a force curve on a hard, clean surface in PBS to recalibrate for changes in the refractive index between air and the measurement media.
A slow indentation velocity of 3.5 μm/s was used to reduce viscous effects that would otherwise interfere with mathematical modeling to calculate Young’s modulus. A trigger point for retraction was defined at 25 nm deflection, so that indentation depth depended on stiffness of the area measured, while indentation depth was usually between 100 nm and 500 nm. 32 x 32 points of force curves were collected over 90 μm x 90 μm areas.
Analysis and statistics
Because AFM measurements within individual areas scanned are made relative to an arbitrary position that varies when scanned fields are changed, and also because we could not confidently exclude the possibility that any given measurement of an area between cells was not in fact of a delicate cell process below the XY resolution of the height maps prepared, it was not possible to be certain of the position of the plastic culture surface for preparation of an absolute n-point plane fit for the plastic surface. However, assuming that the cells were growing as a consistently flat monolayer, it was possible to establish a plane-fit for entire height maps using the automated software provided by the manufacturer of the instrument (Asylum Research, Software Version IX), and all measurements of height were made relative to these calculated reference planes. Preliminary analysis revealed consistency in height measurements for data collected from multiple scanned fields, when the lowest point measured in any given field was assigned a value of 0 and this was assumed to represent the plastic cell culture surface. For this reason, all numerical analysis of height measurements were relative to the lowest point identified.
As discussed in more detail below, early trials also revealed that data were most appropriate for analysis by the Hertz model, so that the AR software was used to provide Young’s modulus for each point as calculated by the Hertz model. Accuracy of the Hertz model is greatly affected by localization of the contact point, which was selected manually and was clear on the great majority of curves. We assumed a Poisson’s ratio ν = 0.33 for all fits, and fit the model to the indentation range of approximately 30–90% of the collected data, to avoid the early contact region which tends to be highly variable due to the complexity of the cell surface.
Stiffness values were calculated for all points measured using the AR software and exported to Excel. Preliminary analysis revealed occasional apparently spurious stiffness values at levels within 0.8 μm of the lowest point measured. For this reason, statistical analysis of stiffness values was only performed for those values collected above the 0.8 μm level. Height measurements, however, were recognized as accurate and could be included for statistical analysis across the full range of heights measured. Median and mean values were determined using Excel software (Microsoft, Redmond, WA) while statistical significance was determined using the Mann Whitney U Test in Prism 6.0e software (GraphPad Software Inc, La Jolla, CA).
Results
The Hertz model was consistent with observed indentation plots
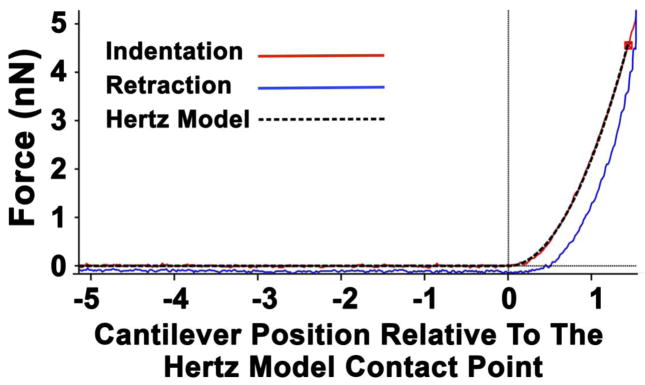
Fig. 1 plots the relationship between force and the probe cantilever position during indentation and retraction, as well as the result of the calculated Hertz model. There was good approximation of the Hertz model to the indentation plot data collected, while data collected during probe retraction indicated low adhesiveness and hysteresis. These characteristics confirmed that data was appropriate for application of the Hertz model.
Fig. 1.
Graph plotting the relationship between force and the position of the probe cantilever during indentation (red line) and retraction (blue line), as well as the Hertz model fit over the indentation curve (black line). The vertical line represents the contact point for the model fit.. In this instance, the calculated indentation depth was 152 nm, while there was close approximation of the calculated Hertz model (black line) with the indentation plot (red line), as well as low adhesiveness (blue line).
Fibroblasts and COLO316 had more flattened morphology compared to other cells studied
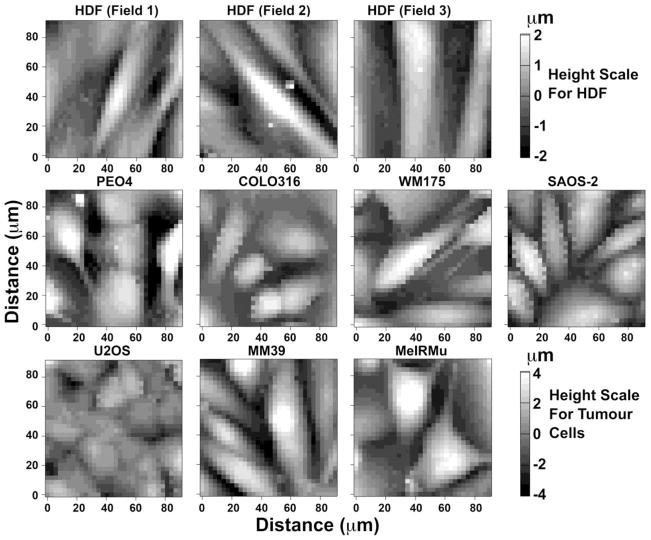
Fig. 2 shows height maps for representative sites measured in all cell lines studied. Cells varied in size and shape, and although some individual whole or near whole cell profiles were seen in all images of tumour cells collected, this was not the case for HDF where only parts of individual cells were captured in scanned areas. In order to improve sampling of HDF, 10 separate fields were scanned at random to collect data from 46 separate cells. In the case of tumour cells, only three separate areas were scanned, so that data was from 15 MeIRMu cells, 20 PEO4 cells, 21 MM39 cells, 23 WM175 cells, 27 COLO316, 27 SAOS-2, and 37 U2OS cells.
Fig. 2.
Atomic force microscopy height maps of 90 μm square scanned areas of three separate representative fields of HDF, and single fields of malignant cells including PEO4, COLO316, WM175, SAOS-2, U2OS, MM39 and MeIRMu. HDF had a more flattened height profile compared with most malignant cell lines, so that the visual grey-scale for height applied for HDF ranged only from −2μm to 2μm, as opposed to −4 μm to 4 μm for malignant cells. HDF were also appreciably larger than all of the malignant cells studied, with the effect that scanned areas could encompass only segments of individual HGF, as opposed to malignant cells which were small enough to often be captured in entirety within individual areas scanned.
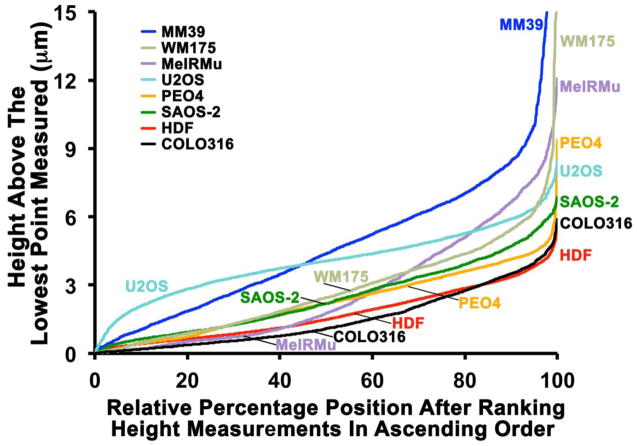
HDF had a generally flatter profile compared with malignant cells (Fig. 2), and this is further illustrated in Fig. 3 showing the relative percentage distribution of height measurements, as well as in Table 1 which includes average and median height values. While automated image smoothing obscures detail of cell surfaces in the height map (Fig. 2), much greater variability in cell surface height was apparent when examining height data in Figure 2. By summating height measurements and dividing these by the number of measurements made, it was possible to effectively integrate the curves shown in Fig. 3 and to further calculate the average volume of cell material per site measured. Using this approach, COLO316 had the lowest cell volume per site measured, followed by HDF, and then PEO4, SAOS-2, MeIRMu, WM175, U2OS, and MM39 (Table 1). Differences in height measurements between cell types studied were significant in almost all instances (p < 0.0001), exceptions being when comparing PEO4 with both SAOS-2 and MeIRMu, as well as SAOS-2 with MeIRMU, where there was no statistically meaningful difference (Fig. 3).
Fig. 3.
Line graphs in which height measurements are arranged in ascending order and assigned a percentage value relative to that order, such that the lowest height value has a value of 0 and the highest a value of 100. There were substantial differences in not only the maximum height of cells, but also in the distribution of height measurements across cell lines, such that COLO316 and HDF had greatly flattened cell profiles, and U2OS and MM39 presented more elevated and deeply furrowed surfaces.
Table 1.
The number of sites analyzed for height and stiffness, as median and average values for height and stiffness, and the calculated average volume per site measured.
| HDF | PEO4 | COLO316 | WM175 | SAOS-2 | U2OS | MM39 | MeIRMu | |
|---|---|---|---|---|---|---|---|---|
|
|
||||||||
| Height | ||||||||
| Number of Sites Measured For Height | 10,240 | 3,072 | 3,072 | 3,072 | 3,072 | 3,072 | 3,072 | 3,071 |
| Median Height (μm) | 1.48 | 2.19 | 1.09 | 2.45 | 2.02 | 4.06 | 4.37 | 1.76 |
| Average Height (μm) | 1.73 | 2.24 | 1.52 | 2.79 | 2.31 | 4.03 | 4.79 | 2.72 |
| Average Volume (μm2) | 13.69 | 17.75 | 12.00 | 22.05 | 18.25 | 31.84 | 37.90 | 21.55 |
| Stiffness | ||||||||
| Number of Sites Analyzed for Stiffness | 7,404 | 2,404 | 1,801 | 2,496 | 2,441 | 2,986 | 2,876 | 2,041 |
| Median Stiffness (kPa) | 11,584 | 5,986 | 4,508 | 4,471 | 4,087 | 3,714 | 2,816 | 1,988 |
| Average Stiffness (kPa) | 14,600 | 7,159 | 11,624 | 5,167 | 5,163 | 4,278 | 3,251 | 2,692 |
Cell types varied greatly with regard to height and stiffness, while there was no clear correlation between mean or median values for stiffness and those for height. Differences in height and volume between cells were statistically significant (p < 0.0001) except for between PEO4 and both SAOS-2 and MeIRMu, as well as between SAOS-2 and MeIRMu. Differences in stiffness were all statistically significant (p < 0.0001 in all cases, except between WM175 and COLO316 where p < 0.02).
HDF were more stiff compared with malignant cell lines, while there was great variability in stiffness values both within and amongst cell types studied
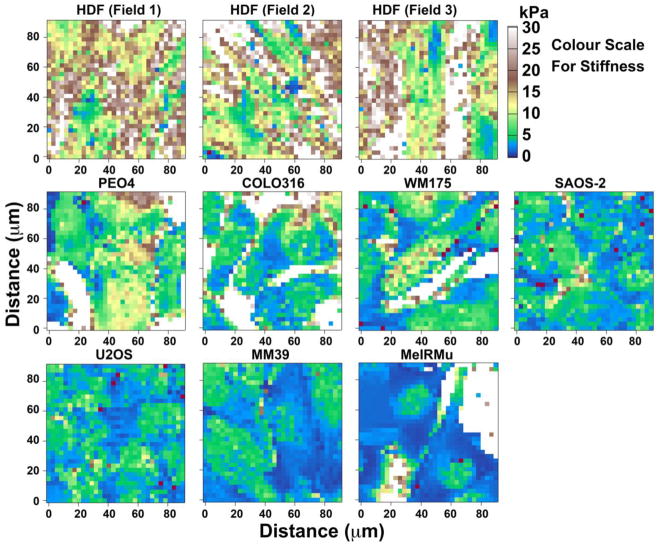
Fig. 4 shows maps for cell-stiffness of the same sites illustrated in Fig. 2, while Table 1 shows median and average stiffness values for all cell types studied. Stiffness varied significantly amongst cell types, and although there was general agreement in the order of ascending stiffness according to these two measures of central tendency, correlation was not absolute.
Fig. 4.
Atomic force microscopy stiffness maps of the same 90 μm square fields shown in Fig. 2, comprising three separate representative fields of HDF, and single fields of the malignant cells: PEO4, COLO316, WM175, SAOS-2, U2OS, MM39 and MeIRMu. Comparison of maps with the colour scale demonstrates HGF to be significantly more stiff compared with the malignant cell lines studied. Zones marked red were deemed unreliable for the purposes of analysis due to non-linearity of stress-strain measurements, and were thus excluded from the data. Areas marked white were recognized as often comprising culture plastic not covered by cellular material.
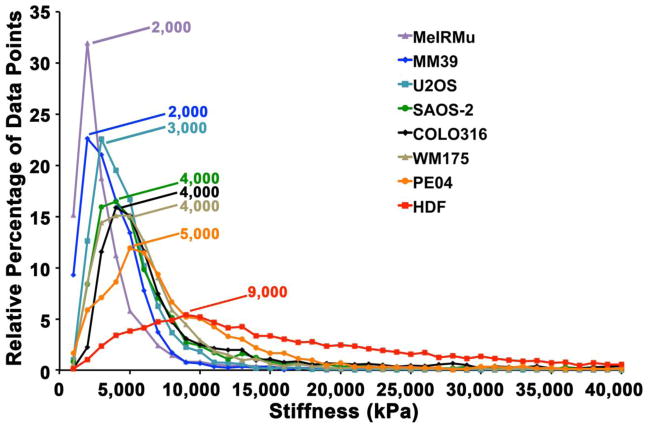
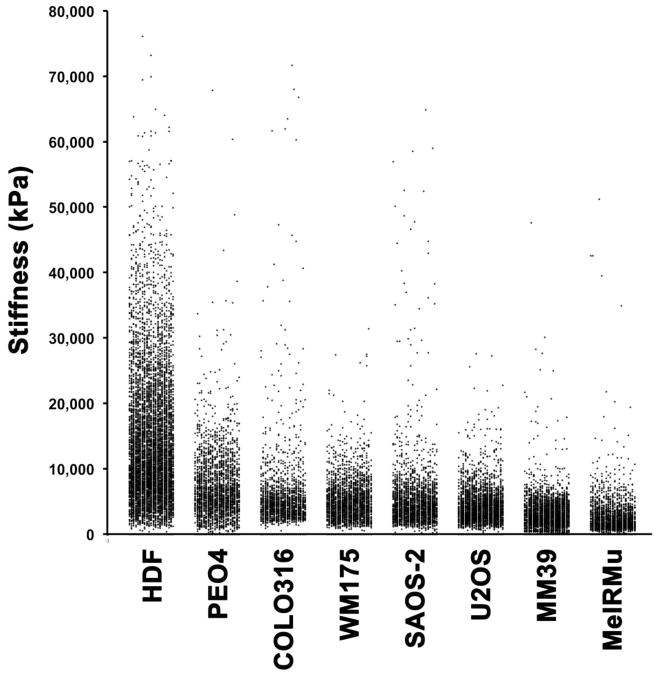
Fig. 5 displays data for all cell types studied as percentage distribution curves, and reveals differences in not only the peak prevalence of stiffness values across cell lines, but also in the width and skewedness of stiffness measurements recorded. HDF had the broadest range and highest value for peak incidence of stiffness measured. Notably, the location of peaks in percentage distribution curves (Fig. 5) did not correlate completely with the order of either mean or median values for stiffness (Table 1). Scattergrams of stiffness measurements make the high variability of stiffness values both within and between cell types studied apparent (Fig. 6), and cast doubt on the meaning of measures of central tendency with regard to the data set studied. Nonetheless, median values (Table 1) did appear to correlate with an appearance of increasing stiffness in scattergrams (Fig. 6). However, the range of stiffness values measured within individual cell lines did not correlate with median values, with MeIRMu for example, having the lowest median stiffness value, and nonetheless displaying occasional individual stiffness measurements very much higher than in U2OS for example. U2OS, MM39 and WM175 cells, had the more narrowly restricted ranges of stiffness compared with other cells, while HDF and PEO4 had the broadest distribution of stiffness measurements recorded.
Fig. 5.
Percentage distribution curves for all cell types investigated, demonstrating the relative percentage of measurements for stiffness falling within ranges of stiffness at increasing increments of 1000 kPa. While stiffness values overlapped for all cell lines, and there was variation with regard to location, width and skewedness of peaks seen, the curve and peak for HGF was clearly to the right of all malignant cells studied.
Fig. 6.
Scattergrams of stiffness measurements made for all cell lines studied at or above 0.8 μm height, and arranged in order of decreasing median stiffness value. There appeared to be good correlation between median stiffness values (Table 1) and the general central tendency of data clouds for each cell line studied. However, the range of stiffness values measured within individual cell lines varied greatly.
Statistical evaluation by Mann Whitney U Test confirmed the visual impression that HDF were significantly stiffer compared with all malignant cell types studied (p < 0.0001). Amongst tumour cells, in descending order of stiffness were PEO4, COLO316, WM175, SAOS-2, U2OS, MM39, and MeIRMu, with almost all differences between cell lines being statistically significant to p < 0.0001, and the only exception being between WM175 and COLO316 where statistical significance was lower (p < 0.02).
Scattergrams of height against stiffness comprised stiffness-fingerprints for each cell type studied and demonstrated cell-stiffness peaked at the lowest and highest height ranges
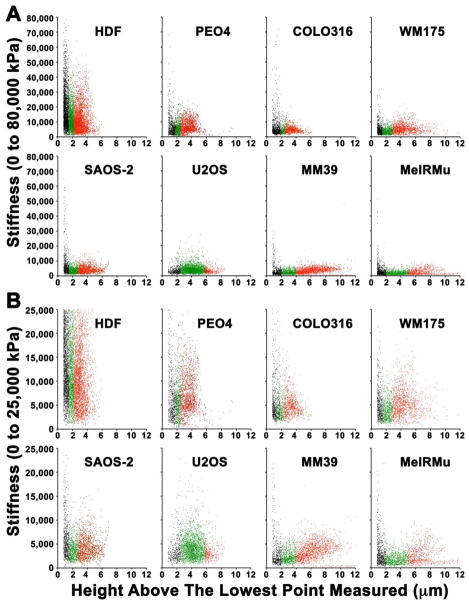
Fig. 7 shows scatterplots of height against stiffness for all measurements made, and illustrates unique fingerprints for each cell type studied. Inspecting the data, it was generally possible to define low (black scatter marks), middle (green scatter marks) and high (red scatter marks) ranges of cell height, where there also appeared to be differences in stiffness. In most cases, the highest stiffness values were in the lower range of height measurements (Fig. 7, black scatter marks), and this was statistically significant in HDF, MeIRMU, SAOS-2, PEO4, and WM175 (p < 0.0001), but not in COLO316 or MM39 where a visual impression of a stiffness peak in the low height range could not be confirmed as statistically significant. A notable exception was in U2OS where stiffness values were lower at low height measurements and rose towards a peak in the mid height range (p < 0.0001) (Fig. 7). A second broader peak in stiffness was seen in the upper height range for almost all cells studied (Fig. 7 red scatter marks, p < 0.0001 for HDF, MeIRMu, MM39, PEO4, and WM175, p < 0.05 for SAOS-2), although this was not statistically significant for COLO316, while U2OS again comprised an exception in not displaying this second peak in cell-stiffness. Stiffness values were typically higher in the lower height range (Fig. 7, black scatter marks) compared with higher height measurements (Fig. 7, red scatter marks) (p < 0.0001 for HDF, SAOS-2, MM39, p < 0.002 for PEO4, and p < 0.0007 for WM175), but this was not statistically significant for MeIRMu and COLO316, while U2OS did not display the two peaks in stiffness observed in other cell lines (Fig. 7).
Fig. 7.
Scattergrams of data collected at or above 0.8 μm height, plotting height against stiffness up to 80,000 kPa to permit inspection of the full range of data (A), as well in the restricted range of from 0 kPa to 25,000 kPa (B) to better visualize results for lower stiffness values. Height measurements correlated loosely with stiffness values, such that the highest stiffness values were seen at low height measurements (black scatter marks), with a second broad peak in stiffness (red scatter marks) occurring after an intervening trough (green scatter marks). The exception to this was in U2OS, where stiffness was maximal in the mid region of height measurements (green scatter marks).
Discussion
By using a scanning approach of 90 μm square fields of adherent cells, the current study has sampled the maximum possible extent of cellular anatomy, so that the contribution of cytoplasmic domains independent of the nucleus is represented in a way not usual for AFM cell-stiffness determinations. The nature of this sampling, is that only occasional whole single cells are measured, but instead data is accumulated from contributions of many cells, often only partly in the scanned field and largely obscured from view. This has particular importance with regard to evaluation of cell-stiffness in very large cells such as fibroblasts, in which the nucleus comprises only a very small proportion of the total cell volume. In the current study, fibroblasts were of such size that no single scanned field contained a single whole cell. It did seem reasonable, however, to approach this problem by simply increasing the number of scanned areas studied, and the clear statistical difference in stiffness and height measurements between HDF and tumour cells suggests that this was appropriate. We suggest that data pooled in this way, unbiased by reference to the nucleus, provides opportunity for a more rich investigation of cell-stiffness than is possible with analysis over nuclear structures alone.
All mathematical models available to calculate Young’s modulus from AFM data have limitations, but we elected to use the Hertz model not only because it is widely accepted for AFM studies, but also because our data demonstrated elastic behavior together with low adhesiveness appropriate for the Hertz model. None of the alternative models available to us were as appropriate to our data, including the Olive-Pharr model that is more suited for non-elastic irreversibly deformable samples, and the Johnson Kendall Roberts, and Dejaguin, Muller Toporov models considered more appropriate for elastic samples with high adhesion (Barthel 2008). Although we acknowledge that cells differ from the Hertz model in some ways, good approximation was found between observed indentation plots and those calculated from the Hertz model, increasing confidence in the stiffness values calculated.
One difficulty encountered was the generation of spuriously high stiffness records at very low cell height levels, and this may represent instances where the AFM probe impinged upon the underlying culture surface through thin cytoplasm at cell peripheries. This was most common below 0.8 μm of height and to facilitate comparison between cell lines, we felt it best to delete all stiffness values below 0.8 μm, but acknowledge this may have resulted in loss of valuable data. Related to this, is that very high stiffness records were occasionally obtained over more central parts of cells, and particularly in COLO316 where these oddly high values inflated the calculated average stiffness out of keeping with both the median value (Table 1) and scattergrams of data (Figs. 5 and 6). Although it was tempting to delete these high values, we could see no clear justification for so doing. Stiffness and height values were not normally distributed, so that average values had little meaning and median values appeared to better reflect the spread of data in scattergrams, especially with regard to cell-stiffness (Table 1, Fig. 6).
In our study, data from individual scans was plane-fit using the software provided by the microscope manufacturer, and the precise location of the plastic culture surface was assumed to be the lowest point below the calculated plane. One effect of discarding stiffness measurements below 0.8 μm of height of the presumed plastic surface, was to buffer the stiffness-fingerprints generated from the effect of any slight inaccuracy that may have emerged from inability to precisely localize the position of the plastic surface in an absolute zero-plane fit, and demonstration of statistically meaningful differences in the stiffness fingerprints generated lends confidence to our approach. In addition, by removing stiffness measurements from sites potentially affected by substratum effects, any possible effect of any slight variability in substratum stiffness was eliminated, although the culture surfaces used are manufactured to be flat and have consistent stiffness.
Of interest, was that plots of stiffness opposed to height (Fig. 7) revealed clearly different patterns of data amongst the cell types studied, while these stiffness-fingerprints were readily evaluated for statistical significance by the Man Whitney U Test, easily performed with widely available software on large data sets. We suggest that the statistically significant differences observed between differing tumour cell lines of otherwise comparable average cell-stiffness (Table 1, Fig. 6, Fig. 7), reflects much greater sensitivity of such fingerprints to detect subtle features of cell-stiffness, compared with the more traditional approach of sampling discrete nuclear sites (Cross, Jin et al. 2008; Cross, Jin et al. 2011; Fuhrmann, Staunton et al. 2011; Kim, Cho et al. 2012; Sharma, Santiskulvong et al. 2012; Watanabe, Kuramochi et al. 2012; Xu, Mezencev et al. 2012; Krause, Te Riet et al. 2013; Efremov, Lomakina et al. 2014; Ramos, Pabijan et al. 2014; Takahashi, Watanabe et al. 2014; Weder, Hendriks-Balk et al. 2014).
As illustrated in Fig. 7, for most cells stiffness values were highest at sites with low height measurements, while a second less pronounced peak in stiffness occurred in the upper height domain, and we interpret these two peaks as representing the effect of the peripheral actin cytoskeleton prominent at the thinned cell periphery, and the nucleus at elevated levels. U2OS cells diverged from this pattern, and the absence of a peak at low height measures likely reflects high confluence and absence of thin peripheral cytoplasmic regions as revealed in Fig. 4. The absence of the second peak found in other cell lines at elevated height measurements, however, suggests that U2OS may have a fundamentally different stiffness-fingerprint compared with other cells studied.
Regardless, it does seem clear that application of the current method for establishing stiffness-fingerprints requires careful control of culture density, while in the current study this proved very difficult because of differing capacity to adhere to the culture surface amongst differing cell lines. To try and reduce variability in data due to decaying culture conditions in the atomic force microscope, we elected to fix cells with paraformaldehyde. This will have affected the specific values recorded, but did have the advantage of establishing uniform conditions for all cell types and fields scanned. Fixation is, however, is presupposed to have a comparable effect across all cell lines, and this would require separate confirmation in a much larger study. This may be particularly important, where the effect of differing cell treatment upon stiffness is to be studied, and we argue that the fingerprint method we outline may be particularly well suited to detect subtle changes in such studies (Lekka, Laidler et al. 2001; Docheva, Padula et al. 2010; Cross, Jin et al. 2011; Kim, Cho et al. 2012; Sharma, Santiskulvong et al. 2012; Takahashi, Watanabe et al. 2014). Similarly, we suggest that if combined with molecular localization methods, the approach we describe will permit refined analysis of the roles discrete cellular elements play in determining the stiffness of cell surface micro-domains.
Acknowledgments
We thank the Memorial Sloan-Kettering Cancer Center and Australian Dental Research Fund for their support of related work.
References
- Akhremitchev BB, Walker GC. Finite sample thickness effects on elasticity determination using atomic force microscopy. Langmuir. 1999;15:5630–5634. [Google Scholar]
- Baker EL, Lu J, Yu D, Bonnecaze RT, Zaman MH. Cancer cell stiffness: integrated roles of three-dimensional matrix stiffness and transforming potential. Biophys J. 2010;99:2048–2057. doi: 10.1016/j.bpj.2010.07.051. [DOI] [PMC free article] [PubMed] [Google Scholar]
- Barthel E. Adhesive elastic contacts - JKR and more. Journal of Physics D: Applied Physics. 2008;41:163001–163041. [Google Scholar]
- Costa KD, Yin FCP. Analysis of indentation: Implications for measuring mechanical properties with atomic force microscopy. Journal of Biomechanical Engineering-Transactions of the Asme. 1999;121:462–471. doi: 10.1115/1.2835074. [DOI] [PubMed] [Google Scholar]
- Coughlin MF, Bielenberg DR, Lenormand G, Marinkovic M, Waghorne CG, Zetter BR, Fredberg JJ. Cytoskeletal stiffness, friction, and fluidity of cancer cell lines with different metastatic potential. Clin Exp Metastasis. 2013;30:237–250. doi: 10.1007/s10585-012-9531-z. [DOI] [PMC free article] [PubMed] [Google Scholar]
- Cross SE, Jin YS, Lu QY, Rao J, Gimzewski JK. Green tea extract selectively targets nanomechanics of live metastatic cancer cells. Nanotechnology. 2011;22:215101. doi: 10.1088/0957-4484/22/21/215101. [DOI] [PMC free article] [PubMed] [Google Scholar]
- Cross SE, Jin YS, Rao J, Gimzewski JK. Nanomechanical analysis of cells from cancer patients. Nat Nanotechnol. 2007;2:780–783. doi: 10.1038/nnano.2007.388. [DOI] [PubMed] [Google Scholar]
- Cross SE, Jin YS, Tondre J, Wong R, Rao J, Gimzewski JK. AFM-based analysis of human metastatic cancer cells. Nanotechnology. 2008;19:384003. doi: 10.1088/0957-4484/19/38/384003. [DOI] [PubMed] [Google Scholar]
- Docheva D, Padula D, Schieker M, Clausen-Schaumann H. Effect of collagen I and fibronectin on the adhesion, elasticity and cytoskeletal organization of prostate cancer cells. Biochem Biophys Res Commun. 2010;402:361–366. doi: 10.1016/j.bbrc.2010.10.034. [DOI] [PubMed] [Google Scholar]
- Efremov YM, Lomakina ME, Bagrov DV, Makhnovskiy PI, Alexandrova AY, Kirpichnikov MP, Shaitan KV. Mechanical properties of fibroblasts depend on level of cancer transformation. Biochim Biophys Acta. 2014;1843:1013–1019. doi: 10.1016/j.bbamcr.2014.01.032. [DOI] [PubMed] [Google Scholar]
- Fuhrmann A, Staunton JR, Nandakumar V, Banyai N, Davies PC, Ros R. AFM stiffness nanotomography of normal, metaplastic and dysplastic human esophageal cells. Phys Biol. 2011;8:015007. doi: 10.1088/1478-3975/8/1/015007. [DOI] [PMC free article] [PubMed] [Google Scholar]
- Guck J, Schinkinger S, Lincoln B, Wottawah F, Ebert S, Romeyke M, Lenz D, Erickson HM, Ananthakrishnan R, Mitchell D, Kas J, Ulvick S, Bilby C. Optical deformability as an inherent cell marker for testing malignant transformation and metastatic competence. Biophys J. 2005;88:3689–3698. doi: 10.1529/biophysj.104.045476. [DOI] [PMC free article] [PubMed] [Google Scholar]
- Jin H, Pi J, Huang X, Huang F, Shao W, Li S, Chen Y, Cai J. BMP2 promotes migration and invasion of breast cancer cells via cytoskeletal reorganization and adhesion decrease: an AFM investigation. Appl Microbiol Biotechnol. 2012;93:1715–1723. doi: 10.1007/s00253-011-3865-3. [DOI] [PubMed] [Google Scholar]
- Kim KS, Cho CH, Park EK, Jung MH, Yoon KS, Park HK. AFM-detected apoptotic changes in morphology and biophysical property caused by paclitaxel in Ishikawa and HeLa cells. PLoS One. 2012;7:e30066. doi: 10.1371/journal.pone.0030066. [DOI] [PMC free article] [PubMed] [Google Scholar]
- Krause M, Te Riet J, Wolf K. Probing the compressibility of tumor cell nuclei by combined atomic force-confocal microscopy. Phys Biol. 2013;10:065002. doi: 10.1088/1478-3975/10/6/065002. [DOI] [PubMed] [Google Scholar]
- Lekka M, Laidler P, Gil D, Lekki J, Stachura Z, Hrynkiewicz AZ. Elasticity of normal and cancerous human bladder cells studied by scanning force microscopy. Eur Biophys J. 1999;28:312–316. doi: 10.1007/s002490050213. [DOI] [PubMed] [Google Scholar]
- Lekka M, Laidler P, Ignacak J, Labedz M, Lekki J, Struszczyk H, Stachura Z, Hrynkiewicz AZ. The effect of chitosan on stiffness and glycolytic activity of human bladder cells. Biochim Biophys Acta. 2001;1540:127–136. doi: 10.1016/s0167-4889(01)00125-2. [DOI] [PubMed] [Google Scholar]
- Loparic M, Wirz D, Daniels AU, Raiteri R, Vanlandingham MR, Guex G, Martin I, Aebi U, Stolz M. Micro- and nanomechanical analysis of articular cartilage by indentation-type atomic force microscopy: validation with a gel-microfiber composite. Biophys J. 2010;98:2731–2740. doi: 10.1016/j.bpj.2010.02.013. [DOI] [PMC free article] [PubMed] [Google Scholar]
- Plodinec M, Loparic M, Monnier CA, Obermann EC, Zanetti-Dallenbach R, Oertle P, Hyotyla JT, Aebi U, Bentires-Alj M, Lim RY, Schoenenberger CA. The nanomechanical signature of breast cancer. Nat Nanotechnol. 2012;7:757–765. doi: 10.1038/nnano.2012.167. [DOI] [PubMed] [Google Scholar]
- Ramos JR, Pabijan J, Garcia R, Lekka M. The softening of human bladder cancer cells happens at an early stage of the malignancy process. Beilstein J Nanotechnol. 2014;5:447–457. doi: 10.3762/bjnano.5.52. [DOI] [PMC free article] [PubMed] [Google Scholar]
- Sarna M, Zadlo A, Pilat A, Olchawa M, Gkogkolou P, Burda K, Bohm M, Sarna T. Nanomechanical analysis of pigmented human melanoma cells. Pigment Cell Melanoma Res. 2013;26:727–730. doi: 10.1111/pcmr.12113. [DOI] [PubMed] [Google Scholar]
- Sharma S, Santiskulvong C, Bentolila LA, Rao J, Dorigo O, Gimzewski JK. Correlative nanomechanical profiling with super-resolution F-actin imaging reveals novel insights into mechanisms of cisplatin resistance in ovarian cancer cells. Nanomedicine. 2012;8:757–766. doi: 10.1016/j.nano.2011.09.015. [DOI] [PubMed] [Google Scholar]
- Suresh S. Nanomedicine: elastic clues in cancer detection. Nat Nanotechnol. 2007;2:748–749. doi: 10.1038/nnano.2007.397. [DOI] [PubMed] [Google Scholar]
- Swaminathan V, Mythreye K, O’Brien ET, Berchuck A, Blobe GC, Superfine R. Mechanical stiffness grades metastatic potential in patient tumor cells and in cancer cell lines. Cancer Res. 2011;71:5075–5080. doi: 10.1158/0008-5472.CAN-11-0247. [DOI] [PMC free article] [PubMed] [Google Scholar]
- Takahashi A, Watanabe T, Mondal A, Suzuki K, Kurusu-Kanno M, Li Z, Yamazaki T, Fujiki H, Suganuma M. Mechanism-based inhibition of cancer metastasis with (−)-epigallocatechin gallate. Biochem Biophys Res Commun. 2014;443:1–6. doi: 10.1016/j.bbrc.2013.10.094. [DOI] [PubMed] [Google Scholar]
- Ward KA, Li WI, Zimmer S, Davis T. Viscoelastic properties of transformed cells: role in tumor cell progression and metastasis formation. Biorheology. 1991;28:301–313. doi: 10.3233/bir-1991-283-419. [DOI] [PubMed] [Google Scholar]
- Watanabe T, Kuramochi H, Takahashi A, Imai K, Katsuta N, Nakayama T, Fujiki H, Suganuma M. Higher cell stiffness indicating lower metastatic potential in B16 melanoma cell variants and in (-)-epigallocatechin gallate-treated cells. J Cancer Res Clin Oncol. 2012 doi: 10.1007/s00432-012-1159-5. [DOI] [PubMed] [Google Scholar]
- Weder G, Hendriks-Balk MC, Smajda R, Rimoldi D, Liley M, Heinzelmann H, Meister A, Mariotti A. Increased plasticity of the stiffness of melanoma cells correlates with their acquisition of metastatic properties. Nanomedicine. 2014;10:141–148. doi: 10.1016/j.nano.2013.07.007. [DOI] [PubMed] [Google Scholar]
- Xu W, Mezencev R, Kim B, Wang L, McDonald J, Sulchek T. Cell stiffness is a biomarker of the metastatic potential of ovarian cancer cells. PLoS One. 2012;7:e46609. doi: 10.1371/journal.pone.0046609. [DOI] [PMC free article] [PubMed] [Google Scholar]


