Abstract
There is increasing emphasis on active transportation, such as walking, in transportation planning as a sustainable form of mobility and in public health as a means of achieving recommended physical activity and better health outcomes. A research focus is the influence of the built environment on walking, with the ultimate goal of identifying environmental modifications that invite more walking. However, assessments of the built environment for walkability are typically at a spatially disaggregate level (such as street blocks) or at a spatially aggregate level (such as census block groups). A key issue is determining the spatial units for walkability measures so that they reflect potential walking behavior. This paper develops methods for assessing walkability within individual activity spaces: the geographic region accessible to an individual during a given walking trip. We first estimate street network-based activity spaces using the shortest path between known trip starting/ending points and a travel time budget that reflects potential alternative paths. Based on objective walkability measures of the street blocks, we use three summary measures for walkability within activity spaces: i) the average walkability score across block segments (representing the general level of walkability in the activity space); ii) the standard deviation (representing the walkability variation), and; iii) the network autocorrelation (representing the spatial coherence of the walkability pattern). We assess the method using data from an empirical study of built environment walkability and walking behavior in Salt Lake City, Utah, USA. We visualize and map these activity space summary measures to compare walkability among individuals’ trips within their neighborhoods. We also compare summary measures for activity spaces versus census block groups, with the result that they agree less than half of the time.
1. Introduction
The analysis of the built environment for the suitability and attractiveness of walking has expanded considerably in the past decade in the fields of geography, psychology, public health, and urban planning (Brownson et al., 2009). Urban planners are interested in walking as a means of reducing vehicle miles traveled, greenhouse gas emissions, and sprawl (Ewing & Handy, 2009). Public health researchers are interested in walking because it can fulfill the US government recommended daily amount of exercise, reduce obesity, and fight chronic diseases (Gebel et al., 2011). Encouraging more walking trips and more time spent walking are beneficial societal goals of interest to a wide range of policy makers (Sallis et al., 2004; Brown et al., 2013).
A recent emphasis in walkability research and policy is the influence of the built environment (Agrawal et al., 2008; Sallis et al., 2004). Although socio-economic characteristics and individual preferences are significant influences, the built environment also has a significant influence on peoples’ choices to walk (Lee & Moudon, 2006). Also, built environment characteristics are often a more tractable intervention than changing personal characteristics and attitudes (Cerin et al., 2007a). A key research question is how to assess a built environment’s conduciveness for walking, also known as walkability.
Assessments of the built environment for walking are typically at two levels of geographic aggregation. At a disaggregate level, instruments such as the Irvine Minnesota Index (IMI) measure walkability for individual street block faces, that is, both sides of the street between intersections (Boarnet et al., 2006; Day et al., 2006). However, how to combine these individual segments into regions that are relevant to walking behavior is a question that needs attention. In contrast, it is common to use census geography, such as block groups, to assess walkability. However, this coarse and arbitrary geographic delineation is likely to mask fine-grained spatial variation in walkability that can affect walking behavior (Day et al., 2006). This is another manifestation of the modifiable areal unit problem (MAUP) in spatial analysis: arbitrary aggregation and zoning systems lead to inaccurate results (e.g., Yamada et al., 2012).
This paper develops methods to summarize built environment attributes using spatially aggregated units that are relevant to walking behavior. We use the concept of individual activity spaces or the spatial region accessible to an individual during a given trip as the basis for summarizing walkability. We first estimate individual activity spaces within the street network. These regions comprise the set of potential network paths between known trip endpoints and a travel time budget. Based on block-level composite walkability dimensions derived from field-collected IMI street block data, we calculate three walkability summary measures within each activity space: i) the average score representing the general level of walkability within the activity space; ii) the standard deviation score representing the variation in walkability in the activity space, and; iii) the network autocorrelation score representing the spatial coherence of walkability: how spatially clustered are network links (i.e., block segments) with high or low walkability? These three pieces of information combine to provide a comprehensive picture of walkability. Activity spaces with high average walkability, low variation and high positive network autocorrelation are best for walking, since these offer uniformly good environments with spatial coherence that allow the formation of highly walkable routes from individual blocks. Conversely, activity spaces with low average walkability, low variation and negative spatial autocorrelation are worst for walking since they are uniformly bad and do not allow for any uniformly high walkable routes. The three measures can be visualized and mapped to compare and explore walkability for representative individuals within a built environment. We illustrate our method using IMI-derived data from an empirical study of built environment walkability and walking behavior in a selection of neighborhoods in Salt Lake City, Utah, USA. Furthermore, we compare the activity space measures to spatial aggregation of the same IMI data at the US Census block group-level to assess the different portrayals of walkability provided by behaviorally relevant versus artificial regions.
The next section of the paper reviews related research, which includes the definition and measurement of walkability. Section 3 describes the methods employed, which includes generating activity spaces by using network potential path areas and the spatial autocorrelation measurement with Moran’s I. Section 4 comprises scatterplots of the summary measures and maps of walkability quadrant groups and comparison to block group measures. The final section concludes with discussion of results and methods, limitations, and future research.
2. Literature Review
2.1. Walkability Measurement
Walkability is the attractiveness and suitability of the built environment for walking. Walkability measurement is primarily concerned with quantifying the physical aspects of the built environment that may impact walking behavior (Saelens et al., 2003). Walkability measurement can also consider indirect built environment attributes, such as the perception of the built environment, which may have beneficial or detrimental impacts on walking (Brown et al., 2007). Measurement of built environment factors may include walking facilities, such as the presence and quality of sidewalks and crosswalks, number of vehicle travel lanes, and adjacent land use types and density (Moudon & Lee, 2003). Indirect built environment factors may include the presence of other pedestrians or perceptions of safety from traffic or crime (Moudon & Lee, 2003). Walkability measures often involve objective, subjective, or a mix of objective and subjective data. Objective measurements use direct field observations often called a walkability audit, or indirect methods such as the evaluation of secondary data using geographic information system (GIS) techniques. Subjective measurements can involve direct interviews or surveys with pedestrians or potential pedestrians in a study area or indirect methods such as the evaluation of built environment attributes related to perceptual response, such as design qualities (Ewing et al., 2006).
Walkability Measures
Issues in walkability measurement include indicator selection, spatial scale, and trip purpose. Walkability assessments within a built environment can differ based on the definitions and types of measurements used to measure both walking and walkability attributes (Moudon et al., 2006; Cerin et al., 2007b). For example, a commonly used land use mix indicator, the entropy index, does not consider specific types of land uses, only the variation between classes such as residential, industrial, commercial, and recreation (e.g. Schlossberg, 2006; Purciel et al., 2009). Therefore, different land use types may lead to the same land use mix score, masking the effect of specific land use types on walking variability (Brown et al., 2009; Yamada et al., 2012). Finally, the selection of the walking outcome measurement, such as a subset of total walking based on a specific trip purpose or trips that meet a minimum physical activity threshold, can affect the results of the relationship, both its significance and strength, between walking and the built environment (Alfonzo, 2005).
Two commonly-used levels of spatial aggregation for walkability assessment are street block-level and area-level. Block-level measures are very fine-grained in characterizing the built environment related to walking. Block-level measures are usually calculated with an on-site walkability audit, though the use of Google Street View has been explored (Rundle et al., 2011). An example of the use of an audit is to assess the effects of living on a more walkable block on other activities, such as light rail transit use (Werner et al., 2010). Although Werner et al. (2010) found a relationship between living on a walkable block and riding light rail, the study was limited because only one block was evaluated rather than the entire route to the train station. Gallimore et al. (2011) included all relevant street block segments in their estimates of the walkability of children’s routes from home to school. This improved precision by weighting walkability scores by block length and by providing more comprehensive walkability assessment of the entire route.
In contrast to segment-based walkability scores for block faces, calculation of area-level measures uses GIS data or through participant’s reported neighborhood perceptions. Area-level measures of walkability can be coarse, and obscure variation in the local built environment that may be crucial to influencing walking. Area-level measures also blur the fine-grained phenomena of social/spatial interaction of neighbors, and areas analyzed do not generally correspond to residents’ definition of their neighborhoods (Coulton et al., 2001). The spatial units used in area-level measures are typically collected for other purposes, such as tax assessment or zoning, that often do not correspond to a geography relevant for the scale of walking behavior (Day et al., 2006). Parcel level measures are an improvement over area-level measures (Lee et al., 2006). Parcels define a study area of residents with similar built environment attributes. However, this method does not meet the intuitive criterion that a neighborhood be spatially contiguous. In general, the parcel-level of detail is a useful scale for informing objective measures of the built environment; however there are the same drawbacks as with other data not collect specifically for studying walking, such as inconsistent definitions and incompleteness (Leslie et al., 2007). A limitation to area-level measures is that definitions of spatial units and scale affect the analysis of the data, a widely recognized problem known as the modifiable areal unit problem (MAUP; Duncan et al., 2010). This problem can be addressed by performing analyses at multiple scales with different spatial unit configurations for research questions in which the appropriate analysis scale is not known (e.g., Yamada et al., 2012). MAUP can also be mitigated by defining spatial units and scales that are meaningful to the behavior or phenomenon under study (Brownson et al., 2009; Mitra & Buliung, 2012; Werner et al., 2010).
Walkability Data Collection: Field Surveys and Secondary Data
Field audits by trained raters allow the collection of data that are specifically oriented towards walkability questions. A commonly used instrument for field audits is the IMI. The IMI consists of 162 unique elements thought to influence active living (Day et al., 2006). These elements include physical features like the presence of driveways, sidewalks, street trees, and street lights. The result of the audit is a numeric walkability score for different categories that gives a relative indication of how attractive a street block is for walking. The collection of detailed and potentially correlated data is time- and resource-consuming. The simplification of the diverse nature of a block into a single score, or set of dimensions, can cause significantly different blocks to be classified as similar (Gallimore et al., 2011). Also, the commonly used equally weighted, additive aggregation of items into dimensions assumes that attributes are compensatory– such as the high quality of a sidewalk compensates for the low quality of street lighting; this may not be the case for all attributes. These elements associated with walking have been validated against self-reported and accelerometer-measured physical activity measures (Boarnet et al., 2011).
GIS-based measures of walkability use readily available secondary data in most cases, and are therefore less expensive and quicker to determine, compared to field-based walkability audits. GIS-based measures attempt to characterize a neighborhood’s suitability for walking by using relevant data averaged over a neighborhood. In general, a small set of attributes are used, such as residential density, intersection density, land-use mix, and retail proximity (e.g., Gebel et al., 2011; Leslie et al., 2007; Lee et al., 2006). GIS-based walkability measures for neighborhoods are sensitive to spatial scale and the location of boundaries. The common operational definition of neighborhoods coincides with administrative geography, such as census tracts (e.g., Cutts et al., 2009). Calculating walkability measures using this geography does not necessarily correspond to residents’ physical or perceived neighborhoods (Coulton et al., 2001; Moudon et al., 2006). One possible solution is to assess built environment attributes in a buffer around a resident’s home (e.g., Troped et al., 2010; Berke et al., 2007), or use a resident’s perceived neighborhood extent (e.g., Gebel et al., 2011). However, if these buffer regions are not based on the resident’s behavior, the analysis still suffers from artifacts associated with the MAUP.
2.2. Activity Spaces and Walkability Assessment
As mentioned above, both street block-level and census geography-level walkability assessments have drawbacks for walkability assessment: aggregation of block-level assessment is sensitive to aggregation method and area selected, but aggregating to arbitrary spatial units such as census tracts may lead to arbitrary results. The concept of activity spaces provides a more behaviorally relevant unit of analysis for walkability assessment. An activity space is the limited portion of an environment experienced by an individual over some time period such as daily, weekly, monthly, annually or lifetime (Golledge & Stimson, 1987).
One method for defining activity spaces is through individual space-time prisms, or the accessible region to an individual during a mobility episode (Hägerstrand, 1970). A space-time prism for a trip is the collection of all possible paths between two geographic locations with corresponding departure and arrival times for the origin and destination, respectively. The departure and arrival times define a time budget or available time for that episode. Time budgets can be derived empirically from activity data collected through behavioral surveys, diaries or technologies based on GPS receivers or mobile phones (Ahas, Miller & Witlox, 2014). They can also be used as an input parameter as part of scenario modeling.
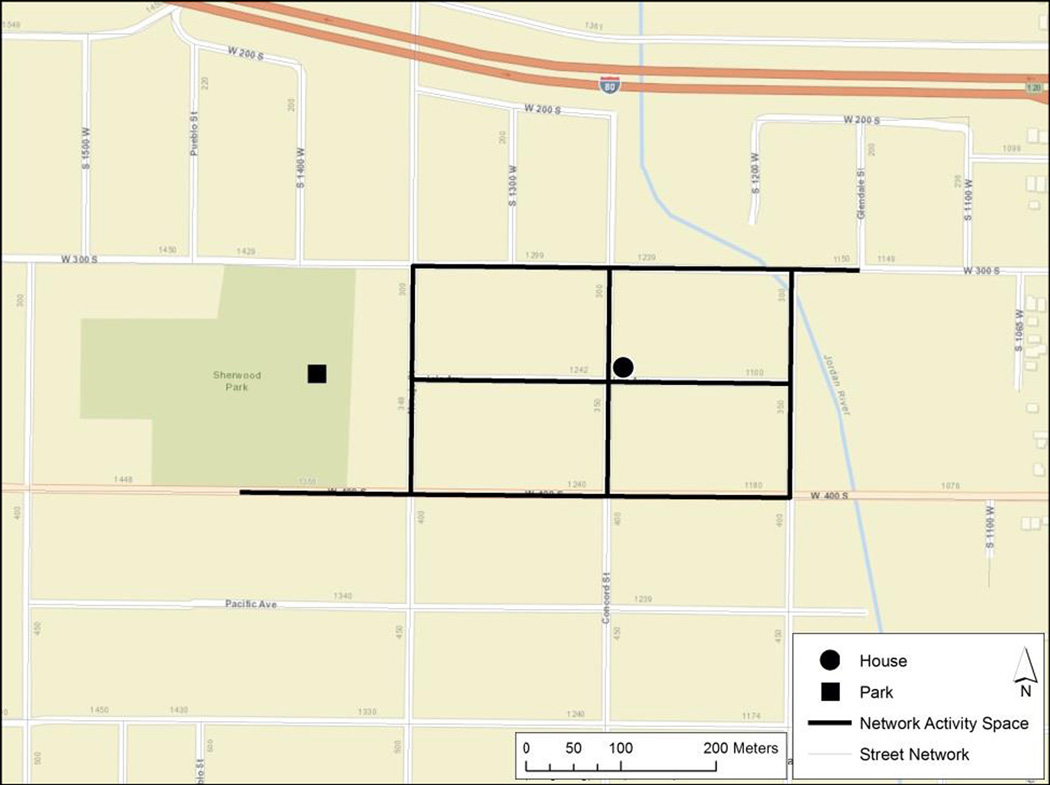
We can create a more realistic and relevant activity space through the concept of a network time prism: this is a space-time prism constrained by the geometry, connectivity and speeds of a transportation network (Kuijpers & Othman, 2009; Miller, 1999). The network activity space for a specific trip is the selection of all the traversable street blocks that meet the time, speed, and connectivity requirements, based on the network time prism. Figure 1 illustrates an activity space based on a network time prism defined by the potential routes for a trip from home to a park given a time budget of 12 minutes.
Figure 1.
Example of a network activity space highlighting accessible street blocks for a walking trip.
An activity space delineates the feasible street network region to assess the walkability dimensions for a particular trip. This ensures that only the relevant and potential blocks for a walking trip will be included in the summary of the built environment. This is meaningful for measuring the influence of the built environment on walking, since only the physical features that may be encountered on the specific trip are assessed, addressing the concern of arbitrary spatial units. This is also more comprehensive than only looking at attributes of the street block the individual lives on, one route, or areal generalizations of the built environment; this method is scaled to the level of the behavior under study: the pedestrian walking environment for a specific trip.
2.3. Spatial Dependency and Walkability Assessment
Spatial dependency is the concept that the observed values of a given variable are related to the observed values of the same variable at proximal locations (Getis, 2007). This violates the common statistical assumption of independence among observations. In walkability research, capturing spatial dependency controls for spatial effects when estimating the relationship between walking and the built environment (Lee & Moudon, 2006). In contrast, the present research treats spatial autocorrelation, a measurement of spatial dependency, as an explanatory factor. We use spatial autocorrelation as a measure of the spatial coherence of an activity space. Spatial coherence is similar to the urban design quality of coherence that captures the visual order and sense of consistency of the built environment (Ewing et al., 2006). We employ a statistical test to quantify the degree of spatial autocorrelation at the global level. Global statistics provide a single test statistic to describe the degree of the overall spatial autocorrelation and a p value to show if the autocorrelation is greater than would be expected by chance. A positive spatial autocorrelation index value indicates similar attribute values, either high or low, is clustered; an insignificant index value close to 0 indicates that the attribute pattern is indistinguishable from a random spatial process; and, a negative index value indicates dissimilar attributes are arranged in close proximity.
Network autocorrelation statistics analyze dependency among attributes distributed within a network (Peeters & Thomas, 2009; Black, 1998). Rather than measuring dependency based on spatial distance, these statistics use connectivity among links in the network. This is more appropriate for phenomena such as walkability that are conditioned by a street network rather than planar (continuous) space.
3. Methodology
3.1. Overview
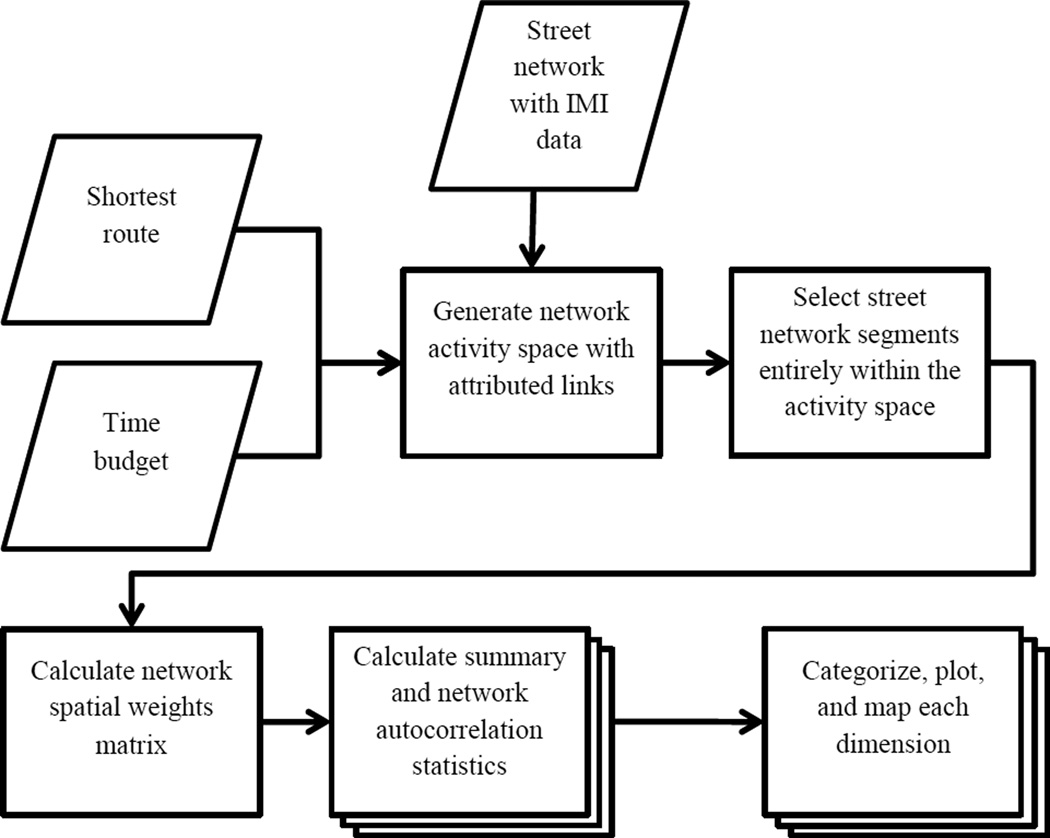
The methods in this paper provide a basis for assessing walkability within street network-based activity spaces. Figure 2 provides a summary of the workflow. We first estimate individual activity spaces within a street network based on the shortest path between known trip endpoints and an assumed time budget for travel. Using the street block walkability scores (such as a single walkability attribute or a composite dimension), we estimate summary and network autocorrelation statistics for each activity space. We plot and map these activity space summary measures to compare the walkability of the built environment of these spaces within the study area.
Figure 2.
Workflow for the construction and analysis of activity space walkability.
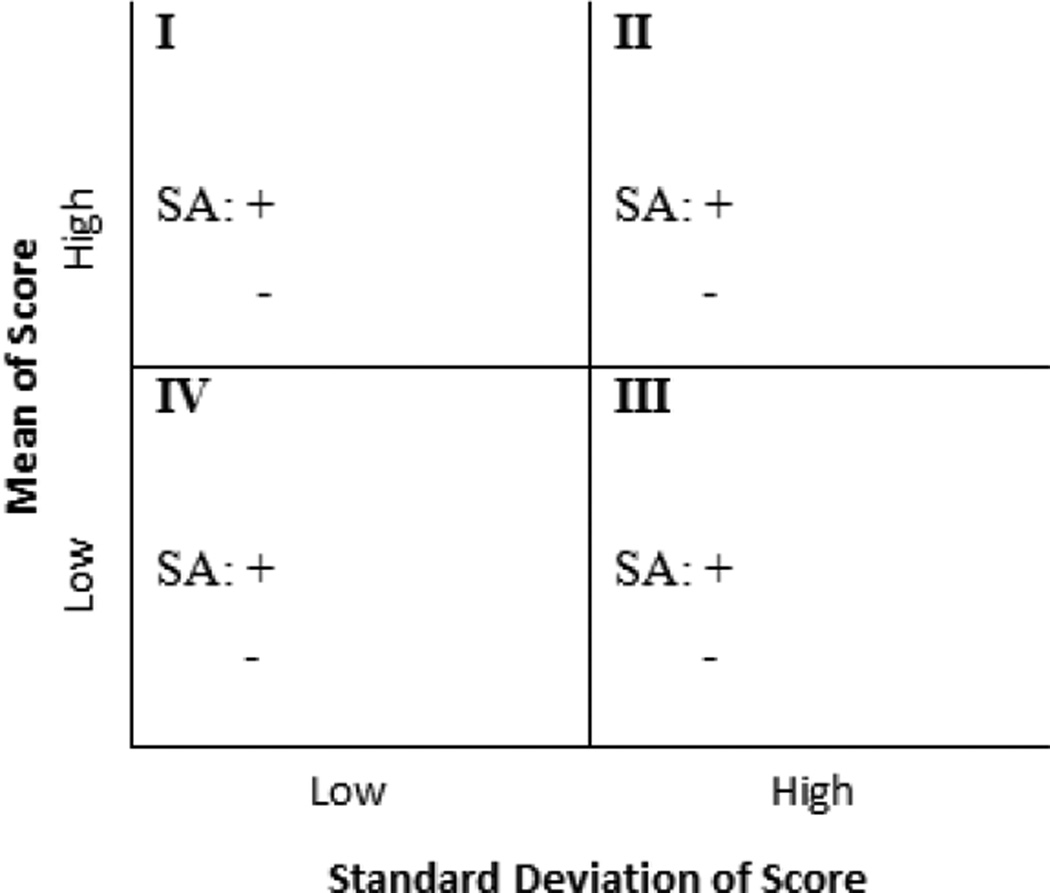
We estimate three summary measures for walkability within each activity space: i) the average walkability score indicating the general level of walkability within the activity space; ii) the standard deviation indicating the variation in walkability across segments, and; iii) the network autocorrelation indicating the spatial coherence of walkability within the activity space. Figure 3 provides a conceptual framework for these activity space summary measures. Quadrant I is the most desirable, since it has an above average mean score and a below average standard deviation, implying that it is an overall high level of walkability. If the spatial autocorrelation index is positive, then the walkability in this region also has spatial coherence; this is also beneficial. Quadrant II indicates a high average walkability and a high standard deviation. This is the second most desirable situation because although there is a high average level of walkability there is also more variability than Quadrant I, meaning there are some less walkable blocks. If spatial autocorrelation is positive, there is spatial coherence involving high and low walkability regions. This is more desirable than a negative spatial autocorrelation index indicating low spatial coherence: a checkerboard-like pattern of high and low walkability blocks. Quadrant III is the third most desirable situation since it has low average walkability but high variance that allows for some higher walkability. Interpretation of spatial autocorrelation indices in this region is similar to Quadrant II.. Quadrant IV is the least desirable situation: it has low average and low variance meaning it is consistently poor for walking. The positive spatial autocorrelation index in this region is similar to Quadrant III, however, because the mean score is below average, the clusters are more likely to be of low scores. The negative spatial autocorrelation index is interpreted the same as the other regions.
Figure 3.
Conceptual classification of activity space summary measures (SA: spatial autocorrelation; +: positive spatial autocorrelation index; −: negative spatial autocorrelation index)
3.2. Data
The data for this project are from the Moving Across Places Study (MAPS) in Salt Lake City, Utah, USA. This project assesses walkability and walking behavior before and after a complete streets intervention that includes the construction of a new light rail line, new bicycle lanes, improved landscaping, and widened sidewalks. The GIS street network is a dissolved version of the Salt Lake County street centerline database. We attribute this network with IMI data collected for each block by trained research assistants. We use US Census block groups from the 2010 Census. The MAPS study also involves collecting GPS and accelerometer data from several hundred participants for a minimum of 10 hours per day over at least three days both before and after the complete streets intervention.
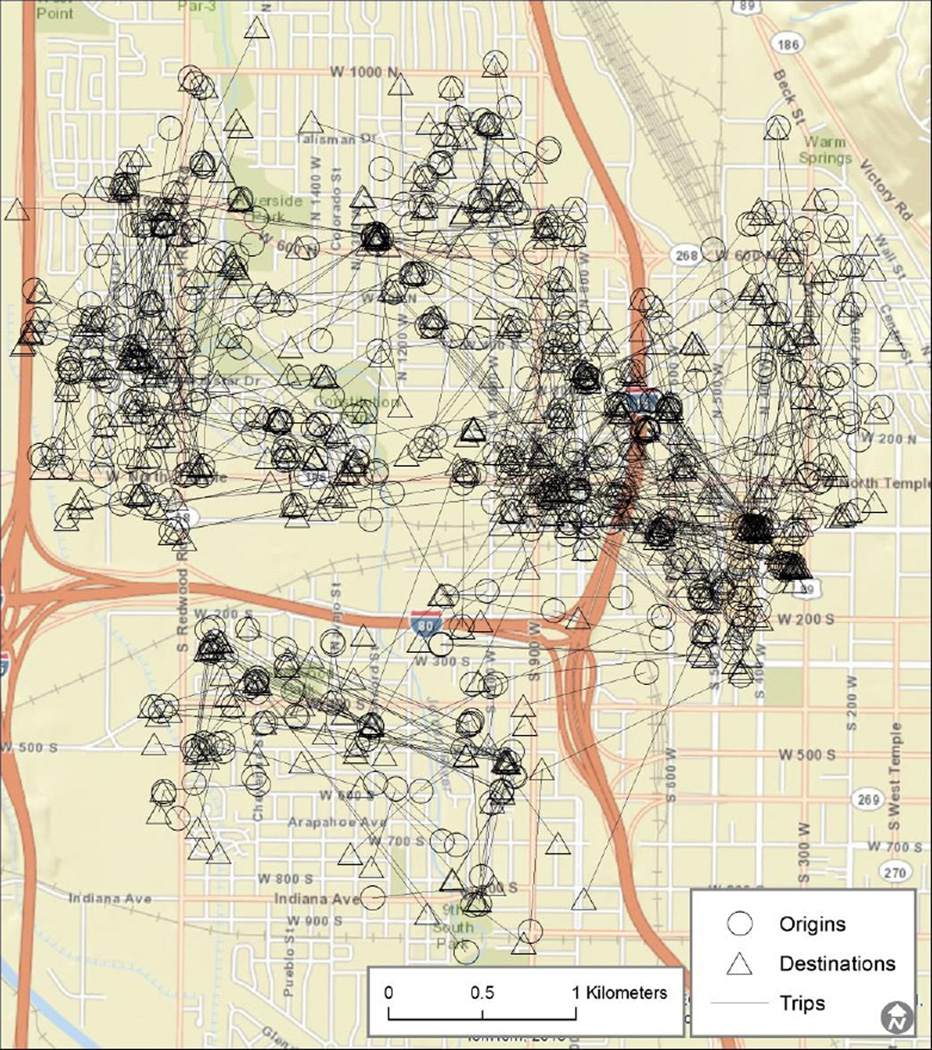
The data in this paper involve 577 walking trips within the study area. Figure 4 illustrates the distribution of the origins and destinations, geographically masked to preserve confidentiality of the study participants using random point perturbation, with a minimum distance threshold to achieve a minimum k-anonymity value of 20 (a participant is indistinguishable from at least 20 neighbors; Zimmerman, et al., 2010). Although we have GPS traces, we do not know the time budgets for these walking trips; these data were not collected. Obtaining data on time budgets requires measuring the amount of time available for the travel and activity; this may be greater than the time spent on an observed trip. Collecting these data requires behavioral survey questions that were not essential to the primary project objectives. Therefore, these were not included to manage the survey experience of participants. We treat this as an input parameter and use a time budget of 150 percent of the shortest path. As mentioned above, time budgets can be manipulated as part of a scenario modeling process. We also assume an average adult walking speed of 1.09 m/s to construct the activity spaces between the trip origins and destinations.
Figure 4.
Study Area displaying 577 walking trip origins and destinations with generalized trip lines (the origins and destinations are geographically masked, details in the text)
We use six previously defined walkability dimensions corresponding to aggregations of subsets of the 162 IMI elements; these dimensions are Attractiveness (“features that enhance the pleasure of walking”), Crime Safety (“high levels of outdoor lighting and well-maintained buildings, and the absence of ‘incivilities’ or cues of danger from crime”), Density (“number of people who could live in an area”), Diverse Destinations (“kinds of public buildings, shops, or services, … and excludes unpleasant destinations”), Pedestrian Access (“ease of walking … and the absence of barriers to walking”), and Traffic Safety (“how safe it is for pedestrians to cross the street”). (For a full description of these dimensions, see Werner et al., 2010). We normalized the IMI elements by removing variables with no variance, converting to z-scores and Winsorising these scores (limiting the extreme values) (Howell, 2010). We constructed the composite dimensions from the z-scores using equal weights for each element. The number of elements varies by dimension; for example the Attractiveness dimension has 25 elements, such as the presence of parks, coffee shops, benches, and public art. Litter, graffiti, and outdoor lighting are some of the elements that comprise the 11 items of the Crime Safety dimension (all items are available in Boarnet et al., 2006).
3.3. Implementation
We implement these methods using open source Python scripting and the ArcPy package with ArcGIS ArcMap10.1. Data preparation requires creating a network dataset in ArcGIS from a road network feature class and attributing it with walkability scores. A network dataset defines the topological relationships between streets in the study area to represent the actual street network connectivity. We edit this network to remove streets that are prohibited for pedestrians (such as interstate highways). The addition of the IMI to the street network is straightforward: the scores are recorded at the street segment-level, so each observation is joined to the related segment in the street network. The limitation of street network data as a basis for walkability is that some pedestrian paths (especially informal paths such as through alleys and fields) may not be captured. Some sections of the network have been updated to include informal paths evident from field observation, but the full extent of informal paths or their effect on the validity of street network-based analysis is not known.
Creating an activity space requires constructing a potential path tree from the street network. The first step, given an origin, destination, and time budget, is to attribute the network with the total travel time from the origin to each of the nodes and then to the destination. Nodes not reachable within the given time budget are designated as 0. Next, we select the nodes with non-zero times to serve as the basis for the selection of the associated network links; these comprise the activity space. To calculate the spatial autocorrelation statistic, we construct a spatial weights matrix. The specific form for this application is an adjacency matrix where an element aij = 1 if the links i,j are connected; 0 otherwise. The final step converts the adjacency matrix to a spatial weights matrix for use in the global Moran’s I tool in ArcGIS, with the weights row standardized. The outputs of the tool are the desired test statistic and p-value; these are appended to a table summarizing the walkability dimension for each activity space.
The assessment of the IMI data aggregated at the Census block group level requires a spatial selection of the street blocks that are within each block group and summarizing the walkability dimensions. The spatial autocorrelation is calculated similarly as for the activity space, with the adjacency matrix generated from the street network that falls within each block group.
4. Results
4.1. Visualizing activity space summary measures
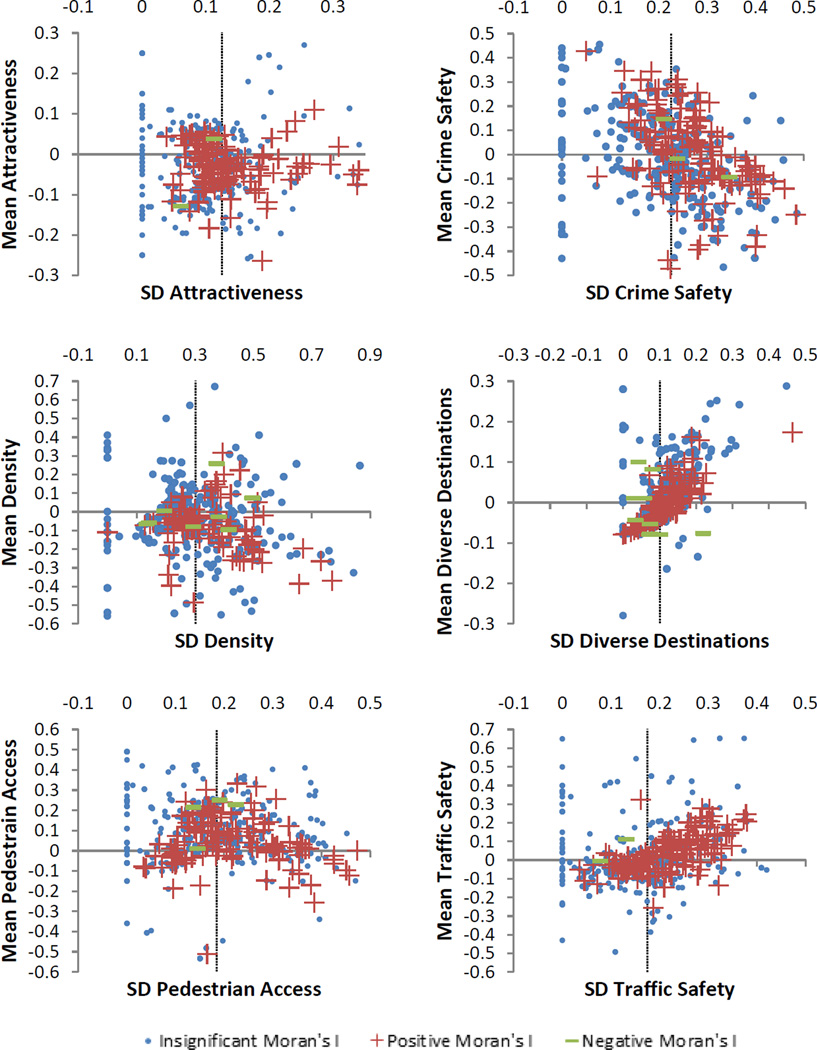
Figure 5 visualizes the six walkability dimensions for the activity spaces generated from the Salt Lake City dataset using the conceptual framework described above. In general, each dimension has many cases that exhibit significant positive spatial autocorrelation at the p < 0.1 level, but very few cases that exhibit significant negative spatial autocorrelation. The dimensions with the most sample points in Quadrant I are Attractiveness, Crime Safety, and Density; these dimensions are also evenly distributed across quadrants. Diverse Destinations, Pedestrian Access, and Traffic Safety dimensions are not as evenly distributed across the quadrants. There are very few activity spaces measured by the Diverse Destination dimension in Quadrant I. This reflects the homogeneity of the walking environment with respect to the activity spaces. Conversely, few activity spaces are classified in Quadrant IV with respect to the Pedestrian Access dimension. This suggests that the majority of walking trips in these neighborhoods have good walking infrastructure amenities with respect to potential walking paths.
Figure 5.
Plots of standard deviations (SD) of walkability dimensions verse dimension means for activity spaces. Spatial autocorrelation is indicated by legend.
4.2. Mapping activity space summary measures
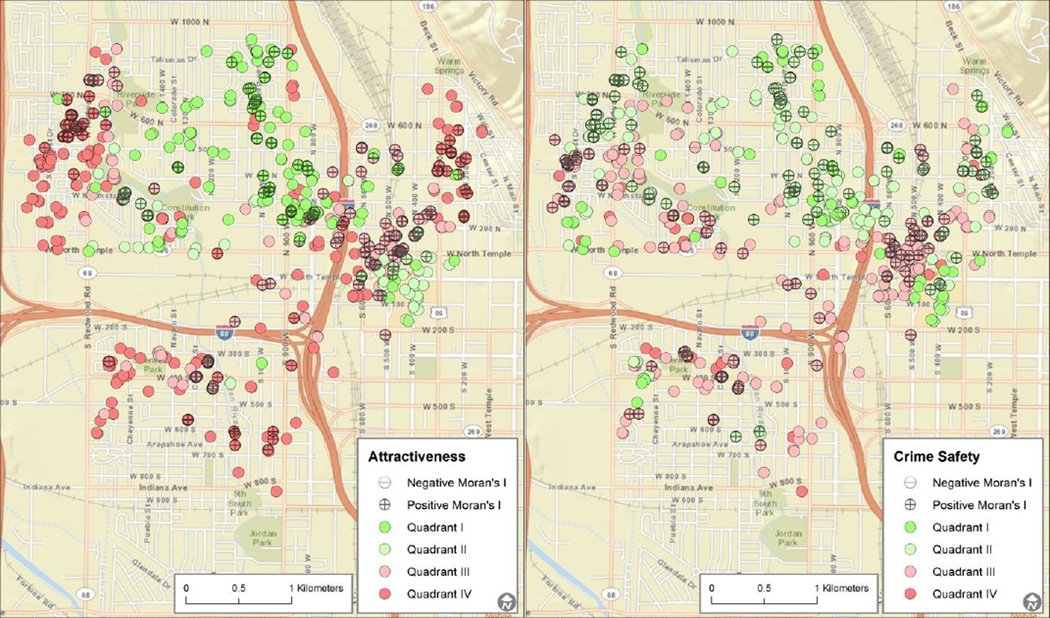
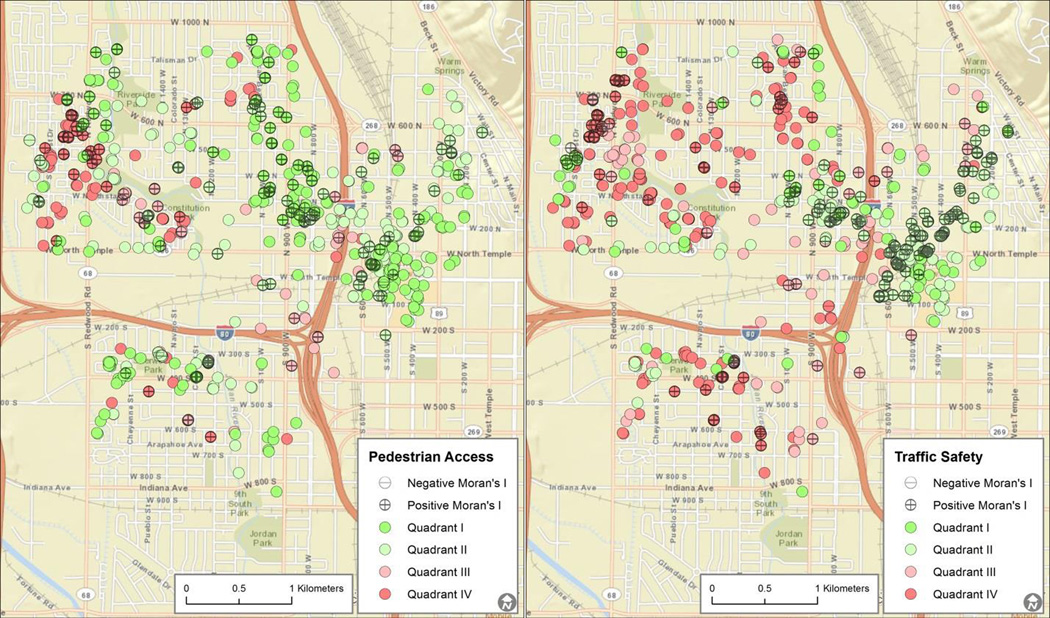
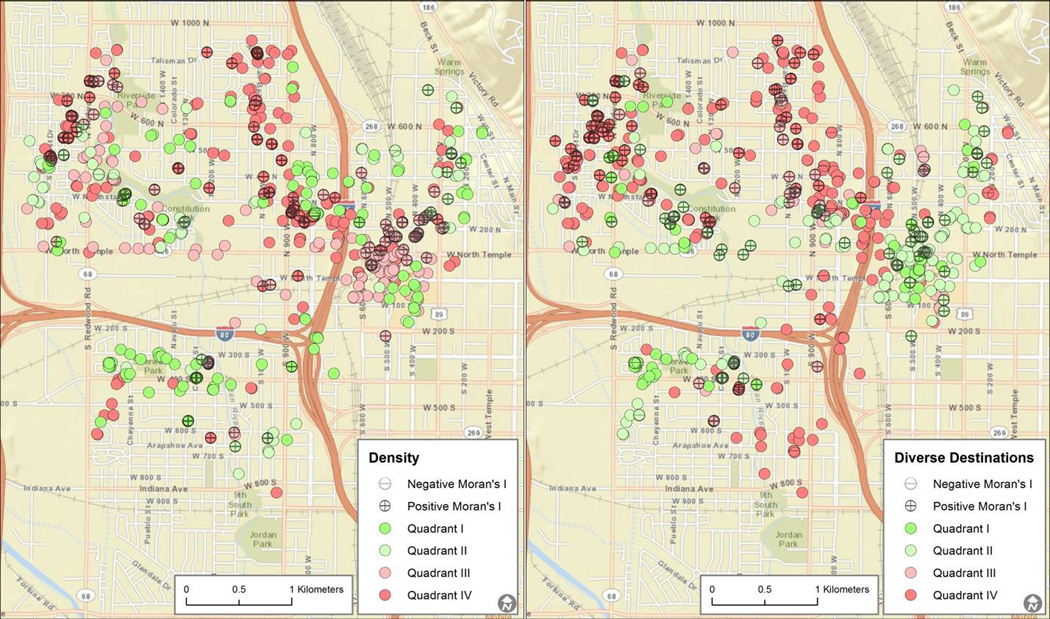
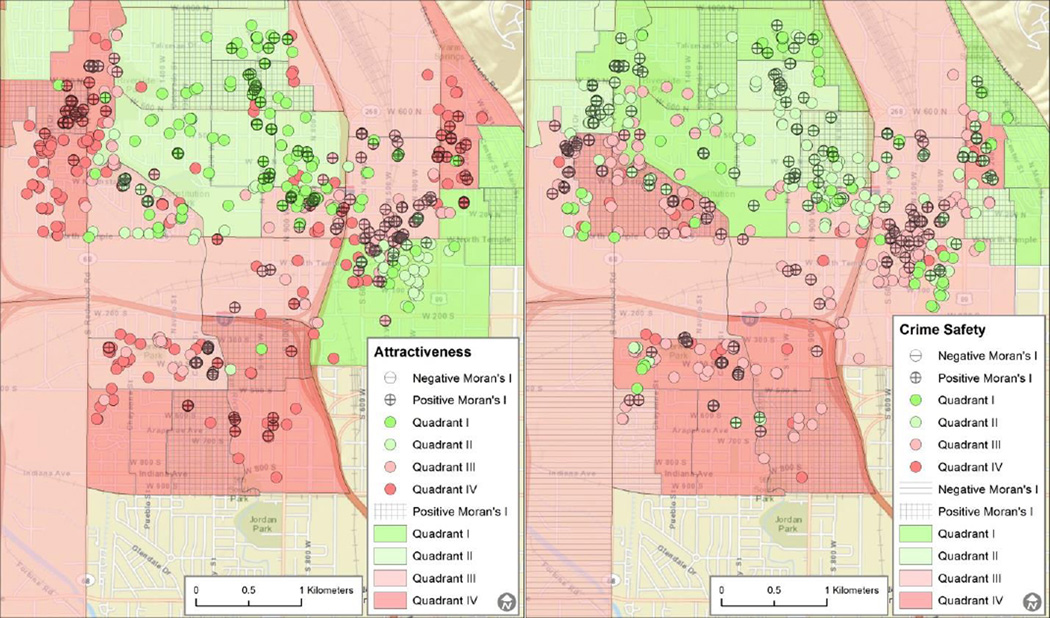
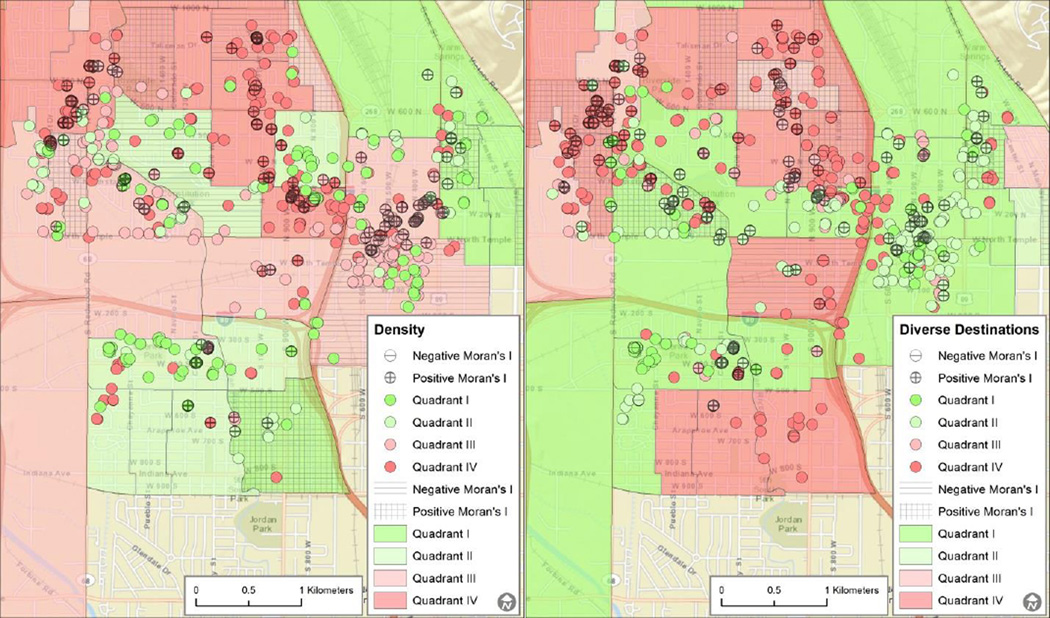
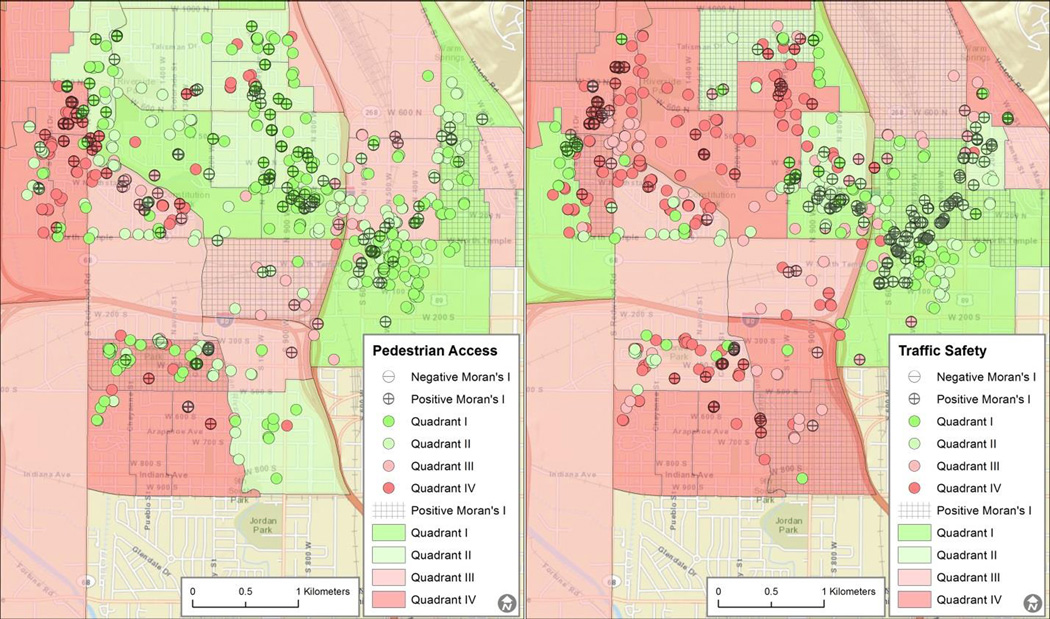
Figures 6–8 provide the maps of the results from Figure 5, with the activity spaces geographically located. The points represent the geographic centers of the activity spaces for display simplicity; their colors indicate their quadrant. Uniform colored points indicate geographic clustering of the activity spaces classifications. For example, the Attractiveness and Crime Safety dimensions (Figure 6) show clear spatial clustering, while Density and Traffic Safety (Figures 7 and 8, respectively) display more spatial heterogeneity. Another result of this method is that it highlights the varying extent of the spatial clustering, which is dependent on the specific dimension some dimensions have larger spatial areas of agreement than others. In the Pedestrian Access dimension (Figure 8), the spatial extent of the clustering covers a large area across neighborhoods (predominantly green points in much of the neighborhood). In contrast, Crime Safety has a similar variation around the mean score as Pedestrian Access (Figure 5), but the resulting spatial variation is quite different. The spatial variation of the values of the Crime Safety dimension (Figure 6) exhibits smaller clusters of similar values than Pedestrian Access. Specifically, the activity spaces falling in Quadrant I of Pedestrian Access span a large, continuous portion of the study area.
Figure 6.
Attractiveness (left) and Crime Safety (right). Moran’s I significant at p < 0.1
Figure 8.
Pedestrian Access (left) and Traffic Safety (right). Moran’s I significant at p < 0.1
Figure 7.
Density (left) and Diverse Destinations (right). Moran’s I significant at p < 0.1
The interpretation of the Moran’s I is in conjunction with the quadrant classification. For example, in Figure 6 the Attractiveness map has positive Moran’s I overlaid on the different Quadrants, such that on top of Quadrant I the interpretation is that the activity space has high average Attractiveness, low variation, and high coherence of the Attractiveness dimension among neighboring street blocks. When the positive score of Moran’s I of an activity space is in Quadrant IV, it is interpreted as also being coherent, but the coherence is describing the low average Attractiveness and high variation.
4.3. Comparing summary measures for activity space versus Census block groups
The plots and maps above suggest that the summary measures can distinguish between different types of walkability environments that correspond to regular geographic patterns. We now examine whether these measures are different when defined for activity spaces versus abstract administrative units such as census block groups.
Figures 9, 10, and 11 display the previous discussed activity space summary measures on top of block groups that are classified in the same way for each dimension. While there is some agreement between the classification of activity spaces and block groups with respect to the walkability classes defined above, there are notable areas of disagreement. This underscores some of the problematic issues of using block groups as the spatial unit to summarize walkability dimensions. First, the mismatch of the classification of activity spaces and block groups shows that effect of the arbitrariness of block group boundaries with regards to walking trips. For example, some activity spaces are classified in Quadrant I of the Attractiveness dimension (Figure 9), but fall in Quadrant III of the block group classification. There are a few explanations for this mismatch. First, the walking trips may be in a small portion of blocks within the block group that allow it to be classified as Quadrant I in the activity space, but the overall block group score is Quadrant III. This pattern would be consistent with the idea that pedestrians seek out relatively more attractive routes within the area. Another explanation is that some of the trip is outside of the block group, such as in adjacent block groups that have a higher quadrant classification. Finally, the disagreement between the classifications at the two different spatial scales varies by the walkability dimension and the size of the block group.
Figure 9.
Comparison of Attractiveness (left) and Crime Safety (right) activity spaces and block groups
Figure 10.
Comparison of Density (left) and Diverse Destinations (right) activity spaces and block groups
Figure 11.
Comparison of Pedestrian Access (left) and Traffic Safety (right) activity spaces and block groups
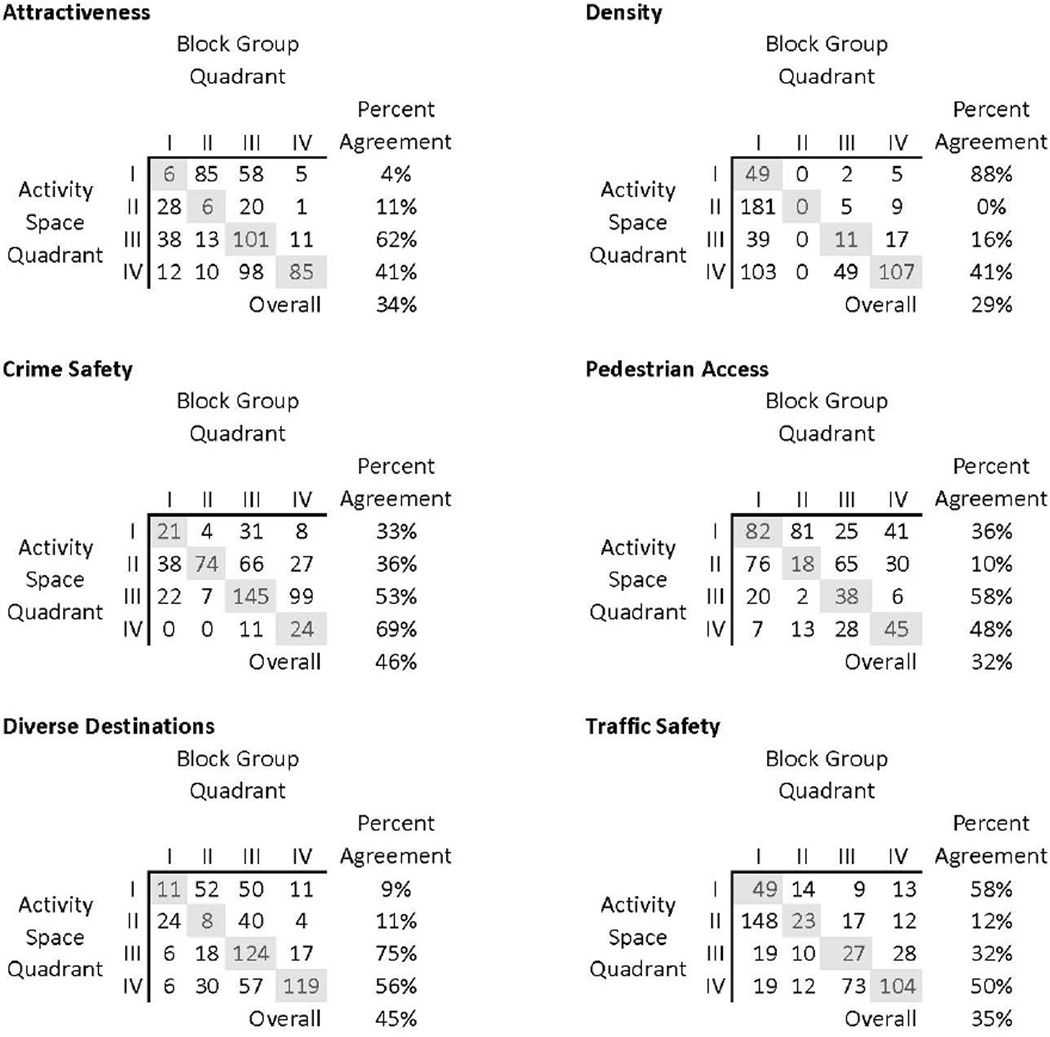
Figure 12 provides confusion matrices that summarize the agreement of the quadrant classifications of the activity spaces and the block groups. The rows correspond to the activity space classification while the columns correspond to block group classification. Each matrix element is the number of classifications. Perfect agreement between activity space and block group classification would be indicated by a matrix with non-zero elements along the diagonal and all zero elements in the off diagonal. Higher numbers in the off-diagonal indicate more disagreement between the two levels of aggregation. The row percentages are the number of activity spaces that are correctly classified by the coincident block group quadrant. The overall agreement is the sum of the diagonal over the total number of activity spaces. The overall agreement ranges from 29% for the Density dimension to 46% for the Crime Safety dimension, but there are large variations between quadrants within individual dimensions. For example, 0% of the Quadrant II activity spaces agreed with the Quadrant II block groups, whereas 88% of Quadrant I in the same dimension agreed. This suggests that activity spaces provide a different portrayal of walkability than the census block group geography.
Figure 12.
Confusion matrices for activity spaces and the block groups with percent agreement between the Activity Space Quadrant classification and the Block Group Quadrant classification.
5. Discussion and Conclusion
5.1 Contributions
This paper develops methods for summarizing built environment walkability measures within geography regions that are non-arbitrary and behaviorally relevant. This involves two contributions: 1) methods to succinctly compare and assess walkability variables or dimensions within defined geographic regions, and 2) the application of the concept of activity spaces as the geographic units for summarizing the built environment attributes.
The first contribution is the use of three summary measures combined with a conceptual framework that allows regions to be mapped into ordinal classes based on their distribution of walkability attributes. Average walkability summarizes the overall level of walkability, standard deviation captures the variation from that overall level and spatial autocorrelation summarizes the spatial coherence of the walkability distribution. The spatial autocorrelation measure (i.e., Moran’s I) add to these measures by statistically assessing the degree of walkability dimension clusters within activity spaces. Rather than treating autocorrelation as an effect to be controlled, we argue that this measure is useful to assess spatial coherence across the activity space. This coherence measure describes the spatial association of the walkability dimensions between blocks, which may better associate the walkability dimension measurements with how they are experienced by pedestrians- as street blocks in the context of each other. The framework provides an ordinal classification based on these three measures, with regions displaying high average walkability, low standard deviation and high spatial autocorrelation having the best walkability, and regions having low average, low standard deviation and negative spatial autocorrelation corresponding to the worst walkability environment.
The second main contribution of this research is the construction of activity spaces as the basis for the spatial unit to summarize the walkability dimensions. The activity spaces, in conjunction with the summary measures, provide a spatially detailed, yet simple classification scheme to assess both the numeric and the spatial variability of the walkability dimensions. The visualization of these classifications shows that there is some spatial regularity to these measures but also some heterogeneity. This heterogeneity is due to different trip lengths, which highlights how walkability is dependent on the trip taken, the configuration of the street network, and the simplification used for display. A longer trip may include more street blocks and a potentially more diverse environment, compared to a shorter trip. Also, a more connected street network allows the inclusion of more street blocks to access for a trip, which a network-based summary measure more accurately reflects. The quadrant classified points on the maps represent spatially extensive portions of the network; therefore, activity spaces that appear proximal may in fact have different spatial configurations of street blocks.
Comparison of the activity space summary measures with block group summary measures indicates some agreement, but a great deal of disagreement. This disagreement is visible spatially from the maps and summarized overall by the confusion matrices. This underscores that the block group summary measures do not describe the walkability of their residents very well, but mask considerable variation. This is based on many factors, but the chief among them is the substantial mismatch between the spatial extent of block groups and of walking trips. This method seeks to address this spatial mismatch by providing a more relevant spatial extent to assess walkability, compared to the convenient block group-level spatial unit.
5.2 Limitations
In subsequent research we will explore ways to distinguish robust versus borderline members of each quadrant. The classification of scores into quadrants is relative to what is being measured in the study area. Therefore, what is relatively good in this study area may not appeal to residents from different neighborhoods. One way to address this is the inclusion of travel activity data when assess the suitability of the built environment for active transportation (e.g. Jacques & El-Geneidy, 2014). A limitation of this approach is that the global spatial autocorrelation statistic obscures local clusters and provides an averaged measure of coherence. Additionally, a minimum of 30 spatial units are recommended for validity of the spatial autocorrelation index estimate, which shorter trips or trips in areas with longer blocks may not likely meet. This is one reason the majority of activity spaces have an insignificant spatial autocorrelation index. The estimation of time budgets for activity space generation is a constant percentage of total time; whereas the time budget may vary based on the length of the trip (i.e., longer trips may have a larger percentage and shorter trips has a smaller percentage). Specific routes through the activity spaces and explicit barriers to walkability are not included in this research, but will be explored in future research. The classification of activity spaces into the conceptual quadrants is still sensitive to outliers, despite the Winsorization of the elements.
5.3 Applications and Future research
One application of the activity space method is to add insight into the spatial scale to measure built environment attributes and may inform future collection of built environment data. For example, the Pedestrian Access dimension may be adequately measured at a more coarse scale, due to the observed larger spatial extent of clusters; but, the Diverse Destinations dimension may require a fine grained measure, since the observed clusters are much smaller. This needs further exploration and may additionally depend on trip purpose and resident perceptions. We recognize the limited availability and costly collection of highly detailed, street block-level data. However, in the absence of such data, the activity space method may still be used to generate a more spatially relevant unit to summarize walkability. This may be done with either increasingly available mobile travel data, or to synthesized from potential trips in the neighborhood. Either way, the basis of the activity space on the street network will insure that only the relevant streets for the walking trip are included. Fusion of this activity space with additional data sources may employ dasymmetric methods for areal data (e.g. Zandbergen, 2011), or use of parcel or street network attributes to estimate built environment walkability.
Future research with this methodology will compare the potential advantage of the explanatory power of the effect of the built environment on walking behavior at the spatial unit of the activity space over the block group. The degree that the overestimation or underestimation of the walkability dimensions for residents within block groups effect analysis results needs further exploration and will be tested in future research. Additionally, there is need to explore other aggregation types to construct walkability dimensions and to specify deferential weights of individual elements or dimensions for use in assessing the effect of the built environment on different walking trip purposes. For example, weights may reflect different perceptions based on social types, such as socioeconomic and age groups (Manaugh & El-Geneidy, 2011). This research shows that differences occur between dimensions for specific trips and between neighbors, when assessing the three summary measures of average, standard deviation, and spatial coherence of activity spaces. The inclusion of different weights within activity spaces to reflect perceptions for a particular trip is essential to understanding a more complete relationship between the built environment and walking.
The methods described in this research address a key criticism of assessing the built environment and walking. Specifically, the activity space methods address the MAUP problem that exists in walkability research. Additionally, the three summary measures provide a comprehensible assessment of the large multi-attribute measures of walkability such as the IMI.
Acknowledgements
The project described is supported by grant number C157509 from the National Cancer Institute at the National Institutes of Health and a Dissertation Fellowship from the National Institute for Transportation and Communities.
Literature Cited
- Ahas R, Miller HJ, Witlox F. Mobility, communication and urban space. Journal of Urban Technology. 2014;21:1–7. [Google Scholar]
- Alfonzo MA. To Walk or Not to Walk? The Hierarchy of Walking Needs. Environment and Behavior. 2005;37(6):808–836. [Google Scholar]
- Anselin L. Local Indicators of Spatial Association—LISA. Geographical Analysis. 1995;27(2):93–115. [Google Scholar]
- Berke EM, Koepsell TD, Moudon AV, Hoskins RE, Larson EB. Association of the Built Environment With Physical Activity and Obesity in Older Persons. American Journal of Public Health. 2007;97(3):486–492. doi: 10.2105/AJPH.2006.085837. [DOI] [PMC free article] [PubMed] [Google Scholar]
- Black WR. Network Autocorrelation in Transport Network and Flow Systems. Geographical Analysis. 1992;24(3):207–222. [Google Scholar]
- Boarnet MG, Day K, Alfonzo M, Forsyth A, Oakes M. The Irvine–Minnesota Inventory to Measure Built Environments. American Journal of Preventive Medicine. 2006;30(2):153–159.e43. doi: 10.1016/j.amepre.2005.09.018. [DOI] [PubMed] [Google Scholar]
- Boarnet MG, Forsyth A, Day K, Oakes JM. The Street Level Built Environment and Physical Activity and Walking Results of a Predictive Validity Study for the Irvine Minnesota Inventory. Environment and Behavior. 2011;43(6):735–775. [Google Scholar]
- Brown BB, Smith KR, Hanson H, Fan JX, Kowaleski-Jones L, Zick CD. Neighborhood Design for Walking and Biking. American Journal of Preventive Medicine. 2013;44(3):231–238. doi: 10.1016/j.amepre.2012.10.024. [DOI] [PMC free article] [PubMed] [Google Scholar]
- Brown BB, Werner CM, Amburgey JW, Szalay C. Walkable Route Perceptions and Physical Features Converging Evidence for En Route Walking Experiences. Environment and Behavior. 2007;39(1):34–61. [Google Scholar]
- Brown BB, Yamada I, Smith KR, Zick CD, Kowaleski-Jones L, Fan JX. Mixed land use and walkability: Variations in land use measures and relationships with BMI, overweight, and obesity. Health & Place. 2009;15(4):1130–1141. doi: 10.1016/j.healthplace.2009.06.008. [DOI] [PMC free article] [PubMed] [Google Scholar]
- Brownson RC, Hoehner CM, Day K, Forsyth A, Sallis JF. Measuring the Built Environment for Physical Activity: State of the Science. American Journal of Preventive Medicine. 2009;36(4) Supplement:S99–S123.e12. doi: 10.1016/j.amepre.2009.01.005. [DOI] [PMC free article] [PubMed] [Google Scholar]
- Cerin E, Leslie E, Owen N, Bauman A. Applying GIS in Physical Activity Research: Community “Walkability” and Walking Behaviors. In: Lai PC, Mak ASH, editors. GIS for Health and the Environment. Springer Berlin Heidelberg; 2007a. pp. 72–89. Retrieved from http://link.springer.com/chapter/10.1007/978-3-540-71318-0_6. [Google Scholar]
- Cerin E, Leslie E, Toit L, du, Owen N, Frank LD. Destinations that matter: Associations with walking for transport. Health & Place. 2007b;13(3):713–724. doi: 10.1016/j.healthplace.2006.11.002. [DOI] [PubMed] [Google Scholar]
- Coulton CJ, Korbin J, Chan T, Su M. Mapping Residents’ Perceptions of Neighborhood Boundaries: A Methodological Note. American Journal of Community Psychology. 2001;29(2):371–383. doi: 10.1023/A:1010303419034. [DOI] [PubMed] [Google Scholar]
- Cutts BB, Darby KJ, Boone CG, Brewis A. City structure, obesity, and environmental justice: An integrated analysis of physical and social barriers to walkable streets and park access. Social Science & Medicine. 2009;69(9):1314–1322. doi: 10.1016/j.socscimed.2009.08.020. [DOI] [PubMed] [Google Scholar]
- Day K, Boarnet M, Alfonzo M, Forsyth A. The Irvine–Minnesota Inventory to Measure Built Environments: Development. American Journal of Preventive Medicine. 2006;30(2):144–152. doi: 10.1016/j.amepre.2005.09.017. [DOI] [PubMed] [Google Scholar]
- Duncan MJ, Winkler E, Sugiyama T, Cerin E, duToit L, Leslie E, Owen N. Relationships of Land Use Mix with Walking for Transport: Do Land Uses and Geographical Scale Matter? Journal of Urban Health. 2010;87(5):782–795. doi: 10.1007/s11524-010-9488-7. [DOI] [PMC free article] [PubMed] [Google Scholar]
- Ewing R, Handy S. Measuring the Unmeasurable: Urban Design Qualities Related to Walkability. Journal of Urban Design. 2009;14(1):65–84. [Google Scholar]
- Ewing R, Handy S, Brownson RC, Clemente O, Winston E. Identifying and Measuring Urban Design Qualities Related to Walkability. Journal of Physical Activity & Health. 2006;3:S223–S240. doi: 10.1123/jpah.3.s1.s223. [DOI] [PubMed] [Google Scholar]
- Gallimore JM, Brown BB, Werner CM. Walking routes to school in new urban and suburban neighborhoods: An environmental walkability analysis of blocks and routes. Journal of Environmental Psychology. 2011;31(2):184–191. [Google Scholar]
- Gebel K, Bauman AE, Sugiyama T, Owen N. Mismatch between perceived and objectively assessed neighborhood walkability attributes: Prospective relationships with walking and weight gain. Health & Place. 2011;17(2):519–524. doi: 10.1016/j.healthplace.2010.12.008. [DOI] [PubMed] [Google Scholar]
- Getis A. Reflections on spatial autocorrelation. Regional Science and Urban Economics. 2007;37(4):491–496. [Google Scholar]
- Golledge RG, Stimson RJ. Analytical behavioural geography. London: Croom Helm; 1987. pp. 53–53. [Google Scholar]
- Hägerstraand T. What About People in Regional Science? Papers in Regional Science. 1970;24(1):7–24. [Google Scholar]
- Howell DC, Howell DC. Fundamental statistics for the behavioral sciences. 7th ed. Belmont, CA: Wadsworth Cengage Learning; 2011. [Google Scholar]
- Jacques C, El_Geneidy AM. Does travel behavior matter in defining urban form? A quantitative analysis characterizing distinct areas within a region. The Journal of Transport and Land Use. 2014;7(1):1–14. [Google Scholar]
- Kuijpers B, Othman W. Modeling uncertainty of moving objects on road networks via space–time prisms. International Journal of Geographical Information Science. 2009;23(9):1095–1117. [Google Scholar]
- Lee C, Moudon AV. Correlates of Walking for Transportation or Recreation Purposes. Journal of Physical Activity & Health. 2006;3:S77–S98. doi: 10.1123/jpah.3.s1.s77. [DOI] [PubMed] [Google Scholar]
- Lee C, Moudon AV, Courbois J-YP. Built Environment and Behavior: Spatial Sampling Using Parcel Data. Annals of Epidemiology. 2006;16(5):387–394. doi: 10.1016/j.annepidem.2005.03.003. [DOI] [PubMed] [Google Scholar]
- Leslie E, Coffee N, Frank L, Owen N, Bauman A, Hugo G. Walkability of local communities: Using geographic information systems to objectively assess relevant environmental attributes. Health & Place. 2007;13(1):111–122. doi: 10.1016/j.healthplace.2005.11.001. [DOI] [PubMed] [Google Scholar]
- Manaugh K, El-Geneidy A. Validating walkability indices: How do different households respond to the walkability of their neighborhood? Transportation Research Part D: Transport and Environment. 2011;16(4):309–315. [Google Scholar]
- Miller HJ. Measuring Space-Time Accessibility Benefits within Transportation Networks: Basic Theory and Computational Procedures. Geographical Analysis. 1999;31(1):1–26. [Google Scholar]
- Mitra R, Buliung RN. Built environment correlates of active school transportation: neighborhood and the modifiable areal unit problem. Journal of Transport Geography. 2012;20(1):51–61. [Google Scholar]
- Moudon AV, Lee C. Walking and Bicycling: An Evaluation of Environmental Audit Instruments. American Journal of Health Promotion. 2003;18(1):21–37. doi: 10.4278/0890-1171-18.1.21. [DOI] [PubMed] [Google Scholar]
- Moudon AV, Lee C, Cheadle AO, Garvin C, Johnson D, Schmid TL, Lin Lin. Operational Definitions of Walkable Neighborhood: Theoretical and Empirical Insights. Journal of Physical Activity & Health. 2006;3:S99–S117. doi: 10.1123/jpah.3.s1.s99. [DOI] [PubMed] [Google Scholar]
- Peeters D, Thomas I. Network Autocorrelation. Geographical Analysis. 2009;41(4):436–443. [Google Scholar]
- Purciel M, Neckerman KM, Lovasi GS, Quinn JW, Weiss C, Bader MDM, Rundle A. Creating and validating GIS measures of urban design for health research. Journal of Environmental Psychology. 2009;29(4):457–466. doi: 10.1016/j.jenvp.2009.03.004. [DOI] [PMC free article] [PubMed] [Google Scholar]
- Rundle AG, Bader MDM, Richards CA, Neckerman KM, Teitler JO. Using Google Street View to Audit Neighborhood Environments. American Journal of Preventive Medicine. 2011;40(1):94–100. doi: 10.1016/j.amepre.2010.09.034. [DOI] [PMC free article] [PubMed] [Google Scholar]
- Saelens BE, Sallis JF, Frank LD. Environmental correlates of walking and cycling: Findings from the transportation, urban design, and planning literatures. Annals of Behavioral Medicine. 2003;25(2):80–91. doi: 10.1207/S15324796ABM2502_03. [DOI] [PubMed] [Google Scholar]
- Sallis JF, Frank LD, Saelens BE, Kraft MK. Active transportation and physical activity: opportunities for collaboration on transportation and public health research. Transportation Research Part A: Policy and Practice. 2004;38(4):249–268. [Google Scholar]
- Schlossberg M. From TIGER to Audit Instruments: Measuring Neighborhood Walkability with Street Data Based on Geographic Information Systems. Transportation Research Record: Journal of the Transportation Research Board. 2006;1982(1):48–56. [Google Scholar]
- Troped PJ, Wilson JS, Matthews CE, Cromley EK, Melly SJ. The Built Environment and Location-Based Physical Activity. American Journal of Preventive Medicine. 2010;38(4):429–438. doi: 10.1016/j.amepre.2009.12.032. [DOI] [PMC free article] [PubMed] [Google Scholar]
- Weinstein Agrawal A, Schlossberg M, Irvin K. How Far, by Which Route and Why? A Spatial Analysis of Pedestrian Preference. Journal of Urban Design. 2008;13(1):81–98. [Google Scholar]
- Werner CM, Brown BB, Gallimore J. Light rail use is more likely on “walkable” blocks: Further support for using micro-level environmental audit measures. Journal of Environmental Psychology. 2010;30(2):206–214. [Google Scholar]
- Yamada I, Brown BB, Smith KR, Zick CD, Kowaleski-Jones L, Fan JX. Mixed Land Use and Obesity: An Empirical Comparison of Alternative Land Use Measures and Geographic Scales. The Professional Geographer. 2012;64(2):157–177. doi: 10.1080/00330124.2011.583592. [DOI] [PMC free article] [PubMed] [Google Scholar]
- Zandbergen PA. Dasymetric Mapping Using High Resolution Address Point Datasets. Transactions in GIS. 2011;15:5–27. [Google Scholar]
- Zimmerman DL, Armstrong MP, Rushton G. Alternative Techniques for Masking Geographic Detail to Protect Privacy. In: Rushton G, Armstrong MP, Gittler J, Greene BR, Pavlik CE, West MM, Zimmerman DL, editors. Geocoding health data: the use of geographic codes in cancer prevention and control, research and practice. CRC Press; 2010. pp. 127–138. [Google Scholar]


