

Abstract
Purpose
The karyotype is a strong independent prognostic factor in myelodysplastic syndromes (MDS). Since the implementation of the International Prognostic Scoring System (IPSS) in 1997, knowledge concerning the prognostic impact of abnormalities has increased substantially. The present study proposes a new and comprehensive cytogenetic scoring system based on an international data collection of 2,902 patients.
Patients and Methods
Patients were included from the German-Austrian MDS Study Group (n = 1,193), the International MDS Risk Analysis Workshop (n = 816), the Spanish Hematological Cytogenetics Working Group (n = 849), and the International Working Group on MDS Cytogenetics (n = 44) databases. Patients with primary MDS and oligoblastic acute myeloid leukemia (AML) after MDS treated with supportive care only were evaluated for overall survival (OS) and AML evolution. Internal validation by bootstrap analysis and external validation in an independent patient cohort were performed to confirm the results.
Results
In total, 19 cytogenetic categories were defined, providing clear prognostic classification in 91% of all patients. The abnormalities were classified into five prognostic subgroups (P < .001): very good (median OS, 61 months; hazard ratio [HR], 0.5; n = 81); good (49 months; HR, 1.0 [reference category]; n = 1,809); intermediate (26 months; HR, 1.6; n = 529); poor (16 months; HR, 2.6; n = 148); and very poor (6 months; HR, 4.2; n = 187). The internal and external validations confirmed the results of the score.
Conclusion
In conclusion, these data should contribute to the ongoing efforts to update the IPSS by refining the cytogenetic risk categories.
INTRODUCTION
Myelodysplastic syndromes (MDS) are clonal hematopoietic stem-cell disorders1,2 characterized by ineffective hematopoiesis and increased apoptosis,3 resulting in peripheral cytopenias.4 Acquired cytogenetic aberrations are well established as independent prognostic factors in MDS.5–10 Initiated by the Bournemouth score in 1985,11 several scoring systems for MDS were proposed6,12,13 before culminating in the internationally accepted standard risk assessment system in MDS: the International Prognostic Scoring System (IPSS).8 On the basis of the cytogenetic component of the IPSS, 86% of all cytogenetic findings can be explicitly classified according to their prognostic impact. The remaining 14% of patients show cytogenetic abnormalities with unknown prognostic significance. This finding underscores two major cytogenetic classification problems in MDS, namely, the profound heterogeneity of acquired cytogenetic aberrations in MDS, and the associated challenge of designing a comprehensive cytogenetic scoring system that predicts the prognostic impact of rare abnormalities. Furthermore, many abnormalities can occur as an isolated abnormality or in combination with one (ie, double abnormalities) or several other aberrations within a complex abnormal karyotype, defined as three or more abnormalities.14 Within the past decade, analyses of large patient cohorts have led to an increasing knowledge of isolated abnormalities.8–10 Nevertheless, few data exist about pairwise combinations of abnormalities or their prognostic relevance, resulting in prognostic uncertainty.8,10
Recent studies have provided evidence for the existence of prognostically different subgroups among patients with complex abnormal karyotypes.9,10,15,16 Subsets of patients with various patterns of complex karyotypes, according to number of abnormalities, make it evident that prognosis in these patients deteriorates with increasing numbers of abnormalities, reflecting the clonal evolution and genetic instability of the clone.10 The prognostic classification of rare abnormalities remains a challenge. The presence of rare cytogenetic abnormalities is not unusual in MDS and occurs most frequently in complex karyotypes.17 In the absence of sufficient data, the IPSS combines rare abnormalities into the intermediate cytogenetic risk group. Hence, the objective of the present study was to develop a cytogenetic scoring system that incorporates the extensive variability of abnormalities in MDS, leading to an applicable tool to improve the prognostic impact of cytogenetic abnormalities in MDS and, possibly, providing a foundation for the upcoming IPSS revision.
PATIENTS AND METHODS
Patient Cohort
From four different databases, 2,902 patients were included. Databases used were those of the German-Austrian MDS Study Group (GA; n = 1,193; 41.1%),10 International MDS Risk Analysis Workshop (IMRAW; n = 816; 28.1%),8 Spanish Hematological Cytogenetics Working Group (n = 849; 29.3%),9 and International Working Group on MDS Cytogenetics (n = 44; 1.5%).17 GA patients were from four institutions in Germany (University of Düsseldorf, Düsseldorf; University of Göttingen, Göttingen; University of Freiburg, Freiburg; and Johannes-Hospital Duisburg, Duisburg) and four in Austria (University of Vienna; Hanusch Hospital, Vienna; Elisabethinen Hospital, Linz; Innsbruck Medical University, Innsbruck). The International Working Group on MDS Cytogenetics contributed patient cases involving rare abnormalities from the City of Hope Hospital (Duarte, CA), Tokyo Medical University (Tokyo, Japan), and Hospital del Mar Research Institute (Barcelona, Spain).17 Only patients with primary MDS and oligoblastic AML after MDS meeting the following criteria were included: age 16 years or older; bone marrow blast count of 30% or less; and treated with supportive care, allowing for short (≤ 3 months) courses of oral chemotherapy or application of steroids, danazol, hematopooietic growth factors, or amifostine. Cytogenetic and clinical data for patients from IMRAW, GA, and Spanish Hematological Cytogenetics Working Group were reported previously.8–10 To validate the score, an independent patient cohort including 1,632 patients with primary untreated MDS from the MD Anderson Cancer Center (MDA; Houston, TX) was analyzed.
The study was conducted in accordance with the modified Declaration of Helsinki. Additional data concerning the test and validation cohorts are listed in Table 1.
Table 1.
Patient Demographics and Clinical Characteristics
| Characteristic | Database Test Set |
Validation Set |
||||||||||
|---|---|---|---|---|---|---|---|---|---|---|---|---|
| Total (test set) |
GA |
GCECGH |
IMRAW |
IWCG |
MDA |
|||||||
| No. | % | No. | % | No. | % | No. | % | No. | % | No. | % | |
| Total patients | 2,902 | 1,193 | 41.1 | 849 | 29.3 | 816 | 28.1 | 44 | 1.5 | 1,632 | ||
| Sex | ||||||||||||
| Male | 1,695 | 58.4 | 685 | 57.4 | 475 | 55.9 | 504 | 61.8 | 31 | 70.5 | 1,096 | 67.2 |
| Female | 1,207 | 41.6 | 508 | 42.6 | 374 | 44.1 | 312 | 38.2 | 13 | 29.5 | 536 | 32.8 |
| Age, years | ||||||||||||
| < 60 | 686 | 23.9 | 298 | 25.3 | 169 | 20.2 | 205 | 25.1 | 14 | 31.8 | 554 | 34.0 |
| ≥ 60 | 2,188 | 76.1 | 879 | 74.4 | 668 | 79.8 | 611 | 74.9 | 30 | 68.2 | 1,078 | 66.0 |
| Median | 70 | 69 | 71.0 | * | 69.0 | 66.0 | ||||||
| Range | 16-96 | 16-96 | 16-95 | * | 22-86 | 16-94 | ||||||
| Classification† | ||||||||||||
| FAB | ||||||||||||
| RA | 650 | 22.4 | 184 | 15.4 | 169 | 19.9 | 294 | 36.0 | 3 | 6.8 | 0 | 0.0 |
| RARS | 296 | 10.2 | 80 | 6.7 | 90 | 10.6 | 126 | 15.4 | 0 | 0.0 | 0 | 0.0 |
| RAEB | 333 | 11.5 | 124 | 10.4 | 1 | 0.1 | 208 | 25.5 | 0 | 0.0 | 0 | 0.0 |
| RAEB-T | 138 | 4.8 | 77 | 6.5 | 0 | 0.0 | 61 | 7.5 | 0 | 0.0 | 0 | 0.0 |
| CMML | 314 | 10.8 | 189 | 15.8 | 0 | 0.0 | 125 | 15.3 | 0 | 0.0 | 0 | 0.0 |
| WHO | ||||||||||||
| RA | 89 | 3.0 | 48 | 4.0 | 19 | 2.2 | * | 22 | 50.0 | 314 | 19.2 | |
| RARS | 62 | 2.1 | 29 | 2.4 | 32 | 3.8 | 1 | 2.3 | 112 | 6.9 | ||
| RCMD | 193 | 6.7 | 151 | 12.7 | 37 | 4.4 | 5 | 11.4 | 109 | 6.7 | ||
| RCMD-RS | 93 | 3.2 | 68 | 5.7 | 25 | 2.9 | 0 | 0.0 | 32 | 2.0 | ||
| RAEB-1 | 158 | 5.4 | 61 | 5.1 | 89 | 10.5 | 8 | 18.2 | 293 | 18.0 | ||
| RAEB-2 | 223 | 7.7 | 77 | 6.5 | 144 | 17.0 | 2 | 4.5 | 465 | 28.5 | ||
| 5q− syndrome | 95 | 3.3 | 68 | 5.7 | 27 | 3.2 | 0 | 0.0 | 6 | 0.4 | ||
| CMML-1 | 88 | 3.0 | 8 | 0.7 | 80 | 9.4 | 0 | 0.0 | 92 | 5.6 | ||
| CMML-2 | 68 | 2.3 | 3 | 0.3 | 65 | 7.7 | 0 | 0.0 | 32 | 2.0 | ||
| AML | 79 | 2.7 | 15 | 1.3 | 64 | 7.5 | 0 | 0.0 | 153 | 9.4 | ||
| Unclassified | 10 | 0.3 | 0 | 0.0 | 7 | 0.8 | 3 | 6.8 | 12 | 0.7 | ||
| No WHO or FAB classification | 13 | 0.4 | 11 | 0.9 | 0 | 0.0 | 2 | 0.2 | 0 | 0.0 | 12 | 0.7 |
| Bone marrow blasts, % | ||||||||||||
| < 5 | 1,599 | 57.3 | 634 | 56.4 | 483 | 56.9 | 482 | 59.1 | * | 699 | 42.8 | |
| 5-10 | 577 | 20.7 | 224 | 19.9 | 170 | 20.0 | 183 | 22.5 | 439 | 26.9 | ||
| 11-20 | 429 | 15.4 | 171 | 15.3 | 143 | 16.8 | 114 | 14.0 | 370 | 22.7 | ||
| 21-30 | 184 | 6.6 | 95 | 8.4 | 53 | 6.2 | 36 | 4.4 | 124 | 7.6 | ||
| Cytopenias | ||||||||||||
| Hb, g/dL | ||||||||||||
| Median | 9.6 | 9.6 | 9.5 | 9.7 | * | 9.7 | ||||||
| Range | 0.9-18.9 | 2.5-16.7 | 1.3-18.9 | 0.9-16.6 | 3.2-27.7 | |||||||
| ANC, ×103/μL | ||||||||||||
| Median | 2.1 | 2.0 | 2.2 | 2.0 | 1.5 | |||||||
| Range | 0-85.0 | 0.1-46.8 | 0-85.0 | 0-46.8 | 0-45.5 | |||||||
| PLT, ×103/μL | ||||||||||||
| Median | 124 | 105 | 124 | 132 | 73 | |||||||
| Range | 0-1371 | 3-1,371 | 4-1,240 | 0-999 | 1-1,200 | |||||||
| Observation time, months | ||||||||||||
| Median | 50.0 | 55.9 | 37.5 | 67.2 | 40.9 | 53.2 | ||||||
| Range | 0.1-326 | 0.1-326 | 0.1-289 | 0.1-206 | 0.2-262 | 0.1-258 | ||||||
| IPSS | ||||||||||||
| Low risk | 574 | 29.5 | 77 | 20.8 | 224 | 29.1 | 273 | 34.0 | * | 301 | 18.4 | |
| Intermediate 1 | 763 | 39.2 | 141 | 38.0 | 295 | 38.3 | 327 | 40.7 | 606 | 37.1 | ||
| Intermediate 2 | 377 | 19.4 | 90 | 20.0 | 154 | 20.0 | 133 | 16.6 | 470 | 28.8 | ||
| High risk | 230 | 11.8 | 63 | 12.6 | 97 | 12.6 | 70 | 8.7 | 255 | 15.6 | ||
Abbreviations: AML, acute myeloid leukemia; ANC, absolute neutrophil count; CMML, chronic myelomonocytic leukemia; CMML-1, chronic myelomonocytic leukemia with less than 10% bone marrow blasts; CMML-2, chronic myelomonocytic leukemia with 10% to 19% bone marrow blasts; FAB, French-American-British; GA, German-Austrian MDS Study Group; GCECGH, Spanish Hematological Cytogenetics Working Group; Hb, hemoglobin; IMRAW, International MDS Risk Analysis Workshop; IPSS, International Prognostic Scoring System; IWGC, International Working Group on MDS Cytogenetics; MDA, MD Anderson Cancer Center; MDS, myelodysplastic syndromes; PLT, platelet count; RA, refractory anemia; RAEB, refractory anemia with excess blasts; RAEB-1, RAEB with blast level < 10%; RAEB-2, RAEB with blast level 10% to 20%; RAEB-T, RAEB in transformation; RARS, refractory anemia with ring sideroblasts; RCMD, refractory cytopenia with multilineage dysplasia; RCMD-RS, RCMD with ring sideroblasts.
Not available in database.
Specified as either WHO or FAB to avoid double classification.
Bone Marrow Morphology and Cytopenia Classification
Bone marrow morphology studies were performed at the individual centers. Patients from the GA database were reviewed centrally (C.A., U.G.). Classification of MDS was performed according to French-American-British18 and/or WHO classifications.19 AML evolution was determined using the French-American-British definition (> 30% marrow blasts). Peripheral blood cytopenias were scored according to the IPSS.8
Cytogenetic Analysis
Cytogenetic analyses were performed at the time of first diagnosis, as described elsewhere.1 Abnormalities diagnosed by fluorescent in situ hybridization only were not included. The median number of metaphases analyzed was 20 (range, 2 to 194). Karyotypes were documented according to the International System for Human Cytogenetic Nomenclature (ISCN).14 All ISCN formulas were reviewed centrally (J.S., C.S., D.H.). The IPSS karyotype scores (ie, number of clonal abnormalities) were generated according to international guidelines.20
Composition of Cytogenetic Subgroups
Isolated anomalies occurring in at least five patients were judged as distinct subgroups of patients. Double abnormalities (ie, two distinct clonal MDS-related acquired karyotypic anomalies found within one cell) were classified into three subgroups: del(5q) with one additional clonal aberration, −7/del(7q) with one additional clonal aberration, and any other combination of two abnormalities. Complex karyotypes were subdivided into those with three unrelated karyotypic abnormalities and those with more than three karyotypic abnormalities. Independent clones, defined as two or more unrelated subclones in parallel, were calculated as a distinct group when none of the clones comprised complex abnormalities; otherwise, they were considered complex.
Statistical Analysis
Univariate analysis of overall survival (OS) and risk of AML transformation were calculated using the Kaplan-Meier method.21 Differences were tested with the log-rank test.22 Multivariate analysis was performed using a Cox proportional hazards regression model,23 with OS or time to AML transformation as the end point. In multivariate analysis, age, sex, percentage of bone marrow blasts, peripheral cytopenia, cytogenetic pattern, site, and year of diagnosis (Appendix Fig A1, online only) were applied as covariables. Univariate and multivariate analyses were performed exclusively for groups with a minimum of five patients. Because of the high variability of time-to-event analyses in very rare abnormalities (n < 10), these were not considered as distinct abnormalities within the scoring system and were merged into one group labeled “any other single.”
Group differences concerning numerical variables were tested for significance using the Kruskal-Wallis test for analysis of variance by rank and, in the case of ordered groups, using the significance test for Kendall's tau. Two-sided P values less than .05 were considered significant. In line with the essentially exploratory nature of the study, no adjustment for multiple testing was applied. The predictive power of the prognostic models was assessed using the generalization of the Dxy coefficient for censored data.24
Because the estimated risk attributable to a cytogenetic category is influenced by confounding characteristics like age, sex, and clinical features, several multivariable models including different combinations of possible confounders were calculated for survival and time to AML transformation. The resulting coefficients were combined in a weighted mean for each cytogenetic category, using number of events as weights.
On the basis of their mean coefficients, the cytogenetic categories could be divided into five separable risk groups, and the limits for the risk groups were equally spaced. Consequently, the five risk categories were considered as a numerical scale (1 to 5). A bootstrap analysis based on 2,000 repetitions was applied to validate the score.25
The external validation based on the MDA data was executed as a numeric scale by re-estimation of multivariate Cox models and comparison of the estimates and CIs. All statistical analyses were performed using the open-source software R version 2.10.1 (R Foundation for Statistical Computing, Vienna, Austria).
RESULTS
Patient Cohort and Clinical Findings
In total, 2,902 patients were analyzed retrospectively. The female to male ratio was 1:1.4. The median age was 70 years. Median hemoglobin was 9.6 g/dL; median absolute neutrophil count, 2.1 × 10⁹/L; and median platelet count, 124 × 109/L. The median observation time was 50.0 months (range, 0.1 to 326 months; Table 1).
Cytogenetic Abnormalities
The ISCN karyotype description was evaluable and clearly interpretable in 2,801 (97%) of 2,902 patients. Clonal abnormalities were observed in 45% of patients (n = 1,258). Table 2 summarizes cytogenetic subgroups and related clinical features.
Table 2.
Clinical Characteristics and Survival in Cytogenetic Subgroups
| Characteristic | Patients |
Median |
|||||||
|---|---|---|---|---|---|---|---|---|---|
| No. | % | Age (years) | Hb (g/dL) | PLT (×103/μL) | ANC (×103/μL) | BLC | OS (months) | AML-Free Survival (months) | |
| Karyotype | |||||||||
| Normal | 1,543 | 55.1 | 70.0 | 9.9 | 130 | 2.2 | 3.0 | 47.4 | NR |
| Abnormal | 1,258 | 44.9 | 69.0 | 9.3 | 114 | 2.0 | 4.0 | 24.4 | 91.0 |
| P | NS | < .01 | < .01 | < .01 | < .01 | < .01 | < .01 | ||
| Distribution of metaphases | |||||||||
| NA karyotype | 500 | 18.3 | 70.4 | 9.5 | 117 | 2.0 | 3.0 | 29.7 | NR |
| AA karyotype | 693 | 25.3 | 67.5 | 9.1 | 118 | 2.1 | 4.0 | 27.0 | 84.3 |
| P | < .01 | < .05 | NS | NS | < .01 | < .05 | < .05 | ||
| Abnormalities per patient | |||||||||
| 1 | 827 | 29.5 | 69.0 | 9.5 | 124 | 2.2 | 3.0 | 37.4 | 203.2 |
| 2 | 174 | 6.2 | 68.0 | 9.5 | 124 | 2.1 | 4.0 | 27.9 | 91.0 |
| 3 | 60 | 2.1 | 70.0 | 9.3 | 107 | 1.9 | 5.5 | 15.6 | 21.0 |
| > 3 | 196 | 7.0 | 71.0 | 8.5 | 67 | 1.3 | 11.0 | 5.7 | 8.2 |
| P | NS | < .01 | < .01 | < .01 | < .01 | < .01 | < .01 | ||
| Clonal evolution | |||||||||
| No (only abnormal patient cases) | 780 | 86.6 | 69.2 | 9.4 | 111 | 2.0 | 4.0 | 28.9 | 121.2 |
| Yes | 121 | 13.4 | 69.7 | 9.4 | 85 | 1.8 | 5.0 | 11.4 | 33.0 |
| P | NS | NS | NS | NS | NS | < .01 | < .01 | ||
| Abnormalities | |||||||||
| Single (n ≥ 10) | |||||||||
| inv(3)/t(3q)/del(3q) | 12 | 0.4 | 67.6 | 8.2 | 130 | 2.1 | 4.0 | 23.8 | 7.9 |
| del(5q) | 180 | 6.4 | 66.8 | 8.7 | 251 | 2.1 | 3.0 | 57.8 | 203.2 |
| −7 | 46 | 1.6 | 67.0 | 9.1 | 59 | 1.7 | 8.0 | 15.8 | 33.5 |
| del(7q) | 13 | 0.5 | 63.9 | 9.5 | 120 | 1.7 | 10.0 | 20.0 | NR |
| +8 | 133 | 4.7 | 70.2 | 9.3 | 120 | 2.1 | 4.0 | 23.0 | 38.6 |
| del(11q) | 20 | 0.7 | 68.0 | 11.2 | 123 | 2.0 | 2.0 | 141.2 | 121.2 |
| del(12p) | 18 | 0.6 | 70.0 | 8.8 | 86 | 1.6 | 9.0 | 76.0 | NR |
| i(17q) | 11 | 0.4 | 74.5 | 8.4 | 89 | 2.7 | 10.0 | 18.0 | 16.8 |
| +19 | 10 | 0.4 | 66.5 | 8.0 | 116 | 3.9 | 2.0 | 56.4 | 64.0 |
| del(20q) | 48 | 1.7 | 71.0 | 11.0 | 106 | 1.5 | 3.0 | 62.0 | NR |
| −Y | 63 | 2.2 | 73.0 | 11.2 | 150 | 2.7 | 3.0 | 60.8 | NR |
| Rare single (n < 10) | |||||||||
| der (1;7) | 9 | 0.3 | 59.5 | 7.8 | 75 | 0.9 | 3.0 | NR | NR |
| +1q | 5 | 0.2 | 53.5 | 11.2 | 32 | 2.2 | 8.0 | 21.3 | 19.2 |
| −1/1p− | 6 | 0.2 | 65.7 | 10.2 | 293 | 3.6 | 7.0 | 47.7 | NR |
| t(5q) | 6 | 0.2 | 62.1 | 13.3 | 59 | 4.4 | 3.0 | NR | NR |
| +11 | 5 | 0.2 | 64.6 | 10.3 | 76 | 7.3 | 16.0 | 11.0 | 11.0 |
| t(11q23) | 7 | 0.2 | 65.4 | 7.9 | 140 | 6.3 | 4.0 | 26.7 | 78.0 |
| −13/13q− | 8 | 0.3 | 56.0 | 10.1 | 150 | 3.1 | 2.0 | NR | NR |
| del(16q) | 7 | 0.2 | 71.0 | 12.4 | 121 | 3.5 | 2.0 | NR | NR |
| del(17p) | 6 | 0.2 | 63.0 | 10.6 | 165 | 3.3 | 2.5 | NR | NR |
| +21 | 9 | 0.3 | 67.0 | 9.1 | 105 | 1.9 | 6.0 | 21.5 | 100.7 |
| −21 | 8 | 0.3 | 78.0 | 7.2 | 35 | 2.2 | 13.0 | 32.0 | 31.3 |
| −X | 9 | 0.3 | 66.0 | 9.4 | 108 | 2.3 | 5.0 | 16.0 | 14.0 |
| +Mar | 5 | 0.2 | 76.1 | 9.1 | 72 | 0.5 | 7.0 | 20.7 | NR |
| Other | 162 | 5.8 | 69.9 | 9.6 | 90 | 2.1 | 3.5 | 23.3 | NR |
| P | < .05 | < .01 | < .01 | NS | < .01 | < .01 | < .01 | ||
| All rare abnormalities (n < 10) combined | 252 | 9.0 | 67.2 | 9.6 | 105 | 2.4 | 4.0 | 30.5 | 100.7 |
| Double abnormalities | |||||||||
| Including del(5q) | 46 | 1.6 | 68.4 | 8.2 | 243 | 2.1 | 3.0 | 44.4 | 91.2 |
| Including any other | 94 | 3.4 | 69.0 | 9.8 | 117 | 2.0 | 3.0 | 28.0 | NR |
| Including −7/del(7q) | 33 | 1.2 | 66.4 | 9.4 | 124 | 2.2 | 8.0 | 13.4 | 19.3 |
| P | NS | < .01 | < .05 | NS | NS | < .01 | NS | ||
| No. of complex abnormalities | |||||||||
| 3 | 60 | 2.1 | 70.0 | 9.3 | 107 | 1.9 | 5.5 | 15.6 | 21.0 |
| > 3 | 196 | 7.0 | 71.0 | 8.5 | 67 | 1.3 | 11.0 | 5.7 | 8.2 |
| P | NS | < .01 | < .05 | NS | < .01 | < .01 | < .01 | ||
| Independent clones | 25 | 0.9 | 71.6 | 7.9 | 160 | 3.1 | 6.0 | 18.5 | 84.3 |
Abbreviations: AA, only abnormal metaphases; AML, acute myeloid leukemia; ANC, absolute neutrophil count; BLC, bone marrow blast count; Hb, hemoglobin; NA, mosaic of normal and abnormal metaphases; NR, not reached; NS, not significant; OS, overall survival; PLT, platelet count.
Distinct Abnormalities
Isolated abnormalities.
Isolated abnormalities occurring in at least five patients included: del(5q) [n = 180], +8 [n = 133], −Y [n = 60], del(20q) [n = 48], −7 [n = 46], del(11q) [n = 20], del(12p) [n = 18], del(7q) [n = 13], i(17)(q10) [n = 11], inv(3)/t(3q)/del(3q) [n = 10], +19 [n = 10], +21 [n = 9], der(1, 7) [n = 9], −X [n = 9], −21 [n = 8], −13/del(13q) [n = 8], del(16q) [n = 7], t(11q23) [n = 7], −1/del(1p) [n = 6], t(5q) [n = 6], del(17p) [n = 6], +mar [n = 5], +1q [n = 5], and +11 [n = 5; Table 2].
Double abnormalities.
Double abnormalities are characterized by profound variability. The only combination occurring in more than five patients was the combination of del(5q) and trisomy 8 (n = 6). Other combinations were found less than five times.
Complex abnormalities.
Complex abnormalities were observed in 9% (n = 254) of all patients. The median number of abnormalities per patient with complex abnormalities was five (range, three to 20).
Analysis of Prognostic Factors
As possible confounders in the estimation of cytogenetic risk categories, host-related and clinical features were investigated. Female patients showed a lower OS risk (HR, 0.7; P < .01) but not a lower risk of AML transformation (HR, 0.9; P not significant). Likewise, age 60 years or older was found to be a risk factor for OS (HR, 1.6; P < .01) but not for transformation to AML (HR, 1.1; P not significant). The occurrence of anemia (hemoglobin < 10 g/dL) or thrombocytopenia (platelets < 100/μL) was significantly associated with a higher risk for both OS (anemia: HR, 1.6; P < .01; thrombocytopenia: HR, 1.3; P < .01) and AML evolution (anemia: HR, 1.7; P < .01; thrombocytopenia: HR, 1.3; P < .05). A lower absolute neutrophil count (< 1.8 × 10⁹/L) did not significantly affect OS (HR, 0.9; P not significant) or risk of AML transformation (HR, 1.2; P not significant). As expected, the risks for OS and especially AML rise with increasing bone marrow blast counts. The HRs for OS (reference < 5%) were 1.9 for 5% to 10%, 2.8 for 11% to 20%, and 4.2 for 21% to 30% (P < .01 for all groups). For AML transformation, HR increased with an increase in the percentage of bone marrow blasts: 3.0 for 5% to 10%, 5.5 for 11% to 20%, and 10.8 for 21% to 30% (P < .01 for all groups).
Karyotype Abnormalities
Univariate analysis was performed separately for each cytogenetic category. Table 2 and Figures 1A and 1B include additional information concerning OS and AML transformation in distinct single abnormalities. The presence of a second clonal aberration (ie, double abnormalities; Table 2; Appendix Figs A2A and A2B, online only) associated with del(5q) showed a median OS of 44.4 months and HR of 1.2 (AML transformation: median, 91.2 months; HR, 1.6). Gain of an additional clonal aberration with −7/del(7q) was associated with a significantly worse prognosis (OS: median, 13.4 months; HR, 3.0; AML: median, 19.3 months; HR, 2.8; P < .01). All other double abnormalities showed an intermediate prognostic impact (OS: median, 28.0 months; HR, 1.8; AML: median, not reached [NR]; HR, 2.0). Complex abnormalities (Table 2; Appendix Figs A2C and A2D, online only) showed a significant (P < .01) difference regarding prognosis between those with exactly three abnormalities (OS: median, 15.6 months; HR, 3.6; AML: median, 21.0; HR, 4.9) as compared with more than three abnormalities (OS: median, 5.7 months; HR, 4.1; AML: median, 8.2; HR, 5.1).
Fig 1.

(A) Overall survival (n = 1,893) and (B) risk of acute myeloid leukemia transformation (n = 1,691) in distinct cytogenetic subgroups (abnormalities with n < 10 combined as Any 1). Any 1, any other single abnormality; double 5, double abnormalities including del(5q); double, any other combination of two abnormalities; double 7, double abnormalities including −7/7q−; complex 3, three abnormalities; complex > 3, four or more abnormalities; + indicates P < .01 (as compared with reference category); (*) indicates P < .05 (as compared with reference category). Ind., independent.
Proposal of a New Cytogenetic Prognostic Scoring System
All abnormalities were arranged according to OS and AML to classify their prognostic impact. The classification was based on the results of the multivariate model, considering OS and risk of AML transformation. The analyses suggested a five-armed model based on interpretability and predictive power (OS: Dxy, 0.48; AML: Dxy, 0.59). Using this model, the groups were formed as follows: very good (median OS, 60.8 months; HR, 0.5), del(11q) and −Y; good (reference category; median OS, 48.6 months; HR, 1.0), normal, del(5q), del(12p), and del(20q) [all as a single anomaly] and double abnormalities including del(5q); intermediate median OS, 26.0 months; HR, 1.6), del(7q), +8, i(17)(q10), +19, +21, any other single abnormality, independent clones, double abnormalities not harboring del(5q) or −7/del(7q); poor (median OS, 15.8 months; HR, 2.6), inv(3)/t(3q)/del(3q), −7, double abnormalities including −7/del(7q), and complex (ie, three abnormalities); and very poor (median OS, 5.9 months; HR, 4.2), complex (ie, > three abnormalities). The HRs between groups differed markedly concerning OS as well as AML (Figs 2A to 2D; Table 3). Compared with the cytogenetic module of the IPSS, the risk group for 13% of all patients (n = 367) would change, 6% (n = 160) into a more favorable and 7% (n = 207) into a less favorable prognostic group (Fig 3).
Fig 2.

(A, B) Kaplan-Meier curves and (C, D) forest plots for (A, C) overall survival and (B, D) risk of acute myeloid leukemia (AML) transformation in new cytogenetic prognostic subgroups; + indicates P < .01 (as compared with reference category). 5-EV, external validation set (MD Anderson Cancer Center [MDA]), scaled, five groups; 5-T, test set, scaled, five groups; int, intermediate; IV, internal validation set; T, test set; val; validation.
Table 3.
Design of Cytogenetic Scoring System (n = 2,754)*
| Prognostic Subgroup | Abnormality |
Overall Survival |
AML Transformation |
||||||||||
|---|---|---|---|---|---|---|---|---|---|---|---|---|---|
| No. of Patients | % | Single | Double | Complex | Median (months)† | 95% CI | HR | 95% CI | Median (months)† | 95% CI | HR | 95% CI | |
| Very good | 81 | 2.9 | del(11q) | — | — | 60.8 | 50.3 to NR | 0.5† | 0.3 to 0.7 | NR | 121.2 to NR | 0.5 | 0.2 to 1.2 |
| −Y | |||||||||||||
| Good (reference) | 1,809 | 65.7 | Normal | Including del(5q) | — | 48.6 | 44.6 to 54.3 | 1.0 | 0.9 to 1.1 | NR | 189.0 to NR | 1.0 | 0.9 to 1.2 |
| del(5q) | |||||||||||||
| del(12p) | |||||||||||||
| del(20q) | |||||||||||||
| Intermediate | 529 | 19.2 | del(7q) | Any other | — | 26.0 | 22.1 to 31.0 | 1.6† | 1.4 to 1.8 | 78.0 | 42.6 to NR | 2.2† | 1.8 to 2.7 |
| +8 | |||||||||||||
| i(17q) | |||||||||||||
| +19 | |||||||||||||
| Any other | |||||||||||||
| Independent clones | |||||||||||||
| Poor | 148 | 5.4 | inv(3)/t(3q)/del(3q) | Including −7/del(7q) | 3 | 15.8 | 12.0 to 18.0 | 2.6† | 2.1 to 3.2 | 21.0 | 13.4 to 42.2 | 3.4† | 2.5 to 4.6 |
| −7 | |||||||||||||
| Very poor | 187 | 6.8 | — | — | > 3 | 5.9 | 4.9 to 6.9 | 4.2† | 3.4 to 5.2 | 8.2 | 6.4 to 15.4 | 4.9† | 3.6 to 6.7 |
Abbreviations: AML, acute myeloid leukemia; HR, hazard ratio; NR, not reached.
Patients with complete data.
P < .01.
Fig 3.
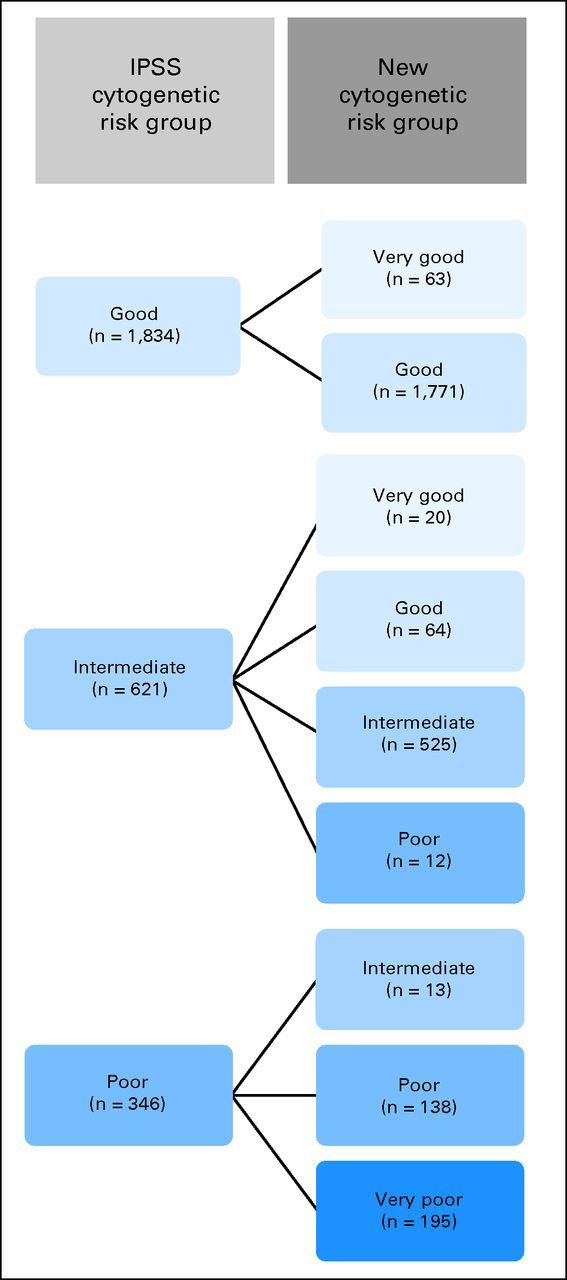
Change of cytogenetic prognostic subgroups in the new system as compared with the cytogenetic module of the International Prognostic Scoring System (IPSS).
To show the improvement of our score as compared with the original IPSS, we estimated models including the cytogenetic part of the IPSS and the five cytogenetic groups, together with all other possible confounders. In this model, the cytogenetic part of the IPSS did not reach significance (P = .670), whereas the five cytogenetic groups contributed significantly (P < .001).
Validation of the New Scoring System
Internal validation by bootstrap.
To reassess our results, an internal validation was performed using bootstrap analysis. Here, the HRs regarding OS were 0.48 (95% CI, 0.31 to 0.74) for the vey good cytogenetic subgroup, 1.0 (reference; 95% CI, 0.92 to 1.1) for good, 1.6 (95% CI, 1.4 to 1.8) for intermediate, 2.6 (95% CI, 2.0 to 3.2) for poor, and 4.1 (95% CI, 3.1 to 5.3) for very poor (Dxy, 0.47). For AML, the HRs were 0.75 (95% CI, 0.01 to 111.8) for the vey good cytogenetic subgroup, 1.0 (reference; 95% CI, 0.84 to 1.2) for good, 2.2 (95% CI, 1.8 to 2.7) for intermediate, 3.3 (95% CI, 2.4 to 4.6) for poor, and 4.7 (95% CI, 3.2 to 6.8) for very poor (Dxy, 0.57).
External validation based on independent test data.
In line with the intended use of the proposed cytogenetic categories as one component of a comprehensive prognostic scoring system, Cox proportional hazards models for survival and time to transformation were estimated based on the independently collected data from MDA. These models included the five cytogenetic categories as a numeric score and the same additional characteristics used in the multivariate models in development. In both models, for survival and time to transformation, respectively, the cytogenetic score showed strong and significant prognostic impact. The estimated mean HRs between each two adjacent categories were 1.48 (95% CI, 1.41 to 1.56) for survival (Dxy, 0.38) and 1.32 (95% CI, 1.17 to 1.49) for risk of AML transformation (Dxy, 0.30). The corresponding results for the development data were 1.63 (95% CI, 1.52 to 1.74) for survival (Dxy, 0.48) and 1.76 (95% CI, 1.59 to 1.94) for time to transformation (Dxy, 0.59).
Finally, an external Italian working group further validated the accuracy of the score completely independently from us. The results confirmed that the score efficiently predicts outcome in patients with MDS.26
DISCUSSION
The present study was undertaken to improve cytogenetic classification in MDS and propose a more comprehensive cytogenetic scoring system for patients with primary untreated MDS by assembling cytogenetic and clinical data into a large multicenter project. We sought to create a system that clearly separates single and double abnormalities, defines a procedure to classify double abnormalities, and emphasizes prognostic subgroups within the heterogeneous category of patients showing complex abnormalities. The present study is based on, to our knowledge, the largest data set collected to date by focusing on these questions.
Regarding single abnormalities, inv(3)/t(3q)/del(3q), +8, del(11q), del(12p), i(17)(q10), +19, and +21 were newly integrated into the scoring system. Substantial differences were not seen in the prognostic impact of categories known from the IPSS [del(5q), del(20q), −Y] compared with the data based on large patient cohorts (n > 500) published to date.6–10,27,28 An exception was seen in patients showing partial or total monosomy of chromosome 7 as a single abnormality, which was associated with poor prognosis in studies by IMRAW,8 the Spanish MDS Cytogenetic Working Group,9 and Podzdnyakova et al,28 whereas in a previous analysis of our group based on the GA data set10 as well as the findings of Bernasconi et al,29 it was described as intermediate. The results are difficult to compare because of the fact that some studies also included patients treated with disease-altering therapy,9,27 whereas others8,10,29 included patients treated with supportive care exclusively. Our data revealed that a deletion of 7q was more favorable as compared with the loss of the whole chromosome 7 with regard to OS (HR: del (7q), 1.2; −7, 1.8; Appendix Fig A3A, online only) as well as risk of AML transformation (HR: del(7q), 1.2; −7, 1.9; Appendix Fig A3B), a finding described previously.9,30 Consequently, we classified the deletion of 7q as intermediate, whereas the loss of the whole chromosome 7 was associated with poorer prognosis.
Double abnormalities were separated into three distinct subgroups clearly distinguishing risk with regard to OS as well as risk of AML transformation, which has not been described before. Recent publications assigned double abnormalities into one group7–9,27 or merely separated noncomplex (one to two abnormalities) from complex (≥ three abnormalities).6,10,31
The subclassification of complex abnormalities in our study also defined new cytogenetic risk categories. We are aware that additional analyses are necessary to characterize distinct subgroups within the heterogeneous cluster of complex abnormalities; however, this proposal constitutes a classification that remains clinically applicable.
We included patients with refractory anemia with excess blasts in transformation (RAEB-T; ie, oligoblastic AML), although we are aware that this disease is classified as AML but not MDS in WHO classification. Statistically, the exclusion of patients with RAEB-T (8%) leads to a lower risk in the entire sample, whereas the relative position of the five prognostic subgroups remains unchanged. Additionally, the new score was designed to form the cytogenetic module of the upcoming IPSS revision, which is expected to include those with RAEB-T as well.
The results in the independent validation cohort were, as expected, somewhat less pronounced than those in the development data (Appendix Fig A4, online only). Still, the results for survival were within the CI of the original estimate. The risk estimation for time to transformation in the MDA data was weaker than that in the development data. This may partly stem from the optimism inherent in explorative model building and partly from differences in patient populations.
In summary, we propose a new and comprehensive cytogenetic scoring system. Ninety-one percent of all patients can be explicitly classified according to an estimated prognostic impact of the abnormality observed, which allows for a refined cytogenetic risk prediction. The present study is part of a multistep process to compose the cytogenetic module of the upcoming revision of the IPSS. Previous work of our group10,32 focused on the prognostic impact of clonal abnormalities and their underrepresentation within the IPSS but did not include design and validation of a new scoring system. However, the system presented here should be viewed as a dynamic model, open to further refinement as our knowledge about karyotypic abnormalities in MDS evolves.
Acknowledgment
We thank the MDS Foundation for its support in collecting rare abnormalities.
Appendix
Fig A2.

In (A, B) double and (C, D) complex abnormalities, (A, C) overall survival and (B, D) risk of acute myeloid leukemia (AML) transformation. Double 5, double abnormalities including del(5q); double, any other combination of two abnormalities; double 7, double abnormalities including −7/7q−; complex 3, three abnormalities; complex > 3, four or more abnormalities.
Fig A3.

(A) Overall survival and (B) risk of acute myeloid leukemia (AML) transformation in patients with deletion 7q as compared with those with total monosomy 7.
Fig A1.

Overall survival (OS) by date of first diagnosis.
Fig A4.

MD Anderson Cancer Center validation results (univariate analysis) regarding (A) overall survival and (B) risk of acute myeloid leukemia (AML) transformation. HR, hazard ratio.
Footnotes
See accompanying editorial on page 774
Supported in part by Grants No. FI07/00107 from Instituto de Salud Carlos III Federación Española de Enfermedades Raras (FEDER), Ministerio de Sanidad y Consumo, Madrid, and RD07/0020/2004 from Red Temática de Investigación Cooperativa en Cáncer, FEDER, Barcelona, Spain, and by Senioren-Krebshilfe, Innsbruck, Austria (R.S.).
Authors' disclosures of potential conflicts of interest and author contributions are found at the end of this article.
AUTHORS' DISCLOSURES OF POTENTIAL CONFLICTS OF INTEREST
The author(s) indicated no potential conflicts of interest.
AUTHOR CONTRIBUTIONS
Conception and design: Julie Schanz, Heinz Tüchler, Detlef Haase
Provision of study materials or patients: Julie Schanz, Francesc Solé, Mar Mallo, Elisa Luño, José Cervera, Isabel Granada, Marilyn L. Slovak, Kazuma Ohyashiki, Christian Steidl, Christa Fonatsch, Michael Pfeilstöcker, Thomas Nösslinger, Peter Valent, Aristoteles Giagounidis, Carlo Aul, Michael Lübbert, Reinhard Stauder, Otto Krieger, Michelle M. Le Beau, John M. Bennett, Peter Greenberg, Ulrich Germing, Detlef Haase
Collection and assembly of data: Julie Schanz, Francesc Solé, Mar Mallo, Elisa Luño, José Cervera, Isabel Granada, Barbara Hildebrandt, Marilyn L. Slovak, Kazuma Ohyashiki, Christian Steidl, Christa Fonatsch, Michael Pfeilstöcker, Thomas Nösslinger, Peter Valent, Aristoteles Giagounidis, Carlo Aul, Michael Lübbert, Reinhard Stauder, Otto Krieger, Guillermo Garcia-Manero, Stefan Faderl, Sherry Pierce, Michelle M. Le Beau, John M. Bennett, Peter Greenberg, Ulrich Germing, Detlef Haase
Data analysis and interpretation: Julie Schanz, Heinz Tüchler, Francesc Solé, Elisa Luño, José Cervera, Barbara Hildebrandt, Marilyn L. Slovak, Christian Steidl, Christa Fonatsch, Carlo Aul, Michelle M. Le Beau, Ulrich Germing, Detlef Haase
Manuscript writing: All authors
Final approval of manuscript: All authors
Affiliations
Julie Schanz and Detlef Haase, University of Göttingen, Göttingen; Barbara Hildebrandt and Ulrich Germing, University of Düsseldorf, Düsseldorf; Aristoteles Giagounidis and Carlo Aul, Johannes Hospital, Duisburg; Michael Lübbert, University of Freiburg, Freiburg, Germany; Heinz Tüchler, Michael Pfeilstöcker, and Thomas Nösslinger, L. Boltzmann Institute for Leukemia Research; Christa Fonatsch and Peter Valent, Medical University of Vienna; Reinhard Stauder, Medical University of Innsbruck, Innsbruck; Otto Krieger, Elisabethinen Hospital, Linz, Austria; Francesc Solé and Mar Mallo, Hospital del Mar; Isabel Granada, Jose Carreras Leukemia Research Institute, Badalona; Elisa Luño, Central University Hospital of Asturias, Oviedo; José Cervera, Hospital La Fe, Valencia, Spain; Marilyn L. Slovak, Quest Diagnostics Nichols Institute, Chantilly, VA; Kazuma Ohyashiki, Tokyo Medical University, Tokyo, Japan; Christian Steidl, British Columbia Cancer Agency, Vancouver, British Columbia, Canada; Guillermo Garcia-Manero, Stefan Faderl, and Sherry Pierce, MD Anderson Cancer Center, Huston, TX; Michelle M. Le Beau, University of Chicago, Chicago, IL; John M. Bennett, University of Rochester Medical Center, Rochester, NY; and Peter Greenberg, Stanford University Cancer Center, Stanford, CA.
REFERENCES
- 1.Haase D, Feuring-Buske M, Schäfer C, et al. Cytogenetic analysis of CD34+ subpopulations in AML and MDS characterized by the expression of CD38 and CD117. Leukemia. 1997;11:674–679. doi: 10.1038/sj.leu.2400638. [DOI] [PubMed] [Google Scholar]
- 2.Blau O, Hofmann WK, Baldus CD, et al. Chromosomal aberrations in bone marrow mesenchymal stroma cells from patients with myelodysplastic syndrome and acute myeloblastic leukemia. Exp Hematol. 2007;35:221–229. doi: 10.1016/j.exphem.2006.10.012. [DOI] [PubMed] [Google Scholar]
- 3.Raza A, Gezer S, Mundle S, et al. Apoptosis in bone marrow biopsy samples involving stromal and hematopoietic cells in 50 patients with myelodysplastic syndromes. Blood. 1995;86:268–276. [PubMed] [Google Scholar]
- 4.Valent P, Horny HP, Bennett JM, et al. Definitions and standards in the diagnosis and treatment of the myelodysplastic syndromes: Consensus statements and report from a working conference. Leuk Res. 2007;31:727–736. doi: 10.1016/j.leukres.2006.11.009. [DOI] [PubMed] [Google Scholar]
- 5.Knapp RH, Dewald GW, Pierre RV. Cytogenetic studies in 174 consecutive patients with preleukemic or myelodysplastic syndromes. Mayo Clin Proc. 1985;60:507–516. doi: 10.1016/s0025-6196(12)60566-7. [DOI] [PubMed] [Google Scholar]
- 6.Morel P, Hebbar M, Lai JL, et al. Cytogenetic analysis has strong independent prognostic value in de novo myelodysplastic syndromes and can be incorporated in a new scoring system: A report on 408 cases. Leukemia. 1993;7:1315–1323. [PubMed] [Google Scholar]
- 7.Toyama K, Ohyashiki K, Yoshida Y, et al. Clinical implications of chromosomal abnormalities in 401 patients with myelodysplastic syndromes: A multicentric study in Japan. Leukemia. 1993;7:499–508. [PubMed] [Google Scholar]
- 8.Greenberg P, Cox C, LeBeau MM, et al. International scoring system for evaluating prognosis in myelodysplastic syndromes. Blood. 1997;89:2079–2088. [PubMed] [Google Scholar]
- 9.Solé F, Luño E, Sanzo C, et al. Identification of novel cytogenetic markers with prognostic significance in a series of 968 patients with primary myelodysplastic syndromes. Haematologica. 2005;90:1168–1178. [PubMed] [Google Scholar]
- 10.Haase D, Germing U, Schanz J, et al. New insights into the prognostic impact of the karyotype in MDS and correlation with subtypes: Evidence from a core dataset of 2124 patients. Blood. 2007;110:4385–4395. doi: 10.1182/blood-2007-03-082404. [DOI] [PubMed] [Google Scholar]
- 11.Mufti GJ, Stevens JR, Oscier DG, et al. Myelodysplastic syndromes: A scoring system with prognostic significance. Br J Haematol. 1985;59:425–433. doi: 10.1111/j.1365-2141.1985.tb07329.x. [DOI] [PubMed] [Google Scholar]
- 12.Sanz GF, Sanz MA, Vallespí T, et al. Two regression models and a scoring system for predicting survival and planning treatment in myelodysplastic syndromes: A multivariate analysis of prognostic factors in 370 patients. Blood. 1989;74:395–408. [PubMed] [Google Scholar]
- 13.Aul C, Gattermann N, Heyll A, et al. Primary myelodysplastic syndromes: Analysis of prognostic factors in 235 patients and proposals for an improved scoring system. Leukemia. 1992;6:52–59. [PubMed] [Google Scholar]
- 14.Shaffer LG, Slovak ML, Campbell LJ. An International System for Human Cytogenetic Nomenclature (2009): Recommendations of the International Standing Committee on Human Cytogenetic Nomenclature. Basel, Switzerland: Karger; 2009. [Google Scholar]
- 15.Steidl C, Schanz J, LeBeau MM, et al. Coalescence of the German-Austrian and IMRAW Cytogenetic MDS databases: Modification of patient risk groups. Presented at the American Society of Hematology Annual Meeting; December 8-11, 2007; Atlanta, GA. [Google Scholar]
- 16.Schanz J, Steidl C, Fonatsch C, et al. Coalesced multicentric analysis of 2351 patients with MDS indicates an underestimation of poor risk cytogenetics in the International Prognostic Scoring System of myelodysplastic syndromes. J Clin Oncol. 2011;29:1963–1970. doi: 10.1200/JCO.2010.28.3978. [DOI] [PMC free article] [PubMed] [Google Scholar]
- 17.Schanz J, Slovak ML, Ohyashiki K, et al. New prognostic data on rare cytogenetic abnormalities in MDS: A collaborative study of the International Working Group on MDS Cytogenetics. Presented at the American Society of Hematology Annual Meeting; December 6-9, 2008; San Francisco, CA. [Google Scholar]
- 18.Bennett JM, Catovsky D, Daniel MT, et al. Proposals for the classification of the myelodysplastic syndromes. Br J Haematol . 1982;51:189–199. [PubMed] [Google Scholar]
- 19.Harris NL, Jaffe ES, Diebold J, et al. World Health Organization classification of neoplastic diseases of the hematopoietic and lymphoid tissues: Report of the Clinical Advisory Committee meeting—Airlie House, Virginia, November 1997. J Clin Oncol. 1999;17:3835–3849. doi: 10.1200/JCO.1999.17.12.3835. [DOI] [PubMed] [Google Scholar]
- 20.Chun K, Hagemeijer A, Iqbal A, et al. Implementation of standardized international karyotype scoring practices is needed to provide uniform and systematic evaluation for patients with myelodysplastic syndrome using IPSS criteria: An International Working Group on MDS Cytogenetics Study. Leuk Res. 2010;34:160–165. doi: 10.1016/j.leukres.2009.07.006. [DOI] [PubMed] [Google Scholar]
- 21.Kaplan EL, Meier P. Nonparametric estimation from incomplete observations. J Am Stat Ass. 1958;53:457–481. [Google Scholar]
- 22.Peto R, Pike MC, Armitage P, et al. Design and analysis of randomized trials requiring prolonged observation of each patient: II. Analysis example. Br J Cancer. 1977;35:1–39. doi: 10.1038/bjc.1977.1. [DOI] [PMC free article] [PubMed] [Google Scholar]
- 23.Cox D. Regression models and life tables. J R Stat Soc. 1972;34:187–220. [Google Scholar]
- 24.Harrell FE, Jr, Lee KL, Mark DB. Multivariable prognostic models: Issues in developing models, evaluating assumptions and adequacy, and measuring and reducing errors. Stat Med. 1996;15:361–387. doi: 10.1002/(SICI)1097-0258(19960229)15:4<361::AID-SIM168>3.0.CO;2-4. [DOI] [PubMed] [Google Scholar]
- 25.Davison AC, Hinkley DV. Bootstrap Methods and Their Applications. Cambridge, United Kingdom: Cambridge University Press; 1997. [Google Scholar]
- 26.Bernasconi P, Klersy C, Boni M, et al. The international multicentric cooperation cytogenetic scoring system effectively predicts disease outcome in de novo MDS. Presented at the European Hematology Association Annual Meeting; June 9-12, 2011; London, United Kingdom. [Google Scholar]
- 27.Musilová J, Michalová K, Zemanová Z, et al. Multiple unrelated clones in myelodysplastic syndrome and in acute myeloid leukemia. Cancer Genet Cytogenet. 1996;88:141–143. doi: 10.1016/0165-4608(95)00289-8. [DOI] [PubMed] [Google Scholar]
- 28.Pozdnyakova O, Miron P, Tang G, et al. Cytogenetic abnormalities in a series of 1,029 patients with primary myelodysplastic syndromes: A report from the US with a focus on some undefined single chromosomal abnormalities. Cancer. 2008;113:3331–3340. doi: 10.1002/cncr.23977. [DOI] [PubMed] [Google Scholar]
- 29.Bernasconi P, Klersy C, Boni M, et al. World Health Organization classification in combination with cytogenetic markers improves the prognostic stratification of patients with de novo primary myelodysplastic syndromes. Br J Haematol. 2007;137:193–205. doi: 10.1111/j.1365-2141.2007.06537.x. [DOI] [PubMed] [Google Scholar]
- 30.Cordoba I, González-Porras JR, Nomdedeu B, et al. Better prognosis for patients with del(7q) than for patients with monosomy 7 in myelodysplastic syndrome. Cancer. doi: 10.1002/cncr.26279. [epub ahead of print on Jun 29, 2011] [DOI] [PubMed] [Google Scholar]
- 31.Mallo M, Cervera J, Schanz J, et al. Impact of adjunct cytogenetic abnormalities for prognostic stratification in patients with myelodysplastic syndrome and deletion 5q. Leukemia. 2011;25:110–120. doi: 10.1038/leu.2010.231. [DOI] [PubMed] [Google Scholar]
- 32.Schanz J, Steidl C, Fonatsch C, et al. Coalesced multicentric analysis of 2,351 patients with myelodysplastic syndromes indicates an underestimation of poor-risk cytogenetics of myelodysplastic syndromes in the international prognostic scoring system. J Clin Oncol. 2011;29:1963–1970. doi: 10.1200/JCO.2010.28.3978. [DOI] [PMC free article] [PubMed] [Google Scholar]