

Abstract
Purpose
To determine the prognostic impact of persistent cytogenetic abnormalities at complete remission (CR) on relapse-free survival (RFS) and overall survival (OS) in patients with acute myeloid leukemia (AML) and to examine the potential role of allogeneic stem-cell transplantation (SCT) in this setting.
Patients and Methods
Data from 254 adult patients with AML (excluding acute promyelocytic leukemia) who achieved CR after induction chemotherapy on various first-line protocols were examined.
Results
Median follow-up for surviving patients was 43 months. Patients with cytogenetic abnormalities at CR (n = 71) had significantly shorter RFS (P = .001) and OS (P < .001) compared with patients with normal cytogenetics at CR (n = 183); 3-year RFS was 15% and 45%, and 3-year OS was 15% and 56%, respectively. Among the patients with persistent cytogenetic abnormalities at CR, those who underwent SCT in first CR (CR1; n = 15) had better RFS and OS compared to those without SCT (n = 56; P = .04 and .06, respectively). In multivariate analysis, persistent cytogenetic abnormalities at CR was an independent predictor for RFS (P < .001) and OS (P = .001), but among patients with persistent cytogenetic abnormalities at CR, no significant differences in OS (P = .25) was observed between those who did or did not receive SCT with a trend favoring SCT for RFS (P = .08).
Conclusion
Persistent cytogenetically abnormal cells at CR predict a significantly shorter RFS and OS. SCT in CR1 may improve the clinical outcome of patients lacking cytogenetic remission after induction although this depends on patient selection.
INTRODUCTION
Acute myeloid leukemia (AML) is a heterogeneous group of clonal hematopoietic progenitor cell disorders. Cytogenetic abnormalities are identified in approximately 55% of adult patients with AML. They are among the most important pretreatment factors for predicting clinical outcome.1–6 Despite considerable progress over the past three decades, and a relatively high remission rate (approaching 70% to 80% in younger adults) with intensive chemotherapy, only 30% to 40% of patients survive 5 years after diagnosis. Many patients will experience relapse, which is likely predisposed to by the presence of minimal residual disease (MRD).
Early assessment of treatment response may be useful to design risk-adapted treatment. It is important to identify both patients who are at high risk of relapse and need intensive postremission treatment, including allogeneic stem-cell transplantation (SCT), and patients who can potentially be cured with the current regimens and are likely not to need additional therapy, thereby reducing the treatment-related morbidity and mortality associated with postremission intensification. Few studies have addressed the prognostic significance of persistent cytogenetic abnormalities at the time of complete remission (CR) after induction or consolidation.7–9 To our knowledge, the potential advantages or disadvantages of SCT in this setting have not been examined to date. We undertook this study to determine further the prognostic significance of persistent cytogenetic abnormalities at CR in a relatively large cohort of patients with AML, and to examine the potential role of SCT in this setting. The study demonstrated that the presence of cytogenetically abnormal cells at CR after induction predicts for a shorter relapse-free survival (RFS) and overall survival (OS); thereby suggesting that these patients may benefit from further intensive treatment, such as SCT. However, in a multivariate analysis, SCT had no statistically significant impact on RFS and OS for these patients.
PATIENTS AND METHODS
Patients
We identified 357 consecutive newly diagnosed previously untreated patients with AML with cytogenetic abnormalities at initial diagnosis, who achieved CR after receiving induction therapy on various first-line protocols between January 2000 and February 2009 at the University of Texas MD Anderson Cancer Center. Patients with acute promyelocytic leukemia (APL) were excluded as the established therapeutic end point in APL is now clearly the achievement of molecular remission as defined by the absence of the PML-RARα fusion transcript using polymerase chain reaction and the prognostic significance of molecular CR is clearly established in this disease.10,11 Among these, 254 patients had a successful bone marrow (BM) cytogenetic analysis performed at the time of morphological CR after induction chemotherapy generally about 1 month after initiation of induction, and are the subject of this analysis. The induction regimens for these patients included high-dose ara-C (≥ 1 g/m2 per cycle) plus idarubicin (n = 96), plus fludarabine (n = 70), or plus miscellaneous drugs (such as daunorubicin, clofarabine, topotecan, troxacitabine, or liposomal daunorubicin, n = 44), or standard dose ara-C (< 1 g/m2 per cycle) with other agents (such as daunorubicin or clofarabine, n = 18); 26 patients had non-ara–C based regimens. All patients signed a consent approved by the institutional review board of the University of Texas MD Anderson Cancer Center for collection of samples and for participation in the ongoing clinical trials.
Cytogenetic Analysis and Definitions
All samples were analyzed by the standard cytogenetic techniques at University of Texas MD Anderson Cancer Center. To define a karyotype as normal, at least 20 metaphases from the BM were analyzed. For samples with abnormal cytogenetic, analyses with fewer than 20 metaphases were acceptable. Cytogenetic risk group was assessed based approximately on the criteria published by the Cancer and Leukemia Group B.2 The unfavorable-risk group included patients with −5, −7/7q-, inv(3), t(6;9), t(6;11), t(11;19), trisomy 8, or complex cytogenetic (≥ 3 abnormalities, excluding patients who had abnormalities with t,(8,21) inv(16)/t,(16,16) n = 120). All other patients were included in the intermediate-/favorable-risk group (n = 134).
CR was defined based on the criteria reported by the International Working Group.12 In order to achieve CR, patients had to have an absolute neutrophil count higher than 1,000/μL, platelet count higher than 100,000/μL, and be independent of transfusions, with a bone marrow examination that revealed fewer than 5% of blast cells, no Auer rods, and no cluster of blast cells. They also had to have no evidence of extramedullary leukemia. Relapse was defined as at least 5% blasts in the BM or development of extramedullary leukemia.
Statistical Analysis
OS was measured from the date of initial treatment until the date of death and censored on the date of the last follow-up if alive. RFS was measured from the date of remission until the date of relapse or death and censored on the date of last follow-up if alive.12 Descriptive statistics were calculated. Kaplan-Meier curves were used to estimate unadjusted OS and RFS. Log-rank tests were used to compare each time-to-event variable between groups. The Cox proportional hazards regression model was used to evaluate the ability of the relevant variables to predict either OS or RFS. Since the time between the remission and the transplant varies among patients, the transplant was treated as a time-dependent variable in the following Cox regression model so that the different time lengths from remission to transplant have been taken into consideration. For each studied factor, the relative risk (RR) of relapse or death was estimated in univariate and multivariate analyses controlling for other risk factors. The covariates examined included age, WBC, hemoglobin (Hgb), platelet, BM blast percentage, Eastern Cooperative Oncology Group performance status, lactate dehydrogenase (LDH), treatment regimen (ie, high-dose cytarabine [HDAC] versus standard dose cytarabine [SDAC] v others), sex, race, SCT, diagnosis (de novo versus secondary and therapy-related AML) and cytogenetic risk.
RESULTS
Predictors of Outcome
Among the 254 patients who had an evaluable cytogenetic study in CR, 71 (28%) had persistent cells with abnormal karyotype (ACCR) which were identical to the clone that was present at diagnosis, and 183 (72%) had normal cytogenetics at CR (NCCR). This is higher than what was reported by Marcucci7 but similar to the report by Freireich,8 perhaps due to single institution nature of these studies. The median age of all patients was 52.5 years (range, 18 to 86 years) and median follow-up for surviving patients was 43 months (range, 5 to 115 months). The presenting features of these patients are shown in Table 1. The pretreatment characteristics of the two group were similar including clinical parameters such as WBC, Hgb, performance status, sex, race, and proportion of patients who had therapy-related AML or secondary AML (arising from myelodysplastic syndrome or myeloproliferative disorder), However, the two groups differed by their median age (P < .001), platelet (P = .03), the percentage of BM blasts (P = .04), unfavorable cytogenetics (P < .001), and the percentage of patients receiving HDAC-based chemotherapy (P < .001). The median time from the initiation of treatment to CR was 29 days for the NCCR group compared with 35 days for ACCR group (P = .04). Similar proportion of patients in the two groups proceeded to an SCT in first CR (Table 1).
Table 1.
Clinical Characteristics at Presentation
| Characteristic | NCCR (n = 183) |
ACCR (n = 71) |
P | ||
|---|---|---|---|---|---|
| Median | Range | Median | Range | ||
| Age | 50 | 18-83 | 61 | 19-86 | < .001 |
| WBC | 6.1 | 0.3-300.5 | 3.2 | 0.6-433 | .67 |
| PLT | 43.5 | 6-463 | 66 | 7-470 | .03 |
| Hgb | 8.2 | 2.5-13.4 | 8.6 | 3-12.5 | .54 |
| BM blast, % | 50 | 5-94 | 36 | 8-96 | .04 |
| LDH | 881 | 264-8,336 | 598.5 | 259-8,460 | .001 |
| Time to CR | 29 | 19-215 | 35 | 20-409 | .04 |
| No. | % | No. | % | ||
|---|---|---|---|---|---|
| PS = 0 | 42 | 23 | 13 | 18 | .42 |
| Chemotherapy | |||||
| HDAC based | 162 | 89 | 48 | 68 | < .001 |
| SDAC based | 10 | 6 | 8 | 11 | |
| Other | 11 | 6 | 15 | 21 | |
| SCT | |||||
| Yes | 51 | 28 | 15 | 21 | .27 |
| No | 132 | 72 | 56 | 79 | |
| Sex, female | 87 | 48 | 31 | 44 | .53 |
| Race, white | 131 | 72 | 57 | 80 | .6 |
| Cytogenetic risk | |||||
| Unfavorable | 67 | 37 | 53 | 75 | < .001 |
| Favorable/Int | 116 | 63 | 18 | 25 | |
| Diagnosis | |||||
| AML (de novo) | 146 | 80 | 50 | 70 | .11 |
| S-AML/T-AML | 37 | 20 | 21 | 30 |
Abbreviations: NCCR, normal cytogenetics at complete response; ACCR, abnormal cytogenetics at complete response; PLT, platelet; Hgb, hemoglobin; BM, bone marrow; LDH, lactate dehydrogenase; CR, complete remission; PS, performance status; HDAC, high-dose cytarabine; SDAC, standard-dose cytarabine; SCT, stem-cell transplantation; Int, intermediate; AML, acute myeloid leukemia; S-AML, secondary AML; T-AML, therapy-related AML.
The ACCR group had statistically significant shorter RFS when compared to the NCCR group (median, 6 months; 95% CI, 4 to 8 months; and 21 months; 95% CI, 19 to 53 months, respectively, P < .001; Figure 1A). The two groups also had statistically significantly different OS (median, 11 months; 95% CI, 10 to 14 months; and 46 months; 95% CI, 34 to not reached; P < .001; Fig 1B). At 3 and 5 years, 45% (95% CI, 38% to 54%) and 41% (95% CI, 34% to 50%) for the NCCR group were alive and in CR versus 15% (95% CI, 8% to 26%) and 12% (95% CI, 6% to 24%) of the patients in the ACCR group. Corresponding estimated OS at 3 years and 5 years were 56% (95% CI, 48% to 64%) and 47% (95% CI, 39% to 56%) for the NCCR group, compared to 13% (95% CI, 8% to 27%) and 13% (95% CI, 8% to 27%) for the ACCR group.
Fig 1.
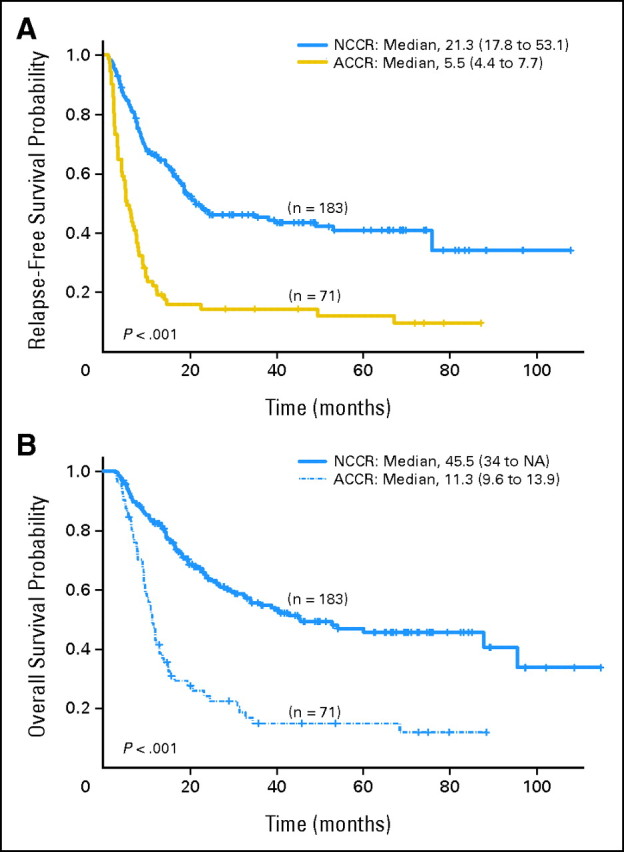
(A) Relapse-free survival by cytogenetic status at complete remission (CR). (B) Overall survival by cytogenetic status at CR. ACCR, abnormal cytogenetics at complete response; NCCR, normal cytogenetics at complete response; NA, not available.
The clinical outcome was also significantly different between the two groups when the analysis was done based on cytogenetic risk at diagnosis. One hundred twenty patients (47%) had unfavorable-risk cytogenetics, and 134 (53%) had intermediate and favorable risk karyotype. Among the patients with unfavorable-risk cytogenetics, RFS was significantly shorter for the ACCR group (n = 53) compared with the NCCR group (n = 67; median 5 months and 10 months, respectively, P < .001; Fig 2A and Table 2); 3-year RFS was 29% and 7%, respectively. OS was also significantly shorter for the ACCR group (median 11 months and 20 months, respectively, P < .001; Fig 2B and Table 2); 3-year OS was 32% and 8%, respectively. Similarly, when the analysis was limited to patients with favorable-/intermediate-risk groups (n = 134), the statistically significant difference between the ACCR group (n = 18) and NCCR group (n = 116) persisted with median RFS of 7 and 53 months, respectively (P = .005; Fig 2A and Table 2), and median OS of 17 and 88 months, respectively (P = .001; Fig 2B and Table 2); 3-year RFS was 33% and 55%, respectively, and 3-year OS was 32% and 70%, respectively. The RFS (Fig 2A) and OS (Fig 2B) for patients with unfavorable-risk cytogenetic at diagnosis who achieved normal cytogenetics at CR (n = 67) were similar to that of patients with favorable/intermediate risk with abnormal cytogenetics at CR (n = 18).
Fig 2.
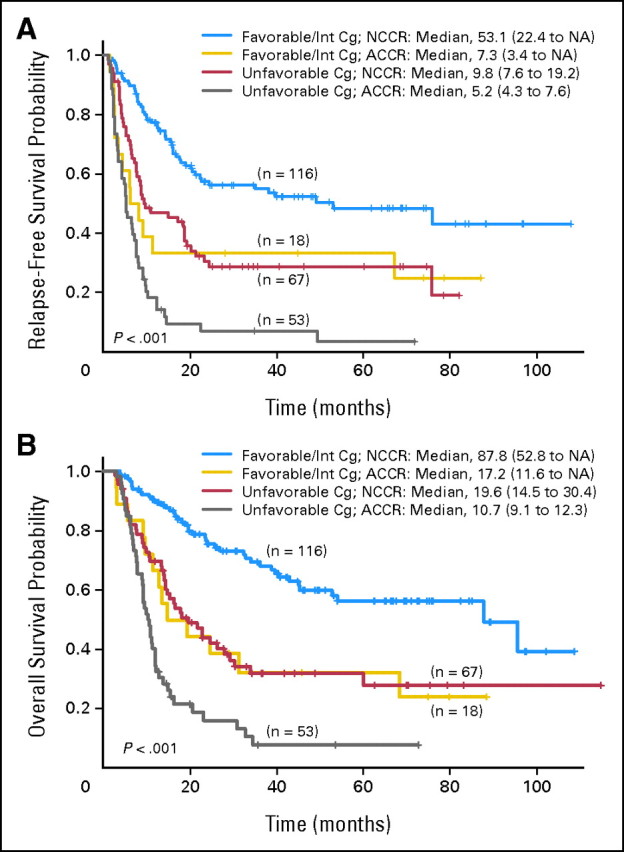
(A) Relapse-free survival by cytogenetic status at complete remission (CR) and cytogenetic risk at diagnosis. (B) Overall survival by cytogenetic status at CR and cytogenetic risk at diagnosis. ACCR, abnormal cytogenetics at complete response; Cg, cytogenetic; Int, intermediate; NCCR, normal cytogenetics at complete response.
Table 2.
Outcome of Treatment
| Parameter | No. | Parameter | No. | P |
|---|---|---|---|---|
| RFS | ||||
| Unfavorable Cg | 120 | NCCR v ACCR | 67 v 53 | < .001 |
| Favorable/Int Cg | 134 | NCCR v ACCR | 116 v 18 | .005 |
| NCCR | 183 | SCT v non-SCT | 51 v 132 | .06 |
| ACCR | 71 | SCT v non-SCT | 15 v 56 | .04 |
| All | 254 | NCCR v ACCR | 183 v 71 | < .001 |
| OS | ||||
| Unfavorable Cg | 120 | NCCR v ACCR | 67 v 53 | < .001 |
| Favorable/Int Cg | 134 | NCCR v ACCR | 116 v 18 | .001 |
| NCCR | 183 | SCT v non-SCT | 51 v 132 | .004 |
| ACCR | 71 | SCT v non-SCT | 15 v 56 | .06 |
| All | 254 | NCCR v ACCR | 183 v 71 | < .001 |
Abbreviations: RFS, relapse-free survival; Cg, cytogenetic; Int, intermediate; NCCR, normal cytogenetics at complete response; SCT, stem-cell transplantation; ACCR, abnormal cytogenetics at complete response; OS, overall survival.
Potential Role of SCT
Overall, 66 patients underwent SCT from matched sibling donors (n = 33) or matched unrelated donors (n = 28) at CR; four had alternative source donors (ie, cord blood) and the source in one patient who received his SCT elsewhere is unknown. The preparative regimen was fludarabine plus busulfan in 35, fludarabine plus melphalan in 25, and other investigational regimens in five; one patient underwent SCT elsewhere. Among them, 51 patients (77%) had normal, and 15 (23%) had abnormal cytogenetics at CR. In the ACCR group, patients receiving SCT (n = 15) had a significantly longer RFS (P = .04; Fig 3A and Table 2) and better OS (P = .06; Fig 3B and Table 2) compared to those without SCT (n = 56); 3-year RFS was 33% and 9%, and 3-year OS was 33% and 8%, respectively. Similarly, in the NCCR group, patient with SCT (n = 51) had a longer RFS (P = .06; Fig 3A and Table 2) and OS (P = .004; Fig 3B and Table 2) when compared to those patients without SCT (n = 122); 3-year RFS was 50% and 44%, and 3-year OS was 71% and 49%, respectively. Notably, the ACCR patients who had SCT could achieve similar RFS (P = .6; Fig 3A) and OS (P = .2; Fig 3B) when compared to NCCR patients without SCT.
Fig 3.
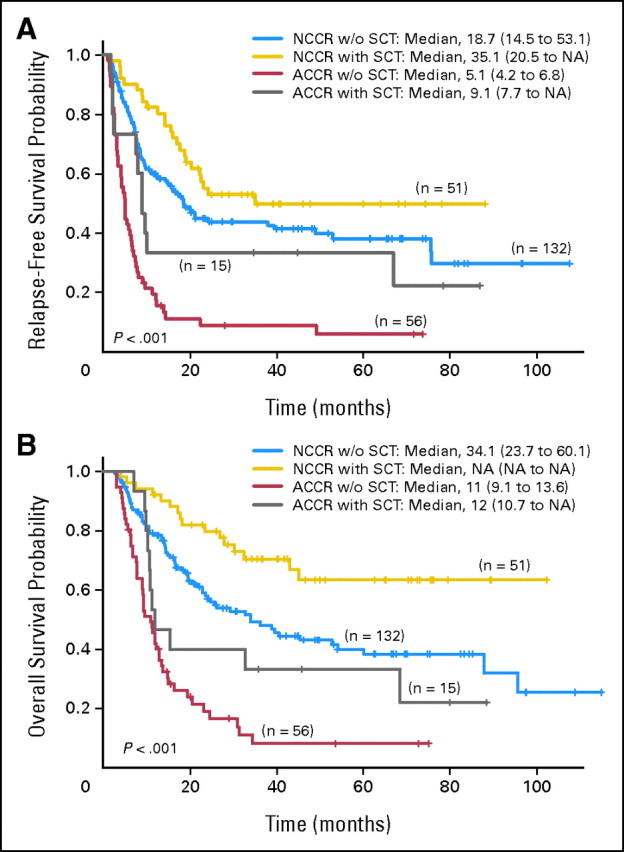
(A) Relapse-free survival by cytogenetic status at complete remission (CR) and stem-cell transplantation (SCT) status. (B) Overall survival by cytogenetic status at CR and SCT status. ACCR, abnormal cytogenetic at complete response; NCCR, normal cytogenetic at complete response; NA, not available.
Multivariate Analysis of Factors Predicting RFS and OS
We next analyzed risk factors using the Cox regression model (Table 3) when all variables in the Table 1 were considered. Univariate analysis indentified age (P < .001), WBC (P = .01), Hgb (P = .03), LDH (P < .001), treatment regimens (P < .001), SCT status (P = .002), cytogenetic status at CR (P < .001), and cytogenetic risk (P < .001) as independent poor prognostic factors for RFS, and age (P < .001), WBC (P = .005), LDH (P = .001), treatment regimens (P < .001), SCT status (P < .001), cytogenetic status at CR (P < .001), and cytogenetic risk (P < .001) as independent adverse prognostic factors for OS. For the multivariate fitted Cox regression model, nonsignificant variables in univariate analyses were eliminated using in a step-down fashion of a P cutoff of P = .1 (Table 3). The multivariate analysis identified persistent cytogenetic abnormalities at CR (n = 71) as being independently significant in predicting shorter RFS (P < .001) and shorter OS (P = .001). Again, when analysis was done within the patients with unfavorable cytogenetic group using the similar variables and methods (data not shown), statistically significant difference was seen in RFS (P = .003) and in OS (P = .02) between the ACCR group (n = 53) and NCCR group (n = 67). Among patients with favorable and/intermediate-risk groups, statistically significant difference was seen in RFS (P = .02) and in OS (P = .009) between the ACCR group (n = 18) and NCCR group (n = 116).
Table 3.
Multivariate Analysis of Prognostic Factors
| Parameter | Relapse-Free Survival |
Overall Survival |
||||
|---|---|---|---|---|---|---|
| HR | 95% CI | P | HR | 95% CI | P | |
| Age, per 10 years | 1.1 | 1.0 to 1.3 | .05 | 1.2 | 1.1 to 1.4 | .003 |
| Hemoglobin | 0.9 | 0.8 to 1.0 | .003 | 0.9 | 0.8 to 1.0 | .05 |
| Regimen, HDAC v SDAC | 1.4 | 0.8 to 2.3 | .16 | 1.3 | 0.8 to 2.1 | .30 |
| Cg, poor v other | 2.5 | 1.7 to 3.7 | < .001 | 2.7 | 1.8 to 4.2 | < .001 |
| ACCR v NCCR | 2.0 | 1.4 to 2.9 | < .001 | 1.8 | 1.2 to 2.7 | .001 |
| SCT, yes v no | 0.2 | 0.1 to 0.4 | < .001 | 0.3 | 0.2 to 0.6 | < .001 |
| Poor Cg, NCCR v ACCR | 0.5 | 0.3 to 0.8 | .003 | 0.6 | 0.4 to 0.9 | .02 |
| Other Cg, NCCR v ACCR | 0.5 | 0.2 to 0.9 | .02 | 0.4 | 0.2 to 0.8 | .009 |
| NCCR, SCT v non-SCT | 0.5 | 0.3 to 0.8 | .008 | 0.4 | 0.2 to 0.7 | .001 |
| ACCR, SCT v non-SCT | 0.5 | 0.3 to 1.1 | .08 | 0.7 | 0.3 to 1.3 | .25 |
Abbreviations: HR, hazard ratio; HDAC, high-dose cytarabine; SDAC, standard-dose cytarabine; Cg, cytogenetic; ACCR, abnormal cytogenetics at complete response; Other Cg, favorable/intermediate cytogenetic; NCCR, normal cytogenetics at remission; SCT, stem-cell transplantation.
When matched by other characteristics among the ACCR group, those who underwent SCT (n = 15) had a borderline better RFS (P = .08), but similar OS (P = .25) compared to patients without SCT (n = 56); among the patients with NCCR, statistically significant difference was seen in RFS (P = .008) and OS (P = .001) between SCT group (n = 51) and none-SCT group (n = 132). Interestingly, patients lacking cytogenetic remission at CR who received SCT (n = 15) had a similar RFS and OS compared to patients having cytogenetic remission at CR who did not receive SCT (n = 132).
DISCUSSION
The importance of MRD at the time of CR has been well demonstrated in patients with acute lymphoblastic leukemia.13,14 Limited data are available on the effect of persistent MRD on the outcome of adult patient with AML. Our results, derived from a relatively large group of adult patients with non-M3 AML, show that the persistence of previously detected cytogenetically abnormal clones at the time of CR after induction is predictive of a worse clinical outcome. This was true even in patients with unfavorable-risk cytogenetics at diagnosis. We analyzed 357 consecutive previously untreated patients with AML (excluding APL) with cytogenetic abnormalities at initial diagnosis, who achieved CR after receiving induction using various first-line regimens. Seventy-one patients had persistently abnormal karyotype at CR, making this the largest series to date examining the importance of achieving cytogenetic remission at CR in adult AML.7–9 Other smaller reports have examined the prognostic impact of persistent abnormal clones after consolidation,7 induction,8 or at the time of BM harvest for transplantation.9 Our results are consistent with a similar study of 15 patients with abnormal cytogenetics at morphologic CR by the Cancer and Leukemia Group B.8 The authors concluded that persistence of cells with abnormal karyotype predicted a shorter OS and RFS, as well as a higher relapse rate.
These data further confirm the potential role of MRD assessment for estimating the risk of relapse, which can complement the presenting characteristics well known to be predictors of outcome, such as cytogenetic and molecular abnormalities. Such data as well as more sensitive measures of MRD such as polymerase chain reaction for known molecular aberrations as well as flow cytometry, may allow treatment to be tailored to a patient's risk of relapse thereby avoiding the exposure to more intensive therapy in patients at low risk of relapse.
We analyzed whether SCT can improve the outcome of patients with abnormal karyotype at first CR (CR1) and found that patients who received SCT in CR1 (n = 15) had better RFS and OS compared to those without SCT (n = 56; P = .04 and .06, respectively). However, on multivariate analysis, after adjusting for other covariates, patients who underwent a SCT had a better RFS but not OS.
The extent of MRD at CR is largely unknown and patients may still harbor as many as 1010 leukemic cells. Morphological assessment of treatment responses is subjective and the limit of detection of leukemic cells by this method is only at a level of 1% to 5%. Therefore, the use of cytogenetic analysis, flow cytometry, and molecular methods to detect MRD can provide a more sensitive measure of residual leukemia. The disadvantage of cytogenetics is that it is labor intensive, lacks sensitivity (5%), and requires preparation of metaphase chromosomes. Fluorescent in situ hybridization improves the sensitivity level to 0.3% to 5%, without the requirement for dividing cells; but it is also labor-intensive. In addition, around 40% to 50% of patients with AML lack karyotypic abnormalities at diagnosis, negating their use to detect MRD.
Evaluation of MRD by real-time quantitative polymerase chain reaction detecting leukemia-specific targets including fusion gene transcripts15,16 and mutations such as NPM1 mutation17,18 has been recently established. In a study focusing on patients with the AML1-ETO fusion, molecular response was found to be independent of other pretreatment risk factors.16 However, leukemia-specific molecular targets are not available for approximately 40% of patients with AML. There has been considerable interest in developing alternative approaches to allow MRD detection to be extended to a much greater proportion of patients. The Wilms' tumor gene (WT1), which is overexpressed in approximately 70% to 90% of patients with AML, has the potential of being more universally applicable.19–23 The best-performing assay has a sensitivity of 1 target cells in 104 normal cells as demonstrated by the European LeukemiaNet.19 Reduction in WT1 after induction or consolidation both predicted a decreased risk of subsequent relapse.19 These results highlight the potential of early assessment of WT1 transcript reduction to enhance risk stratification, and to identify patients who may benefit from SCT.
MRD monitoring by multiparameter flow cytometry (MFC) and real-time quantitative polymerase chain reaction–based detection has been shown to be a powerful independent prognostic factor and is now routinely used to guide therapy in patients with acute lymphoblastic leukemia.24–27 The use of MFC for detection of MRD in AML by defining leukemia-associated immunophnotypes can be used in virtually all patients with AML (88% to 95%).28–36 Although immunophenotypic shifts could occur between diagnosis and relapse in 90% of cases, this did not prevent MRD analysis.31 The detection of residual disease by MFC after induction31,32,34,36 or consolidation28,30 was an independent predictor of shorter clinical outcome in both children31,32,34,36 and adults with AML.28,30 The use of targeted chemotherapy and SCT, in the context of comprehensive risk-stratification based on presenting genetic and molecular features, combined with MRD data, may improve outcome in patients with AML.32 Furthermore, the sensitivity of the test (0.1% to 0.01%) is likely to be improved by 6 to 8 color flow technology35 and by the characterization of markers such as CLL-1 that appear to differentiate between leukemic and normal stem cells.37–38
The observation that persistent cytogenetic abnormalities at CR after induction has an independent prognostic value in AML suggests that even with a less sensitive technique, persistent MRD can detect those patients that may benefit from early intensification of postremission therapy. This is particularly important as more sophisticated assay techniques, such as flow cytometry and molecular genetic analyses, vary significantly between laboratories, precluding their general use at present time. Furthermore, our data suggest that SCT may improve clinical outcome in these patients and should be considered in all patients with persistent abnormal karyotype in CR1. This study further emphasizes the potential role of detecting MRD in the future management of patients with AML.
Footnotes
Authors' disclosures of potential conflicts of interest and author contributions are found at the end of this article.
AUTHORS' DISCLOSURES OF POTENTIAL CONFLICTS OF INTEREST
The author(s) indicated no potential conflicts of interest.
AUTHOR CONTRIBUTIONS
Conception and design: Yiming Chen, Farhad Ravandi
Provision of study materials or patients: Jorge Cortes, Zeev Estrov, Stefan Faderl, Lynne Abruzzo, Guillermo Garcia-Manero, Partow Kebriaei, Tapan Kadia, Hagop Kantarjian, Farhad Ravandi
Collection and assembly of data: Yiming Chen, Sherry Pierce,Farhad Ravandi
Data analysis and interpretation: Yiming Chen, Jorge Cortes, Zeev Estrov, Stefan Faderl, Wei Qiao, Lynne Abruzzo, Guillermo Garcia-Manero, Sherry Pierce, Xuelin Huang, Partow Kebriaei, Tapan Kadia, Marcos De Lima, Hagop Kantarjian, Farhad Ravandi
Manuscript writing: Yiming Chen, Farhad Ravandi
Final approval of manuscript: All authors
REFERENCES
- 1.Grimwade D, Walker H, Oliver F, et al. The importance of diagnostic cytogenetics on outcome in AML: Analysis of 1612 patients entered into the MRC AML 10 trial. Blood. 1998;92:2322–2333. [PubMed] [Google Scholar]
- 2.Byrd JC, Mrózek K, Dodge RK, et al. Pretreatment cytogenetic abnormalities are predictive of induction success, cumulative incidence of relapse, and overall survival in adult patients with de novo acute myeloid leukemia: Results from Cancer and Leukemia Group B (CALGB 8461) Blood. 2002;100:4325–4336. doi: 10.1182/blood-2002-03-0772. [DOI] [PubMed] [Google Scholar]
- 3.Farag SS, Archer KJ, Mrózek K, et al. Pretreatment cytogenetics add to other prognostic factors predicting complete remission and long-term outcome in patients 60 years of age or older with acute myeloid leukemia: Results from Cancer and Leukemia Group B 8461. Blood. 2006;108:63–73. doi: 10.1182/blood-2005-11-4354. [DOI] [PMC free article] [PubMed] [Google Scholar]
- 4.Fenaux P, Preudhomme C, Laï JL, et al. Cytogenetics and their prognostic value in de novo acute myeloid leukemia: A report on 283 cases. Br J Haematol. 1989;73:61–67. doi: 10.1111/j.1365-2141.1989.tb00221.x. [DOI] [PubMed] [Google Scholar]
- 5.Schiffer CA, Lee EJ, Tomiyasu T, et al. Prognostic impact of cytogenetic abnormalities in patients with de novo acute nonlymphocytic leukemia. Blood. 1989;73:263–270. [PubMed] [Google Scholar]
- 6.Dastugue N, Payen C, Lafage-Pochitaloff M, et al. Prognostic significance of karyotype in de novo adult acute myeloid leukemia. Leukemia. 1995;9:1491–1498. [PubMed] [Google Scholar]
- 7.Freireich EJ, Cork A, Stass SA, et al. Cytogeneticcs for detection of minimal residual disease in acute myeloblastic leukemia. Leukemia. 1992;6:500–506. [PubMed] [Google Scholar]
- 8.Marcucci G, Mrózek K, Rupport AS, et al. Abnormal cytogenetics at date of morphologic complete remission predicts short overall and disease-free survival, and higher relapse rate in adult acute myeloid leukemia: Results from Cancer and Leukemia Group B study 8461. J Clin Oncol. 2004;22:2410–2418. doi: 10.1200/JCO.2004.03.023. [DOI] [PubMed] [Google Scholar]
- 9.Grimwade D, Walker H, Oliver F, et al. What happens subsequently in AML when cytogenetic abnormalities persist at bone marrow harvest? Results of the 10th UK MRC AML trial. Bone Marrow Transplant. 1997;19:1117–1123. doi: 10.1038/sj.bmt.1700804. [DOI] [PubMed] [Google Scholar]
- 10.Grimwade D, Vyas P, Freeman S. Assessment of minimal residual disease in acute myeloid leukemia. Curr Opin Oncol. 2010;22:656–663. doi: 10.1097/CCO.0b013e32833ed831. [DOI] [PubMed] [Google Scholar]
- 11.Freeman SD, Jovanovic JV, Grimwade D. Development of minimal residual disease-directed therapy in acute myeloid leukemia. Semin Oncol. 2008;35:388–400. doi: 10.1053/j.seminoncol.2008.04.009. [DOI] [PubMed] [Google Scholar]
- 12.Cheson BD, Bennett JM, Kopecky KJ, et al. Revised recommendations of the international working group for diagnosis, standardization of response criteria, treatment outcomes, and reporting standards for therapeutic trials in acute myeloid leukemia. J Clin Oncol. 2003;21:4642–4649. doi: 10.1200/JCO.2003.04.036. [DOI] [PubMed] [Google Scholar]
- 13.Patel B, Rai L, Buck G, et al. Minimal residual disease is a significant predictor of treatment failure in non T-lineage adult acute lymphoblastic leukaemia: Final results of the international trial UKALL XII/ECOG2993. Br J Haematol. 2010;148:80–89. doi: 10.1111/j.1365-2141.2009.07941.x. [DOI] [PubMed] [Google Scholar]
- 14.Spinelli O, Peruta B, Tosi M, et al. Clearance of minimal residual disease after allogeneic stem cell transplantation and the prediction of the clinical outcome of adult patients with high-risk acute lymphoblastic leukemia. Haematologica. 2007;92:612–618. doi: 10.3324/haematol.10965. [DOI] [PubMed] [Google Scholar]
- 15.Perea G, Lasa A, Aventín A, et al. Prognostic value of minimal residual disease (MRD) in acute myeloid leukemia (AML) with favorable cytogenetic [t (8; 21) and inv (16)] Leukemia. 2006;20:87–94. doi: 10.1038/sj.leu.2404015. [DOI] [PubMed] [Google Scholar]
- 16.Weisser M, Haferlach C, Hiddemann W, et al. The quality of molecular response to chemotherapy is predictive for the outcome of AML1-ETO-positive AML and is independent of pretreatment risk factors. Leukemia. 2007;21:1177–1182. doi: 10.1038/sj.leu.2404659. [DOI] [PubMed] [Google Scholar]
- 17.Papadaki C, Dufour A, Seibl M, et al. Monitoring minimal residual disease in acute myeloid leukaemia with NPM1 mutations by quantitative PCR: Clonal evolution is a limiting factor. Br J Haematol. 2009;144:517–523. doi: 10.1111/j.1365-2141.2008.07488.x. [DOI] [PubMed] [Google Scholar]
- 18.Bacher U, Badbaran A, Fehse B, et al. Quantitative monitoring of NPM1 mutations provides a valid minimal residual disease parameter following allogeneic stem cell transplantation. Exp Hematol. 2009;37:135–142. doi: 10.1016/j.exphem.2008.09.014. [DOI] [PubMed] [Google Scholar]
- 19.Cilloni D, Renneville A, Hermitte F, et al. Real-time quantitative polymerase chain reaction detection of minimal residual disease by standardized WT1 assay to enhance risk stratification in acute myeloid leukemia: A European LeukemiaNet study. J Clin Oncol. 2009;27:5195–5201. doi: 10.1200/JCO.2009.22.4865. [DOI] [PubMed] [Google Scholar]
- 20.Hämäläinen MM, Kairisto V, Juvonen V, et al. Wilms tumour gene 1 overexpression in bone marrow as a marker for minimal residual disease in acute myeloid leukaemia. Eur J Haematol. 2008;80:201–207. doi: 10.1111/j.1600-0609.2007.01009.x. [DOI] [PubMed] [Google Scholar]
- 21.Candoni A, Toffoletti E, Gallina R, et al. Monitoring of minimal residual disease by quantitative WT1 gene expression following reduced intensity conditioning allogeneic stem cell transplantation in acute myeloid leukemia. Clin Transplant. 2011;25:308–316. doi: 10.1111/j.1399-0012.2010.01251.x. [DOI] [PubMed] [Google Scholar]
- 22.Candoni A, Tiribelli M, Toffoletti E, et al. Quantitative assessment of WT1 gene expression after allogeneic stem cell transplantation is a useful tool for monitoring minimal residual disease in acute myeloid leukemia. Eur J Haematol. 2009;82:61–68. doi: 10.1111/j.1600-0609.2008.01158.x. [DOI] [PubMed] [Google Scholar]
- 23.Lapillonne H, Renneville A, Auvrignon A, et al. High WT1 expression after induction therapy predicts high risk of relapse and death in pediatric acute myeloid leukemia. J Clin Oncol. 2006;24:1507–1515. doi: 10.1200/JCO.2005.03.5303. [DOI] [PubMed] [Google Scholar]
- 24.Szczepański T. Why and how to quantify minimal residual disease in acute lymphoblastic leukemia? Leukemia. 2007;21:622–626. doi: 10.1038/sj.leu.2404603. [DOI] [PubMed] [Google Scholar]
- 25.Brüggemann M, Schrauder A, Raff T, et al. Standardized MRD quantification in European ALL trials: Proceedings of the Second International Symposium on MRD assessment in Kiel, Germany, 18-20 September 2008. Leukemia. 2010;24:521–535. doi: 10.1038/leu.2009.268. [DOI] [PubMed] [Google Scholar]
- 26.Krampera M, Perbellini O, Vincenzi C, et al. Methodological approach to minimal residual disease detection by flow cytometry in adult B-lineage acute lymphoblastic leukemia. Haematologica. 2006;91:1109–1112. [PubMed] [Google Scholar]
- 27.Kang H, Chen IM, Wilson CS, et al. Gene expression classifiers for relapse-free survival and minimal residual disease improve risk classification and outcome prediction in pediatric B-precursor acute lymphoblastic leukemia. Blood. 2010;115:1394–1405. doi: 10.1182/blood-2009-05-218560. [DOI] [PMC free article] [PubMed] [Google Scholar]
- 28.Buccisano F, Maurillo L, Spagnoli A, et al. Cytogenetic and molecular diagnostic characterization combined to post-consolidation minimal residual disease assessment by flow-cytometry improves risk stratification in adult acute myeloid leukemia. Blood. 2010;116:2295–2303. doi: 10.1182/blood-2009-12-258178. [DOI] [PubMed] [Google Scholar]
- 29.Al-Mawali A, Gillis D, Lewis I, et al. The role of multiparameter flow cytometry for detection of minimal residual disease in acute myeloid leukemia. Am J Clin Pathol. 2009;131:16–26. doi: 10.1309/AJCP5TSD3DZXFLCX. [DOI] [PubMed] [Google Scholar]
- 30.Maurillo L, Buccisano F, Del Principe MI, et al. Toward optimization of postremission therapy for residual disease-positive patients with acute myeloid leukemia. J Clin Oncol. 2008;26:4944–4951. doi: 10.1200/JCO.2007.15.9814. [DOI] [PubMed] [Google Scholar]
- 31.van der Velden VH, van der Sluijs-Geling A, Gibson BE, et al. Clinical significance of flowcytometric minimal residual disease detection in pediatric acute myeloid leukemia patients treated according to the DCOG ANLL97/MRC AML12 protocol. Leukemia. 2010;24:1599–1606. doi: 10.1038/leu.2010.153. [DOI] [PubMed] [Google Scholar]
- 32.Rubnitz JE, Inaba H, Dahl G, et al. Minimal residual disease-directed therapy for childhood acute myeloid leukaemia: Results of the AML02 multicentre trial. Lancet Oncol. 2010;11:543–552. doi: 10.1016/S1470-2045(10)70090-5. [DOI] [PMC free article] [PubMed] [Google Scholar]
- 33.MRD-AML-BFM Study Group. Langebrake C, Creutzig U, et al. Residual disease monitoring in childhood acute myeloid leukemia by multiparameter flow cytometry: The MRD-AML-BFM Study Group. J Clin Oncol. 2006;24:3686–3692. doi: 10.1200/JCO.2005.05.4312. [DOI] [PubMed] [Google Scholar]
- 34.Coustan-Smith E, Ribeiro RC, Rubnitz JE, et al. Clinical significance of residual disease during treatment in childhood acute myeloid leukemia. Br J Haematol. 2003;123:243–252. doi: 10.1046/j.1365-2141.2003.04610.x. [DOI] [PubMed] [Google Scholar]
- 35.Al-Mawali A, Gillis D, Hissaria P, et al. Incidence, sensitivity, and specificity of leukemia-associated phenotypes in acute myeloid leukemia using specific five-color multiparameter flow cytometry. Am J Clin Pathol. 2008;129:934–945. doi: 10.1309/FY0UMAMM91VPMR2W. [DOI] [PubMed] [Google Scholar]
- 36.Sievers EL, Lange BJ, Alonzo TA, et al. Immunophenotypic evidence of leukemia after induction therapy predicts relapse: Results from a prospective Children's Cancer Group study of 252 patients with acute myeloid leukemia. Blood. 2003;101:3398–3406. doi: 10.1182/blood-2002-10-3064. [DOI] [PubMed] [Google Scholar]
- 37.van Rhenen A, van Dongen GA, Kelder A, et al. The novel AML stem cell association antigen CLL-1 aids in discrimination between normal and leukemia stem cells. Blood. 2007;110:2659–2666. doi: 10.1182/blood-2007-03-083048. [DOI] [PubMed] [Google Scholar]
- 38.van Rhenen A, Moshaver B, Kelder A, et al. Aberrant marker expression patterns on the CD34+ CD38- stem cell compartment in acute myeloid leukemia allows to distinguish the malignant from the normal stem cell compartment both at diagnosis and in remission. Leukemia. 2007;21:1700–1707. doi: 10.1038/sj.leu.2404754. [DOI] [PubMed] [Google Scholar]