

Abstract
Purpose
We tested whether positron emission tomography (PET) with the caspase-3 targeted isatin analog [18F]WC-4-116 could image caspase-3 activation in response to an apoptosis-inducing anticancer therapy.
Procedures
[18F]WC-4-116 uptake was determined in etoposide-treated EL4 cells. Biodistribution studies with [18F]WC-4-116 and [18F]ICMT-18, a non-caspase-3-targeted tracer, as well as [18F]WC-4-116 microPET imaging assessed responses in Colo205 tumor bearing mice treated with death receptor 5 (DR5) targeted agonist antibodies. Immunohistochemical staining and enzyme assays confirmed caspase-3 activation. Two-way analysis of variance or Student’s t-test assessed for treatment-related changes in tracer uptake.
Results
[18F]WC-4-116 increased 8 ± 2-fold in etoposide-treated cells. The [18F]WC-4-116 %ID/g also increased significantly in tumors with high caspase-3 enzyme activity (p < 0.05). [18F]ICMT-18 tumor uptake did not differ in tumors with high or low caspase-3 enzyme activity.
Conclusions
[18F]WC-4-116 uptake in vivo reflects increased caspase-3 activation and may be useful for detecting caspase-3 mediated apoptosis treatment responses in cancer.
Keywords: apoptosis, caspase-3, cancer, positron emission tomography
INTRODUCTION
Apoptotic cell death is a regulated pathway that is required for homeostasis of organ function. However, malignant transformation of cells can occur via defects in the apoptotic pathway or overexpressed regulatory factors that prevent apoptosis [1]. These defects can also lead to treatment resistance [2]. Thus, a number of therapies targeted at either correcting deficiencies in or promoting apoptosis are currently in development to improve the treatment of cancer. Such therapies include death receptor 5 (DR5) agonists [3–4], inhibitors of Bcl-2 [5], SMAC mimetics [6–7], and inhibitor of apoptosis protein (IAP) antagonists [8–9], all of which effectively treat tumors in preclinical models by activating the effector caspases caspase-3 and caspase-7. Thus, methods that can detect apoptotic activation, and specifically caspase-3 activity, may be useful markers of treatment response for targeted apoptosis treatments.
Available methods for quantifying apoptosis require tissue sampling to assess the degree of apoptosis present. Noninvasive imaging measures of apoptosis would therefore be helpful for demonstrating the efficacy of apoptosis-inducing treatments without requiring tissue sampling. Several different imaging approaches have been developed to image apoptosis, including radiolabeled annexin V that targets phosphatidylserine (PS) residues exposed externally during apoptosis [10–12] and a cation-based tracer that is retained in normal cells but is released by mitochondrial membrane voltage changes induced during apoptosis [13]. However, PS residues are also exposed during necrosis, and decreases in tracer uptake as a result of treatment may be more difficult to use clinically than tracers that specifically increase binding as a result of apoptosis. ML-10 is another small molecule tracer for imaging apoptosis [14–16], but how it specifically targets apoptotic cells is unknown.
Radiolabeled isatin sulfonamides are reversible competitive caspase-3 inhibitors that have been developed as positron emission tomography (PET) tracers for imaging caspase-3 activation [17–25]. These have been used successfully to image apoptotic treatment responses in mouse models of cancer [20, 26]. Given their specific binding to caspase-3 (and to caspase-7 to a lesser extent), these analogs represent the only class of compounds that target this specific effector of apoptosis. Therefore, this class of tracers could potentially be used for measuring the response of therapies that target caspase-3-mediated apoptosis for cancer treatment.
For this study, we hypothesized that isatin sulfonamide analogs would be able to image caspase-3 activation in tumors treated with a DR5 targeted antibody. We first evaluated the in vitro characteristics and in vivo metabolism of several analogs. We then evaluated the ability of the most promising of these candidates, [18F]WC-4-116, to detect caspase-3 activation in a mouse model of tumor apoptosis induced by DR5 targeting antibodies. Given that all caspase-3 inhibitors also bind to caspase-7 to a lesser extent, we will refer to these tracers as caspase-3 targeted with the understanding that they also target caspase-7.
MATERIALS AND METHODS
Precursor synthesis and radiolabeling
The structures and affinities for caspase-3 of all the caspase-3 targeted tracers used for these studies are listed in Table 1. The precursors for all tracers were synthesized as described previously [19, 27] except for [18F]WC-4-36, the precursor synthesis scheme for which is shown in the Supplement (Scheme S1). [18F]WC-II-89 (1st generation) was radiolabeled as previously described [21]. [18F]WC-4-116, [18F]WC-4-122, and [18F]WC-4-131 (2nd generation compounds) as well as the previously published tracer [18F]ICMT-18 [20] was radiosynthesized using Cu(I) catalyzed cycloaddition of the correspondent alkyne precursor and [18F]fluoroethyl azide (2) (Fig. 1). [18F]WC-4-35 and [18F]WC-4-36 (3rd generation compounds) were radiosynthesized via a two-step procedure starting from radiolabeling of 4 and followed by reaction with the correspondent phenol precursor 5 or 6 (Fig. 1). The radiolabeling process took 90 min for the click synthesis and 150 min for the two-step procedure, after which the tracers were immediately used for the experiments as detailed below. The IC50 and EC50 values for all tracers were previously published [19, 28] except for the EC50 for WC-4-36, which was determined in HeLa cells treated with staurosporine as previously described [19] (Table 1). The Supplement includes additional details regarding precursor synthesis and radiolabeling.
Table 1.
Structures of isatin sulfonamide analogs as caspase-3 inhibitors
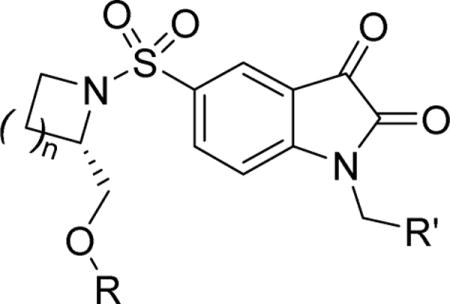


Figure 1.
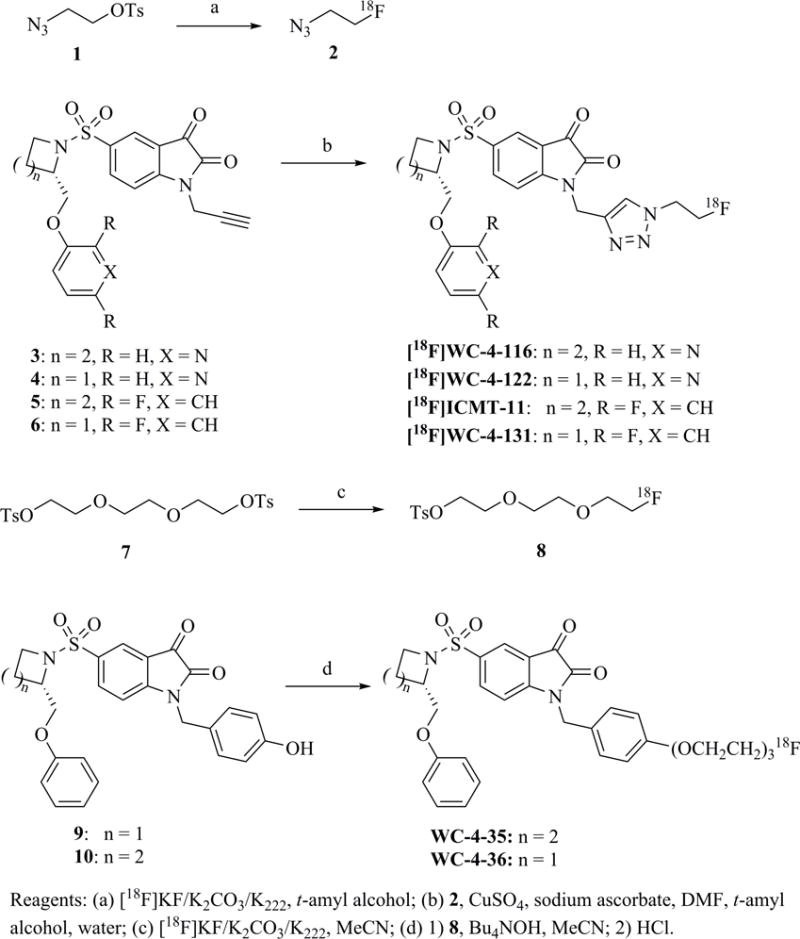
Scheme for radiosynthesis of isatin sulfonamide analogs as caspase-3 inhibitors.
Reagents for cell culture and animal studies
The institutional Animal Studies Committee approved all animal studies. The EL4 murine lymphoma cell line (ATCC) and Colo205 cells (gifts from Amgen and Novartis) were cultured in either Dulbecco’s Modified Eagle Medium (DMEM) or RPMI-1640, respectively, with 10% heat inactivated fetal calf serum (FCS), penicillin (100 U/ml), streptomycin (100 μg/ml), and glutamine (2 mM). Etoposide was obtained from Belford Laboratories. DR5-targeted antibodies M413 and LCR211 were also generous gifts from Amgen and Novartis, respectively. Cleaved caspase-3 targeting rabbit anti-mouse IgG antibody was obtained from Cell Signaling.
Cell uptake assay
A previously published model for inducing apoptosis in EL4 cells was employed for in vitro studies [29]. EL4 cells (1 × 10⁷ cells in 4 ml of media at 37° C) were treated with etoposide (20 μg/ml) or PBS for 16 hrs and then assayed with four different tracers: [18F]WC-4-116 (0.085 MBq, 2.3 μCi), [18F]WC-4-131 (0.081 MBq, 2.2 μCi), [18F]WC-4-35 (0.50 MBq, 13.5 μCi), and [18F]WC-4-36 (0.13 MBq, 3.5 μCi). [18F]WC-4-116 uptake was also determined in etoposide-treated EL4 cells with and without Q-VD-OPh, a pan-caspase inhibitor (25 μM added at the same time as etoposide). Cells were removed in 0.5 ml aliquots of media at 5, 30, and 60 min after tracer addition, washed twice with PBS and measured in a gamma counter. Cells were then counted by hemacytometer with trypan blue to determine cell viability. The tracer uptake was then expressed as the % cell activity normalized to the number of viable cells. For the tracer comparison studies, the protein samples were pooled for each treatment group to assess caspase-3 activity and thus were not analyzed statistically. Caspase-3 activity was determined for each individual cell pellet in the Q-VD-OPh studies. The individual measurements from each time point for tracer uptake and caspase-3 activity in the Q-VD-OPh studies did not vary with time after tracer injection; thus, they were summarized as the mean % cell activity and AFU/min/μg protein for statistical analysis. The fold increase for each tracer was determined as the ratio of the mean % cell activity for the treated group divided by that for the untreated control group. All studies were performed in duplicate.
Metabolism studies
Female Balb/c mice (8–10 weeks, 20g) were injected with 7.4 MBq (200 μCi) of each tracer and then sacrificed at either 5 or 30 min after tracer injection. Whole blood was obtained by heart puncture, placed in heparinized tubes, and centrifuged to separate cells from plasma. The liver (0.5 g) was also removed and immediately frozen on dry ice. Plasma (400 μl) or the liver sample was mixed or homogenized with a 1:1 acetonitrile:methanol solution and then centrifuged. The supernatant was then analyzed by thin layer chromatography (TLC) using silica gel TLC in 10% methanol/dichloromethane. The parent was confirmed by co-development with cold standard. All of the blood and liver fractions generated as a result of tissue processing were counted in a gamma counter (Beckman Gamma 6000). These measurements were then used to determine the percent of activity extracted into the supernatants used for TLC analysis. The percent of parent compound was calculated by the counts of parent over all counts, determined by radio-TLC. [18F]WC-4-116 (second generation) was evaluated on three separate experiments with two mice each (N = 6 total mice). [18F]WC-4-35 (third generation) was evaluated in two separate experiments with two mice each (N = 4 total mice).
Animal dosing for biodistribution and microPET studies
Female athymic nude mice (8–10 weeks, 20–25 g, Harlan Laboratories) were implanted with 1–2 × 10⁶ Colo205 human colon cancer cells in 100 μl of phosphate-buffered saline (PBS) in the mammary fat pads bilaterally. For all DR5 antibody treated animals, either [18F]WC-4-116 or [18F]ICMT-18 was injected either 16 hrs after a single intraperitoneal (i.p.) dose of M413 (based on internal pilot studies) or 6 hrs after the last of three 200 μg i.p. doses of LCR211 administered as previously described [30].
Biodistribution studies
[18F]WC-4-116 uptake was assessed in Colo205 tumor-bearing mice treated with either M413 or LCR211 (dosing described above) or PBS at 5, 30, or 60 min after injecting 1.2 ± 0.1 MBq (31 ± 1 μCi) or 1.6±0.1 MBq (43 ± 1 μCi) per mouse, respectively (N = 4 per treatment group per time point, thus giving a total of N = 8 control animals and N = 8 treated with either M413 or LCR211). A separate biodistribution study with M413-treated vs PBS-treated Colo205 tumor-bearing mice determined organ uptake of [18F]ICMT-18, a non-caspase-3 targeted tracer (1.2 ± 0.1 MBq/34 ± 2 μCi per mouse, N = 4 mice per treatment group per time point). A third biodistribution study determined [18F]WC-4-35 (1.2 ± 0.1 MBq/32 ± 2 μCi) uptake in untreated tumor-bearing mice (N = 4 at each time point). The following organs were harvested, blotted to remove excess blood, weighed, and counted in a gamma counter to determine the % injected dose per gram of tissue (% ID/g): tumors, blood, bone, brain, fat, heart, kidney, liver, lung, muscle, spleen, thymus, and tail. The tumors were additionally flash frozen on dry ice immediately after harvest, counted while frozen, and then stored at −80° C for later assessment of caspase-3 enzyme activity. Any animal with 10% or more of the injected dose in the tail was excluded from the analysis.
MicroPET imaging studies
Colo205 tumor-bearing mice treated with M413 or PBS (N = 6 per group) underwent a 60-min dynamic scan on Inveon PET/CT (Siemens) or Focus 220 PET scanners (Siemens/CTI) after injection of 10 ± 1.4 MBq (271 ± 39 μCi) of [18F]WC-4-116, preceded or followed by a microCT scan on the Inveon scanner. The mice were sacrificed after imaging and tumors removed to verify caspase-3 activity by the enzyme assay (N = 4 per group) or immunohistochemical (IHC) staining (N = 2 per group). The microPET and microCT images were coregistered using Integrated Research Workflow version 4.0 (Siemens). Volumes of interest drawn over the tumors determined time-activity curves.
Immunohistochemical staining
Tumors were fixed in 10% formalin and then embedded in paraffin. Five micron tumor sections were then deparaffinized through xylene and ethanol washes, rinsed with distilled water, and boiled in a rice cooker for 45 minutes in a 10 mM (pH 6.0) sodium citrate buffer for epitope retrieval. Sections were stained for cleaved caspase-3.
Caspase-3 enzyme activity assay
Caspase-3 enzyme activity was quantified as arbitrary fluorescence units per min per μg protein (AFU/min/μg protein) as previously described [17–18, 31] by incubating 200 μg of protein from homogenized tumors in assay buffer with 20 μM of Ac-DEVD-AMC substrate (Biomol International, LP, Plymouth Meeting, PA) ± 1 μM of the caspase-3 inhibitor Ac-DEVD-CHO (Sigma-Aldrich, St. Louis, MO).
Statistical Analysis
Data are expressed as the mean ± standard deviation (SD). One-way analysis of variance (ANOVA) (JMP, SAS, Cary NC) compared the log-transformed least square means for % viable cell tracer uptake and AFU/min/μg protein (caspase-3 enzyme activity) for the in vitro cell uptake experiments. Two-way ANOVA (time by treatment) also assessed for differences in the log-transformed least square means for the %ID/g and AFU/min/μg protein for the biodistribution studies, with tumors separated based on high or low caspase-3 activity since we intended to demonstrate that [18F]WC-4-116 uptake reflects in vivo caspase-3 activity. Therefore, a threshold of < 0.05 for the mean AFU/ug/min of both tumors of each mouse was used to group mice into “low” vs “high” caspase-3 activity groups. One-tailed Student’s t-test with post-hoc Bonferroni correction for multiple comparisons assessed for differences between M413 treated and untreated control mice in the microPET-determined %ID/cc at 30 min, the peak activity in the time-activity curve, % ID/cc at 30 min normalized to peak activity, and the AUC40–60min after log transformation. Student’s t-test also assessed for differences in AFU/min/μg protein in microPET-imaged mice. P < 0.05 determined statistical significance.
RESULTS
Cell uptake assays
Fig. 2 summarizes the cell uptake study results. The tracer uptake (% cell activity) and caspase-3 activity (AFU/min/μg protein) for all time points with each tracer were averaged together as neither of these parameters changed significantly with time in vitro. Etoposide-treated cells demonstrated higher relative uptake of [18F]WC-4-116 and [18F]WC-4-131 over untreated controls (average 6 ± 3 fold increase across all time points) relative to [18F]WC-4-35 and [18F]WC-4-36 (average 1.6 ± 0.2 fold increase). The AFU/min/μg protein for caspase-3 enzyme activity also demonstrated a pattern similar to that of the tracer uptake. [18F]WC-4-116 exhibited the highest relative uptake of all tracers (8 ± 2 fold increase). Pan-caspase inhibition with Q-VD-OPh significantly reduced both [18F]WC-4-116 uptake and caspase-3 enzyme activity in etoposide-treated cells.
Figure 2.
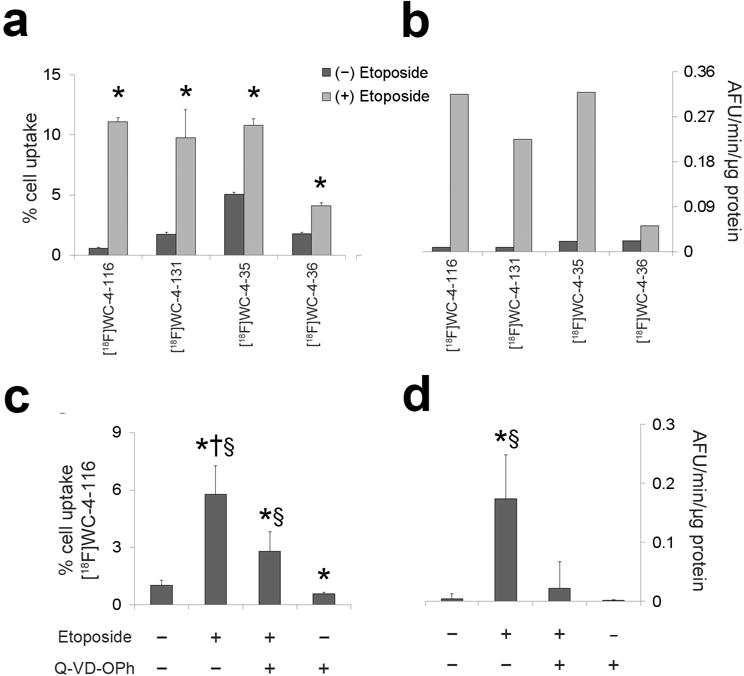
Cell uptake assays with radiolabeled isatins in EL4 murine lymphoma cells with or without etoposide (20 μg/ml). a Uptake for representative second ([18F]WC-4-116 and [18F]WC-4-131) and third ([18F]WC-4-35 and [18F]WC-4-36) generation tracers b and caspase-3 enzyme activity were assessed in EL4 cells with and without etoposide (20 μg/ml). c [18F]WC-4-116 uptake and d caspase-3 activity was additionally assessed in the presence or absence of the pan-caspase inhibitor Q-VD-OPh (bottom left panel). % cell uptake = percent of added activity measured in the cells normalized to 106 viable cells. AFU/min/μg protein = Arbitrary fluorescence units per minute per μg of protein. * p < 0.05 compared to untreated control. † p < 0.05 compared to etoposide+Q-VD-OPh. § p < 0.05 compared to Q-VD-OPh alone. The data were log-transformed for statistical testing; the actual values are shown in the graphs. The data are expressed as mean with standard deviation error bars. No error bars are shown in b because the protein samples at each time point were pooled to measure the caspase-3 activity for these experiments, thus yielding only two measurements to average.
Metabolism Studies
We determined the in vivo metabolism for [18F]WC-4-116 (second generation) and [18F]WC-4-35 (third generation) (structures listed in Table 1). The metabolism rate for [18F]WC-4-116 (Table 2) was similar to that previously published for [18F]ICMT-11 [20]. [18F]WC-4-35 was more stable in vivo in comparison to [18F]WC-4-116.
Table 2.
Metabolism of representative 2nd and 3rd generation isatin sulfonamides
| Compound | Organ | 5 min
|
30 min
|
||
|---|---|---|---|---|---|
| % parent | % extraction | % parent | % extraction | ||
| [18F]WC-4-116* | Blood | 60 ± 10 | 80 ± 3 | 23 ± 9 | 60 ± 23 |
| Liver | 32 ± 6 | 75 ± 5 | 16 ± 2 | 66 ± 5 | |
| [18F]WC-4-35** | Blood | 93 ± 5 | 94 ± 0.8 | 78 ± 12 | 94 ± 0.8 |
| Liver | 56 ± 6 | 71 ± 11 | 39 ± 7 | 67 ± 5 | |
% parent = percent of parent measured by thin-layer chromatography (TLC)
% extraction = percent of counts recovered from either plasma or liver for TLC analysis
N=6 animals, three separate experiments
N=4 animals, two separate experiments
Biodistribution studies
[18F]WC-4-116 had the lowest uptake in normal organs (Table 3). [18F]WC-4-35 had the highest background activity as well as the highest brain uptake of this tracer. [18F]WC-4-35 also had much higher uptake within tumors that persisted up to 60 min after tracer injection. In contrast, [18F]WC-4-116 activity in untreated tumors decreased between 30 and 60 min. When comparing tumor to organ ratios, the tumor:fat and tumor:muscle ratios were difficult to interpret given the wide variability in the measured activity in both fat and muscle. The tumor:blood ratios appeared to increase over time, most likely due to the rapid clearance of the tracer from the blood relative the tumors.
Table 3.
Tissue biodistribution of radiolabeled isatin sulfonamide analogs.
| [18F]WC-4-116 | [18F]WC-4-35 | |||
|---|---|---|---|---|
| 30 min | 60 min | 30 min | 60 min | |
| Blood | 0.55 ± 0.09 (0.40,0.65) |
0.36 ± 0.07 (0.26, 0.45) |
8.07 ± 2.23 (6.0, 10.4) |
3.77 ± 0.72 (3.1, 4.5) |
| Bone | 0.27 ± 0.19 (0.14, 0.68) |
0.12 ± 0.07 (0.06, 0.27) |
1.74 ± 0.33 (1.3, 2.0) |
2.44 ± 0.41 (2.0, 3.0) |
| Brain | 0.05 ± 0.01 (0.037, 0.057) |
0.03 ± 0.01 (0.023, 0.043) |
2.20 ± 0.12 (2.0, 2.3) |
2.05 ± 0.35 (1.6, 2.4) |
| Fat | 0.49 ± 0.36 (0.20, 1.2) |
0.40 ± 0.61 (0.06, 1.9) |
2.05 ± 0.45 (1.7, 2.7) |
1.50 ± 0.55 (1.0, 2.2) |
| Heart | 0.27 ± 0.05 (0.19, 0.33) |
0.17 ± 0.05 (0.12, 0.25) |
3.87 ± 0.14 (3.8, 4.0) |
2.96 ± 0.44 (2.6, 3.4) |
| Kidney | 1.50 ± 0.33 (1.1, 2.2) |
0.41 ± 0.11 (0.26, 0.57) |
4.41 ± 0.33 (4.0, 4.8) |
2.58 ± 0.50 (2.1, 3.1) |
| Liver | 3.00 ± 0.60 (2.3, 3.8) |
0.83 ± 0.27 (0.53, 1.4) |
5.31 ± 0.47 (4.8, 5.7) |
3.48 ± 0.61 (2.5, 3.7) |
| Lung | 1.50 ± 0.37 (1.1, 1.9) |
0.83 ± 0.15 (0.7, 1.2) |
5.21 ± 0.95 (4.1, 6.3) |
3.00 ± 0.58 (2.5, 3.7) |
| Muscle | 0.34 ± 0.43 (0.15, 1.4) |
0.55 ± 0.72 (0.07, 2.2) |
2.31 ± 0.22 (2.0, 2.5) |
1.84 ± 0.28 (1.6, 2.1) |
| Spleen | 0.44 ± 0.10 (0.33, 0.60) |
0.20 ± 0.04 (0.14, 0.25) |
4.08 ± 0.36 (3.7, 4.5) |
2.72 ± 0.51 (2.3, 3.3) |
| Tumor | 0.21 ± 0.04 (0.16, 0.28) |
0.12 ± 0.03 (0.07, 0.19) |
3.13 ± 0.22 (2.9, 3.5) |
2.99 ± 0.47 (2.3, 3.8) |
| Tumor:Blood | 0.40 ± 0.09 (0.27, 0.56) |
0.58 ± 0.25 (0.27, 1.06) |
0.42 ± 0.13 (0.27, 0.56) |
0.80 ± 0.13 (0.69, 1.06) |
|
| ||||
| N=4 for brain N=8 all other organs N=16 tumors |
N=4 for brain N=8 other organs N=16 tumors |
N=4 organs N=8 tumors |
N=4 organs N=8 tumors |
|
All values are % injected dose per gram of tissue (%ID/g), represented as mean ± standard deviation (minimum, maximum), except for the bottom row showing the tumor:blood ratio as indicated.
Fig. 3 summarizes the tracer uptake and caspase-3 enzyme activity for the biodistribution studies assessing [18F]WC-4-116 and [18F]ICMT-18 uptake in mice treated with DR5-targeted antibodies. Most of the tumors in antibody-treated mice demonstrated increased caspase-3 enzyme activity. For the [18F]WC-4-116 biodistribution studies, one mouse in the 5 min untreated group was excluded due to a poor tail vein injection. One mouse without antibody treatment in the 30 min group had high caspase-3 activity in both tumors (mean 0.19 AFU/min/μg protein), while two mice (4 tumors) treated with M413 had low tumoral caspase-3 activity (0.011 ± 0.001 AFU/min/μg protein). One mouse in the 30 min high caspase-3 group had only one tumor. [18F]WC-4-116 uptake was significantly higher in tumors at 30 min but not at 60 min, suggesting rapid washout of the tracer from the treated tumors (Fig. 3). The tumors that demonstrated increased caspase-3 enzyme activity also had increased [18F]WC-4-116 uptake.
Figure 3.
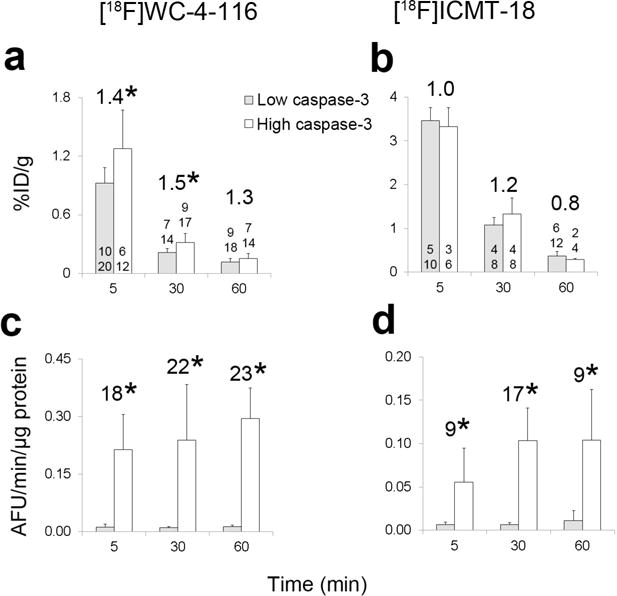
Biodistribution study results with [18F]WC-4-116 (caspase-3 targeted) or [18F]ICMT-18 (non-caspase-3 targeted) tracers. Both the percent injected dose per gram (%ID/g) of tracer (a, b) and caspase-3 enzyme activity (c, d) were determined in each tumor. The number of mice (top) and number of tumors (bottom) are listed at the base of or just above each bar. The fold-change in the mean value of the high vs low caspase-3 groups is listed as the larger number above the bars. In the [18F]ICMT-18 biodistribution study, a high outlier (2.2 %ID/g) in the 30 min high caspase-3 activity group was included in the analysis and in the graph. The fold-change between high and low caspase-3 activity groups was 1.1 without this high outlier. * p < 0.05.
In the [18F]ICMT-18 study, one treated mouse at 5 min and two mice at 60 min had low tumoral caspase-3 activity (mean 0.007 and 0.008 ± 0.004 AFU/min/μg protein, respectively). [18F]ICMT-18 uptake did not differ significantly among tumors with high or low caspase-3 enzyme activity, especially at 30 min where the number of mice remained balanced in the high and low caspase-3 groups. The 30 min high caspase-3 activity group contained one high outlier (2.2 %ID/g) with relatively low caspase-3 activity compared to the rest of the group (0.07 AFU/min/μg protein) that was included in the analysis. Without this outlier, the mean % ID/g for the high caspase-3 activity group (1.1±0.1 % ID/g) at 30 min was only 1.1 times higher than that of the low caspase-3 activity group (Fig. 3).
MicroPET imaging studies
MicroPET imaging with [18F]WC-4-116 demonstrated significantly increased % injected dose per cc tumor (% ID/cc) at 30 min post-tracer injection in M413 treated mice (Fig. 4), even after normalization for the peak %ID/cc in the time-activity curve (untreated = 0.34 ± 0.08, treated = 0.45 ± 0.18, unitless, one-tailed p = 0.011). The area under the curve (AUC) for [18F]WC-4-116 from 40 to 60 min (AUC40–60) also increased significantly with treatment. The peak activity in the time activity curves did not differ between the treatment groups (untreated = 2.3 ± 0.6, treated = 2.8 ± 0.8 %ID/cc, one-tailed p = 0.07). Treatment increased either caspase-3 enzyme activity or cleaved caspase-3 immunohistochemical staining in all tumors removed from treated mice (Fig. 5).
Figure 4.
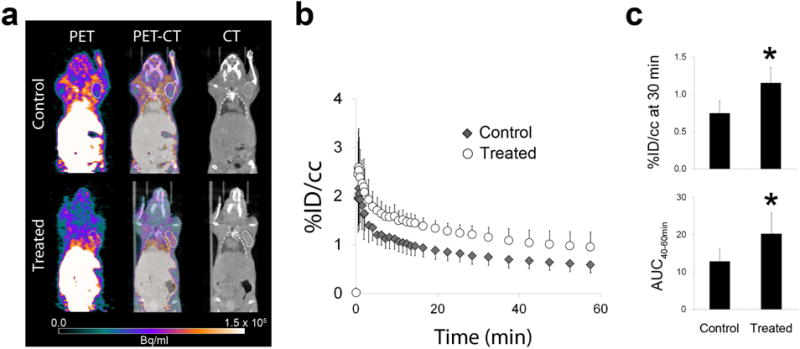
MicroPET imaging results. a Representative transaxial microPET (last 5 min of acquisition) and CT images, b time-activity curves, and c [18F]WC-4-116 uptake quantified as the % injected dose per cc (% ID/cc) at 30 min and the area under the curve from 40-60 min (AUC40–60min) are shown for N = 6 mice, N = 12 tumors per treatment group. The second tumor in the M413-treated mouse is not visible on this transaxial slice. The averaged time activity curves in the tumors are represented as the mean percent injected dose per cc of tumor (%ID/cc) with standard deviation bars. * p < 0.001.
Figure 5.
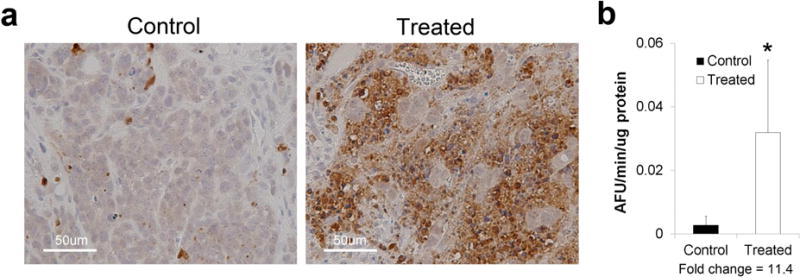
Caspase-3 activity verification in tumors from mice imaged by microPET. a Representative tumor sections were stained immunohistochemically for cleaved caspase-3 in N = 2 mice (N = 4 tumors) per treatment group. b Tumor caspase-3 enzyme activity was determined in N = 4 mice (N = 8 tumors) per treatment group. Fold-change = mean caspase-3 activity in tumors from M413-treated mice divided by mean activity of tumors from PBS-treated mice.
DISCUSSION
Our data support using radiolabeled isatins as markers of caspase-3 activation. Of the tracers evaluated, [18F]WC-4-116 had the best characteristics for imaging treatment induced apoptosis in tumors. In cell uptake studies, where uptake of each tracer should be optimized, [18F]WC-4-116 demonstrated the greatest fold increase as a result of caspase-3 activation, in line with its improved caspase-3 inhibition potency in whole cell assays compared to the other tracers as shown in Table 1 [19]. [18F]WC-4-116 activity was also low in normal organs, thus contributing the least amount of background activity. Therefore, we further assessed the ability of [18F]WC-4-116 to image caspase-3 in vivo by microPET and biodistribution studies, which demonstrated that caspase-3 activation led to increased [18F]WC-4-116 uptake.
[18F]WC-4-35 and [18F]WC-4-36 uptake also appeared to reflect caspase-3 activation in vitro, but their characteristics were less optimal for body tumor imaging. The hydrophilic pegylation added to these compounds improved their ability to diffuse into cells as previously published [19]. However, the fold change in uptake for these compounds after caspase-3 activation was lower than that of [18F]WC-4-116, also reflecting their higher EC50 values relative to [18F]WC-4-116. Normal tissues demonstrated much higher [18F]WC-4-35 retention that would potentially contribute to higher background levels. Untreated tumors also had much higher nonspecific retention of [18F]WC-4-35, in contrast to [18F]WC-4-116, which washed out of the untreated tumors over time. Therefore, we would expect a higher signal-to-noise ratio with [18F]WC-4-116 given these differences in the tumor kinetics of the two tracers.
Our data confirmed the specificity of [18F]WC-4-116 uptake for caspase-3 activation. The pattern of [18F]WC-4-116 uptake mirrored the changes in caspase-3 enzyme activity as a result of etoposide and Q-VD-OPh treatment in vitro. Because vascular disruption and subsequent leak might also lead to nonspecific tracer retention after antibody treatment, we further confirmed that tumor uptake of a non-caspase-3-targeted tracer, [18F]ICMT-18 [20], did not increase despite significantly increased caspase-3 activity in mice treated with DR5-targeted antibodies. Thus, our data, along with previously published data on the related tracers [18F]ICMT-11 [20] and [18F]WC-II-89 [17], support the ability of these compounds to measure caspase-3 activation specifically in vivo.
We originally reported the synthesis and biological evaluation of the first generation of radiolabeled isatins for imaging in vivo caspase-3 activation [17–18, 21, 32]. In models of liver apoptosis, we demonstrated that the best of our first generation tracers, [18F]WC-II-89, was specific but was not as sensitive for in vivo caspase-3 imaging as we had expected based on the in vitro data. Therefore, we investigated additional chemical modifications to the core isatin structure and also developed a whole cell assay to better assess the cell penetration of these compounds [19]. This last publication demonstrated that [18F]WC-4-116 had improved cell penetration compared to [18F]WC-II-89. During this time, a new radiolabeled isatin, [18F]ICMT-11, was published that was similar in structure to the compounds we had developed [20, 24]. Subsequent studies with [18F]ICMT-11 have demonstrated that its uptake is also specific for caspase-3, provides information about caspase-3 activation that 2-Deoxy-2-[18F]fluoro-D-glucose does not, and can be used to predict tumor treatment responses [26, 33], supporting human dosimetry studies for clinical applications [34]. When quantified by the AUC40–60 min, both [18F]WC-4-116 and [18F]ICMT-11 uptake demonstrated similar magnitudes of uptake in response to different apoptosis-inducing treatment interventions. The published time-activity curves with [18F]ICMT-11 also revealed a ~50% increase in uptake at 30 min with caspase-3 activation levels similar to those reported here. The metabolism of both [18F]ICMT-11 and [18F]WC-4-116 is fairly rapid; however, both tracers still accumulate visibly in treated tumors with caspase-3 activation. Thus, [18F]WC-4-116 and [18F]ICMT-11 appear to behave similarly in pre-clinical models.
Relative increases in [18F]WC-4-116 and [18F]ICMT-11 uptake are generally lower than the increases in caspase-3 enzyme activity in both in vitro and in vivo studies [26, 33]. Since these tracers are competitive inhibitors of caspase-3, uptake is related to direct binding of the tracer to activated caspase-3 without the benefit of a specific trapping mechanism to amplify the signal as in the case of the fluorescent cleavable substrate used in the enzyme activity assay. Thus, when comparing the uptake of these tracers with the substrate-based caspase-3 enzyme assay, we would expect the tracer uptake to be lower given the absence of a signal amplification mechanism for these tracers. We also attempted to optimize diffusion into cells to improve uptake by pegylating the third generation analogs, but we observed in both the cell uptake assays and biodistribution studies that the improved cell penetration of [18F]WC-4-35 led to increased nonspecific tracer retention. In contrast, [18F]WC-4-116 and [18F]ICMT-11 provided better contrast on the microPET images given their more rapid washout kinetics in normal tissues. Assessment in humans will best confirm whether the dynamic range of uptake for these tracers will be adequate for clinical use.
In conclusion, [18F]WC-4-116 uptake reflects apoptosis-induced caspase-3 activation. Our data suggest that [18F]WC-4-116 may be useful in clinical trials of targeted apoptosis therapeutics for cancer treatment.
Supplementary Material
Acknowledgments
The authors thank the staff of the Washington University School of Medicine Cyclotron Facility for isotope production, Nicole Fettig, Amanda Klaas, Margaret Morris, Lori Strong, and Ann Stroncek of the Small Animal Imaging Facility for performing the scans, Katherine Spayd for manuscript editing, and Novartis for providing the DR5 targeted antibody and tumor cells as gifts. Amgen provided funding for imaging M413-treated mice. NIH K08 EB006702 (PI: DLC), the Damon Runyon Clinical Investigator Award (PI: DLC) and NIH R33 CA121952 (PI: RHM) also provided support for these studies.
Footnotes
CONFLICT OF INTEREST
The authors declare that they have no conflicts of interest.
References
- 1.Schmitt CA. Senescence, apoptosis and therapy–cutting the lifelines of cancer. Nature reviews Cancer. 2003;3:286–295. doi: 10.1038/nrc1044. [DOI] [PubMed] [Google Scholar]
- 2.Faber AC, Ebi H, Costa C, Engelman JA. Apoptosis in targeted therapy responses: the role of BIM. Adv Pharmacol. 2012;65:519–542. doi: 10.1016/B978-0-12-397927-8.00016-6. [DOI] [PubMed] [Google Scholar]
- 3.Kaplan-Lefko PJ, Graves JD, Zoog SJ, et al. Conatumumab, a fully human agonist antibody to death receptor 5, induces apoptosis via caspase activation in multiple tumor types. Cancer biology & therapy. 2010;9:618–631. doi: 10.4161/cbt.9.8.11264. [DOI] [PubMed] [Google Scholar]
- 4.Forero-Torres A, Shah J, Wood T, et al. Phase I trial of weekly tigatuzumab, an agonistic humanized monoclonal antibody targeting death receptor 5 (DR5) Cancer biotherapy & radiopharmaceuticals. 2010;25:13–19. doi: 10.1089/cbr.2009.0673. [DOI] [PMC free article] [PubMed] [Google Scholar]
- 5.Vaillant F, Merino D, Lee L, et al. Targeting BCL-2 with the BH3 Mimetic ABT-199 in Estrogen Receptor-Positive Breast Cancer. Cancer cell. 2013;24:120–129. doi: 10.1016/j.ccr.2013.06.002. [DOI] [PubMed] [Google Scholar]
- 6.Brinkmann K, Hombach A, Seeger JM, et al. Second mitochondria-derived activator of caspase mimetic (SMAC)potentiates tumor susceptibility toward natural killer cell-mediated killing. Leukemia & lymphoma. 2013 doi: 10.3109/10428194.2013.807925. [DOI] [PubMed] [Google Scholar]
- 7.Allensworth JL, Sauer SJ, Lyerly HK, et al. Smac mimetic Birinapant induces apoptosis and enhances TRAIL potency in inflammatory breast cancer cells in an IAP-dependent and TNF-alpha-independent mechanism. Breast cancer research and treatment. 2013;137:359–371. doi: 10.1007/s10549-012-2352-6. [DOI] [PubMed] [Google Scholar]
- 8.Ardecky RJ, Welsh K, Finlay D, et al. Design, synthesis and evaluation of inhibitor of apoptosis protein (IAP) antagonists that are highly selective for the BIR2 domain of XIAP. Bioorg Med Chem Lett. 2013;23:4253–4257. doi: 10.1016/j.bmcl.2013.04.096. [DOI] [PMC free article] [PubMed] [Google Scholar]
- 9.Cai Q, Sun H, Peng Y, et al. A potent and orally active antagonist (SM-406/AT-406) of multiple inhibitor of apoptosis proteins (IAPs) in clinical development for cancer treatment. J Med Chem. 2011;54:2714–2726. doi: 10.1021/jm101505d. [DOI] [PMC free article] [PubMed] [Google Scholar]
- 10.Belhocine TZ, Blankenberg FG. 99mTc-Annexin A5 uptake and imaging to monitor chemosensitivity. Methods Mol Med. 2005;111:363–380. doi: 10.1385/1-59259-889-7:363. [DOI] [PubMed] [Google Scholar]
- 11.Yagle KJ, Eary JF, Tait JF, et al. Evaluation of 18F-annexin V as a PET imaging agent in an animal model of apoptosis. J Nucl Med. 2005;46:658–666. [PubMed] [Google Scholar]
- 12.Blankenberg FG, Kalinyak J, Liu L, et al. 99mTc-HYNIC-annexin V SPECT imaging of acute stroke and its response to neuroprotective therapy with anti-Fas ligand antibody. Eur J Nucl Med Mol Imaging. 2006;33:566–574. doi: 10.1007/s00259-005-0046-6. [DOI] [PubMed] [Google Scholar]
- 13.Madar I, Ravert H, Nelkin B, et al. Characterization of membrane potential-dependent uptake of the novel PET tracer 18F-fluorobenzyl triphenylphosphonium cation. Eur J Nucl Med Mol Imaging. 2007;34:2057–2065. doi: 10.1007/s00259-007-0500-8. [DOI] [PubMed] [Google Scholar]
- 14.Cohen A, Shirvan A, Levin G, et al. From the Gla domain to a novel small-molecule detector of apoptosis. Cell Res. 2009 doi: 10.1038/cr.2009.17. [DOI] [PubMed] [Google Scholar]
- 15.Aloya R, Shirvan A, Grimberg H, et al. Molecular imaging of cell death in vivo by a novel small molecule probe. Apoptosis. 2006;11:2089–2101. doi: 10.1007/s10495-006-0282-7. [DOI] [PMC free article] [PubMed] [Google Scholar]
- 16.Cohen A, Ziv I, Aloya T, et al. Monitoring of chemotherapy-induced cell death in melanoma tumors by N,N′-Didansyl-L-cystine. Technol Cancer Res Treat. 2007;6:221–234. doi: 10.1177/153303460700600310. [DOI] [PubMed] [Google Scholar]
- 17.Chen DL, Zhou D, Chu W, et al. Radiolabeled isatin binding to caspase-3 activation induced by anti-Fas antibody. Nucl Med Biol. 2012;39:137–144. doi: 10.1016/j.nucmedbio.2011.08.001. [DOI] [PMC free article] [PubMed] [Google Scholar]
- 18.Chen DL, Zhou D, Chu W, et al. Comparison of radiolabeled isatin analogs for imaging apoptosis with positron emission tomography. Nucl Med Biol. 2009;36:651–658. doi: 10.1016/j.nucmedbio.2009.03.008. [DOI] [PMC free article] [PubMed] [Google Scholar]
- 19.Chu W, Rothfuss J, Zhou D, Mach RH. Synthesis and evaluation of isatin analogs as caspase-3 inhibitors: introduction of a hydrophilic group increases potency in a whole cell assay. Bioorg Med Chem Lett. 2011;21:2192–2197. doi: 10.1016/j.bmcl.2011.03.015. [DOI] [PMC free article] [PubMed] [Google Scholar]
- 20.Nguyen QD, Smith G, Glaser M, et al. Positron emission tomography imaging of drug-induced tumor apoptosis with a caspase-3/7 specific [18F]-labeled isatin sulfonamide. Proc Natl Acad Sci U S A. 2009;106:16375–16380. doi: 10.1073/pnas.0901310106. [DOI] [PMC free article] [PubMed] [Google Scholar]
- 21.Zhou D, Chu W, Rothfuss J, et al. Synthesis, radiolabeling, and in vivo evaluation of an 18F-labeled isatin analog for imaging caspase-3 activation in apoptosis. Bioorg Med Chem Lett. 2006;16:5041–5046. doi: 10.1016/j.bmcl.2006.07.045. [DOI] [PubMed] [Google Scholar]
- 22.Faust A, Wagner S, Law MP, et al. The nonpeptidyl caspase binding radioligand (S)-1-(4-(2-[18F]Fluoroethoxy)-benzyl)-5-[1-(2-methoxymethylpyrrolidinyl)s ulfonyl]isatin ([18F]CbR) as potential positron emission tomography-compatible apoptosis imaging agent. Q J Nucl Med Mol Imaging. 2007;51:67–73. [PubMed] [Google Scholar]
- 23.Limpachayaporn P, Wagner S, Kopka K, et al. Synthesis, (18)F-Radiolabeling, and in Vivo Biodistribution Studies of N-Fluorohydroxybutyl Isatin Sulfonamides using Positron Emission Tomography. J Med Chem. 2013;56:4509–4520. doi: 10.1021/jm400257a. [DOI] [PubMed] [Google Scholar]
- 24.Smith G, Glaser M, Perumal M, et al. Design, synthesis, and biological characterization of a caspase 3/7 selective isatin labeled with 2-[18F]fluoroethylazide. J Med Chem. 2008;51:8057–8067. doi: 10.1021/jm801107u. [DOI] [PubMed] [Google Scholar]
- 25.Zhou D, Lee H, Rothfuss JM, et al. Design and synthesis of 2-amino-4-methylpyridine analogues as inhibitors for inducible nitric oxide synthase and in vivo evaluation of [18F]6-(2-fluoropropyl)-4-methyl-pyridin-2-amine as a potential PET tracer for inducible nitric oxide synthase. J Med Chem. 2009;52:2443–2453. doi: 10.1021/jm801556h. [DOI] [PMC free article] [PubMed] [Google Scholar]
- 26.Nguyen QD, Lavdas I, Gubbins J, et al. Temporal and Spatial Evolution of Therapy-Induced Tumor Apoptosis Detected by Caspase-3-Selective Molecular Imaging. Clin Cancer Res. 2013 doi: 10.1158/1078-0432.CCR-12-3814. [DOI] [PubMed] [Google Scholar]
- 27.Zhou D, Chu W, Chen DL, et al. [18F]- and [11C]-labeled N-benzyl-isatin sulfonamide analogues as PET tracers for apoptosis: synthesis, radiolabeling mechanism, and in vivo imaging study of apoptosis in Fas-treated mice using [11C]WC-98. Org Biomol Chem. 2009;7:1337–1348. doi: 10.1039/b819024k. [DOI] [PMC free article] [PubMed] [Google Scholar]
- 28.Chu W, Zhang J, Zeng C, et al. N-benzylisatin sulfonamide analogues as potent caspase-3 inhibitors: synthesis, in vitro activity, and molecular modeling studies. J Med Chem. 2005;48:7637–7647. doi: 10.1021/jm0506625. [DOI] [PubMed] [Google Scholar]
- 29.Al-Ejeh F, Darby JM, Tsopelas C, et al. APOMAB, a La-specific monoclonal antibody, detects the apoptotic tumor response to life-prolonging and DNA-damaging chemotherapy. PLoS ONE. 2009;4:e4558. doi: 10.1371/journal.pone.0004558. [DOI] [PMC free article] [PubMed] [Google Scholar]
- 30.Li J, Knee DA, Wang Y, et al. LBY135, a novel anti-DR5 agonistic antibody induces tumor cell-specific cytotoxic activity in human colon tumor cell lines and xenografts. Drug Dev Res. 2008;69:69–82. [Google Scholar]
- 31.Kumar S. Measurement of caspase activity in cells undergoing apoptosis. In: Brady HJM, editor. Apoptosis Methods and Protocols. Totowa: Humana Press, Inc.; 2004. pp. 19–30. [DOI] [PubMed] [Google Scholar]
- 32.Chu W, Rothfuss J, d’Avignon A, et al. Isatin sulfonamide analogs containing a Michael addition acceptor: a new class of caspase 3/7 inhibitors. J Med Chem. 2007;50:3751–3755. doi: 10.1021/jm070506t. [DOI] [PubMed] [Google Scholar]
- 33.Witney TH, Fortt RR, Aboagye EO. Preclinical assessment of carboplatin treatment efficacy in lung cancer by 18F-ICMT-11-positron emission tomography. PLoS ONE. 2014;9:e91694. doi: 10.1371/journal.pone.0091694. [DOI] [PMC free article] [PubMed] [Google Scholar]
- 34.Challapalli A, Kenny LM, Hallett WA, et al. 18F-ICMT-11, a caspase-3-specific PET tracer for apoptosis: biodistribution and radiation dosimetry. J Nucl Med. 2013;54:1551–1556. doi: 10.2967/jnumed.112.118760. [DOI] [PubMed] [Google Scholar]
Associated Data
This section collects any data citations, data availability statements, or supplementary materials included in this article.