

Abstract
Context:
Few authors have reported nationally representative data on the number of sport and recreation (SR) injuries resulting in emergency department (ED) visitation. The existing studies have only provided 1 or 2 years of data and are not longitudinal in nature.
Objective:
To use a novel algorithmic approach to determine if ED visitation is due to SR, resulting in a substantially larger longitudinal dataset.
Design:
Descriptive epidemiology study.
Setting:
Hospital.
Patients or Other Participants:
The National Hospital Ambulatory Medical Care Survey, a stratified random-sample survey of US hospital EDs was combined for years 1997–2009. There were 15 699 unweighted patient visits determined to be from SR.
Main Outcome Measure(s):
A custom algorithm classified SR visits based on the International Classification of Diseases, Ninth Revision, Clinical Modification E-code and pattern recognition of narrative text. Sport and recreation visits were assessed by age and categorized according to broad injury classifications. Additional quantification was performed on SR visits for lower extremity and knee-specific injuries. Sample weights were applied to provide national annual estimates.
Results:
Annually, 4 243 000 ED visits resulted from SR. The largest classification of injury from SR was sprains and strains (896 000/y). Males had substantially more SR-related ED visits than females (2 929 000/y versus 1 314 000/y). For patients 10–49 years old, 1 093 000 lower extremity and 169 000 knee-specific injury visits annually were from SR. For both injury types, males had a higher rate of ED visitation; however, females had 25% and 39% greater odds of visitation for lower extremity and knee-specific injury, respectively.
Conclusions:
The burden on the health system of ED visits from SR was substantial. Males presented in the ED at a higher rate for SR injury, though females had a higher proportion of lower extremity and knee-specific injury ED visitations from SR. This longitudinal analysis of population-level data provides the information to target research on specific subpopulations to mitigate SR injury.
Key Words: female athletes, general sports trauma, epidemiology, injury surveillance
Key Points
More than 4 million emergency department visits occurred each year from injuries sustained in sport and recreation; males accounted for more than two-thirds of these visits.
Of the visits resulting from sport and recreation, 1 million were for lower extremity injuries and 169 000 were for knee-specific injuries.
Sport and recreation injuries represent a substantial burden on the health care system in the United States, emphasizing the need for specifically trained medical professionals in this area.
Sport and recreation (SR) injuries have a substantial effect on public health in the United States1–3 and internationally.4 In the United States, an estimated 7 million Americans per year received medical attention for SR injuries between 1997 and 1999.3 Annual estimates for SR-related hospital emergency department (ED) visits ranged from 3.7 million in 19972 to 4.3 million in 2001.1 There has been particular interest in ED visits due to SR injuries in the pediatric population.5–10 Because the average cost of an ED visit in the United States is $985, the ED visit data are vital to understanding the fiscal implications of SR-related injury.11 If SR-related injuries represent a substantial financial burden, this may underscore the importance of onsite management of athletic injuries. Unfortunately, most of the previous literature on ED visits from SR contains only 1 or 2 years of data, is limited in population scope, or is more than a decade old, or a combination of these.1,2,3,5,6,10
Manual review of patient records is typically required to determine SR-injury status because the standardized International Classification of Diseases, Ninth Revision, Clinical Modification (ICD-9-CM) Supplemental Classification of External Causes of Injury and Poisoning (E-codes),12 used to ascertain the cause of injury, does not capture the full range of SR-injury activities.10 E-codes are designed to capture how an injury occurred and if it was intentional or accidental. Notably, many SR injuries are considered under the broad E-code classification of accidental falls (E880–E888), but not all accidental falls are associated with SR. Studies examining SR injuries in the ED are typically limited to a small number of years or to a smaller and well-defined subset of the population because this limits the quantity of patient records that need to be manually reviewed.2,3,5,6,10 Specifically, activities such as bicycling or riding an animal are well defined by E-codes, but the catch-all codes for sport may not capture the full scope of SR injuries. The manual inspection of verbatim or narrative text within patient records is also subject to human variability and errant classification. To my knowledge, only 1 study1 of a nationally representative subsample has used an algorithmic method to determine if an ED injury was a result of SR, and that study examined data only from 2000–2001. In addition to limiting human variability, using an algorithm to determine SR-injury status has the benefit of being scalable in that more data can be added without a substantial increase in the time to return results.
Being able to increase the amount of data within a nationally representative sample enables the reliable estimation of smaller subsets within those data.13 One year of data may not provide enough sample data points to reliably estimate the number of females, aged 10–19 years, visiting the ED because of SR injuries annually; however, aggregating 13 years of data likely provides enough sample data points to produce a reliable annual estimate.
In this study, I examined the National Hospital Ambulatory Medical Care Survey (NHAMCS) over a 13-year period (1997–2009). The study used a dual-algorithmic approach to determine if the ED visit was from an SR-related event. The purpose was to describe the number of SR-related visits to the ED over a long-term period in a nationally representative sample. The power of using larger datasets will be demonstrated by examining the previously reported discrepancies between the sexes in SR lower extremity14 and knee injuries.15 The advantages as well as pitfalls of big data will also be discussed.
METHODS
Study Design
The Centers for Disease Control and Prevention (CDC) maintain the NHAMCS. It is an annual, national probability sample of visits to nonfederal, general, and short-stay hospitals in the United States. The survey uses a 4-stage probability design with samples of geographically defined areas, hospitals within the areas, EDs within hospitals, and patient visits within EDs. The NHAMCS data were available from a publically available national database (http://www.cdc.gov/nchs/ahcd/ahcd_questionnaires.htm), and patient information was de-identified, so this study was exempt from informed consent.
Trained hospital staff or Census Bureau representatives completed the patient record form for each visit based on the medical record. The patient record includes all coding, demographic information, and drug information for that visit. I analyzed ED data from NHAMCS for the years 1997–2009. During this period, the hospital response rate from surveyed EDs was 93%, based on information provided by the CDC.
Data Processing
The injury was determined to be of SR origin via a dual-algorithmic method: (1) ICD-9-CM E-codes for cause of injury related to SR and (2) a pattern-recognition algorithm parsing the narrative text for cause of injury. The algorithm determined the visit to be from SR causes when either of these criteria was met; that is, only the E-code or the verbatim text needed to indicate that the visit was from SR, not both. The breakdown of unique unweighted visits discerned by the algorithm was as follows: 675 from E-codes only, 8956 from verbatim text only, and 6068 from both E-code and verbatim text. The NHAMCS has 3 fields where the cause of injury can be indicated with the designated E-code. If the primary, secondary, or tertiary cause of injury was 849.4 (accident in place for recreation and sport), 826.1 (pedal cycle accident injuring cyclist), 813.6 (motor vehicle accident with another vehicle, injuring cyclist), 828.2 (animal being ridden, injuring rider), 917.0 (sports accident without subsequent fall), 886.0 (fall in sports), or 917.5 (sports accident with subsequent fall), the injury was classified as arising from SR.
For all ED visits classified as injuries, 88% had narrative text that could be used to determine if the visit was due to an SR incident. Although previous researchers have manually inspected the narrative text fields,2,3,5,6,10 I used a pattern-recognition algorithm to match words and partial words that indicate the cause of injury was from SR. The words and partial words are contained in Appendix 1 and originated from an established schema2 with input from outside sports medicine professionals. The partial words were used to capture an object without discriminating its use in context. For instance, snowmobil captures instances of injury on a snowmobile or while one is snowmobiling. The data classified by the algorithm were inspected via a manual case analysis of at least 500 randomly selected observations, and adjustments were then made to the algorithm as necessary. Initial versions of the text-search algorithm used terms such as jump and raft, but this method misclassified visits due to jumping off the couch and damage to an established arteriovenous graft. The removal of raft eliminated only 86 errant observations over 13 years; however, these errant data would likely be contained within older patients and could substantially alter estimates within that group. I tested numerous iterations of the pattern-recognition algorithm until the manual case analysis of randomly selected observations revealed no clearly aberrant classification.
All injuries were classified into types based on their primary diagnosis by ICD-9-CM broad categorization (Appendix 2). Because the lower extremity and knee were of interest in the present analysis, the primary, secondary, and tertiary ICD-9-CM diagnoses codes were used to determine whether the injury was to the lower extremity (Appendix 3) and knee specific (Appendix 4).
Data Analysis
All data preprocessing and statistical analysis were performed in SAS (version 9.3; SAS Institute Inc, Cary, NC). To account for the complicated weighting scheme of NHAMCS, PROC SURVEYFREQ and PROC SURVEYLOGISTIC were used to calculate descriptive statistics and logistic regression, respectively. Confidence intervals (CIs) were calculated assuming a normal distribution. Rates of descriptive statistics were determined to be significantly different if the 95% CIs did not overlap. Logistic regression variables were significant if the 95% CI of the odds ratio did not include 1.
Comparison of the SR Classification Algorithm With Previous Research
Using an SR pattern algorithm is a novel method for determining whether the ED visit was from SR-related causes; it is important to corroborate findings from the present study with those of previous investigators who manually inspected narrative text. Therefore, the SR pattern algorithm was used to determine the number of ED visits for 5- to 24-year olds in 1997–1998,2 patients younger than 19 years in 1998,6 and patients younger than 19 years in 1997–2001.5 The algorithm was also tested against a study that used only E-codes for patients 13–19 years of age in 2008.9 Although I did not discriminate competitive sport-related visits from those caused by recreation, estimates approximating the present study and falling within the 95% CI provide a minimal level of external confirmation for the present method.
Quantifying and Examining the Sex Effect on Emergency Department Visits From Sport and Recreation
I assessed the SR-related ED visits longitudinally, 1997–2009. The national annual rates for sex, age decile, race, and injury classification were calculated using an established schema.16 Specific assessments examining the sexes were constrained to ages 10–49 years to capture the longest lifespan likely to contain pubescent through premenopausal patients. Based on specific diagnosis codes, the annual rates of total SR-related ED injuries, lower extremity injuries, and knee injuries were assessed by sex.
Separate survey-weighted logistic regressions were used to assess the effect of sex and age decile on the odds of an SR-related ED visit being diagnosed as either a lower extremity injury or a knee-specific injury. In each regression, the reference independent variables were males and the age decile, 10–19 years.
RESULTS
I used a dual-algorithmic method to determine if the ED visit was due to SR. This method was similar to that of previous authors who performed a manual analysis of 1 or 2 years of data (Table 1). In my study, visits from both sport and recreation were classified, compared with previous researchers who examined only ED visits from sport; nevertheless, the 95% CI estimates overlap with those of all but 1 previous study.
Table 1. .
Results of Sport and Recreation Algorithm Compared With Previous Research
| Study |
Age Range of Population, y |
Period Studied |
Type of Classification |
Emergency Department Visits Per Previous Study |
Algorithm Emergency Department Visits Per Current Study |
Comments About Previous Study |
| Burt and Overpeck2 (2001) | 5–24 | 1997–1998 | Manual | 2.6 million/y (95% CI = 2.0, 3.1) | 2.8 million/y (95% CI = 2.2, 3.5 million) | Only sport causes assessed. |
| Simon et al6 (2004) | 0–18 | 1998 | Manual | 2.3 million | 2.9 million (95% CI = 2.3, 3.4 million) | Only sport causes assessed. No 95% CIs reported. |
| Simon et al5 (2006) | 0–18 | 1997–2001 | Automated injury classification, secondary manual classification for sport | 2.5 million/y | 2.7 million/y (95% CI = 2.5, 2.9 million) | Only sport causes assessed. No 95% CIs reported. |
| Nalliah et al9 (2014) | 13–19 | 2008 | Automated using external cause of injury codes | 0.4 million | 1.4 million (95% CI = 1.1, 1.6 million) | Only sport causes assessed. No 95% CIs reported. |
Abbreviation: CI, confidence interval.
A longitudinal analysis of ED visits from SR indicated that no change occurred across the study period (Figure 1, overlapping 95% CIs). Males had more ED visits due to SR than females, the rate of ED visitation from SR was different across the lifespan, and different geographic regions had different rates of visitation (Table 2). The largest general classification of injury from SR was sprains and strains, though this was not higher than fractures or superficial injuries/contusions (Figure 2).
Figure 1. .

Emergency department visits from sport and recreation for each year during the study period (±95% confidence interval).
Table 2. .
Annual Rates of Sport- and Recreation-Related Emergency Department Visits
| Factor |
Unweighted Visits in Sample |
Annual Weighted Visits |
95% Confidence Limits |
| Total visits | 15 699 | 4 243 000 | 3 959 000, 4 527 000 |
| Sex | |||
| Male | 10 917 | 2 929 000 | 2 736 000, 3 122 000 |
| Female | 4782 | 1 314 000 | 1 209 000, 1 418 000 |
| Age, y | |||
| <10 | 3319 | 907 000 | 830 000, 985 000 |
| 10–19 | 6573 | 1 814 000 | 1 684 000, 1 945 000 |
| 20–29 | 2330 | 610 000 | 560 000, 659 000 |
| 30–39 | 1478 | 384 000 | 352 000, 417 000 |
| 40–49 | 1060 | 284 000 | 255 000, 312 000 |
| 50–59 | 461 | 120 000 | 101 000, 139 000 |
| 60–69 | 228 | 59 000 | 48 000, 70 000 |
| 70–79 | 157 | 42 000 | 33 000, 50 000 |
| >80 | 93 | 23 000 | 17 000, 28 000 |
| Region | |||
| Northeast | 3995 | 862 000 | 778 000, 946 000 |
| Midwest | 3627 | 1 068 000 | 950 000, 1 187 000 |
| South | 4453 | 1 360 000 | 1 182 000, 1 538 000 |
| West | 3624 | 953 000 | 786 000, 1 120 000 |
Figure 2. .

Annual emergency department visits from sport and recreation for broad injury classifications (±95% confidence interval).
A narrower analysis was performed on patients aged 10–49 years. This group had 1 093 000 lower extremity injuries (Table 3). Males had more lower extremity and knee-specific injuries than did females (Table 3, nonoverlapping 95% CIs). However, the logistic regression for lower extremity injury indicated that, after controlling for age, females had 25% greater odds of visiting the ED for an SR lower extremity injury than males (odds ratio: 1.25, 95% CI = 1.12, 1.39). Similarly, the logistic regression for knee-specific injury demonstrated that, after controlling for age, females had 39% greater odds of visiting the ED for an SR knee injury than did males (odds ratio: 1.39, 95% CI = 1.11, 1.74). For both the lower extremity and knee, patients in the third and fourth decades of life had greater odds of ED visitation for an SR injury than did patients 10–19 years (Figure 3, 95% CIs did not include 1).
Table 3. .
Annual Rates of Sport- and Recreation-Related Emergency Department Visits for Patients Aged 10 to 49 Years
| Factor |
Unweighted Visits in Sample |
Annual Weighted Visits |
95% Confidence Limits |
| Total lower extremity injuries | 4015 | 1 093 000 | 1 013 000, 1 172 000 |
| Males | 2766 | 744 000 | 689 00, 799 000 |
| Females | 1249 | 349 000 | 313 000, 384 000 |
| Total knee injuries | 601 | 169 000 | 152 000, 185 000 |
| Males | 391 | 109 000 | 95 000, 122 000 |
| Females | 210 | 60 000 | 50 000, 70 000 |
Figure 3. .
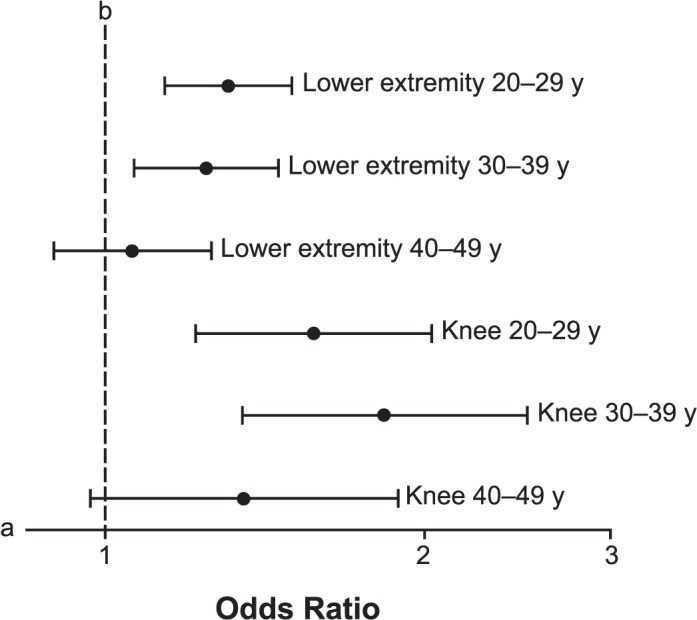
Forest plot of odds ratio estimates (±95% confidence interval) for knee injury and lower extremity injury by age decile after holding sex constant. a The axis is logarithmic. b Indicates the 10–19 years referent category.
DISCUSSION
The present study is the largest longitudinal analysis of a nationally representative sample of hospital EDs quantifying the number of patients receiving care due to injury from SR causes. This extended longitudinal analysis was enabled by the novel use of a pattern-recognition algorithm to scan patient descriptions of injury cause.
The algorithmic determination of injury cause has a substantial upside; however, the method also has limitations. The algorithm can be easily modified and allows additional data to be added to the analysis, extending only the computational time. The algorithm also allows for research reproducibility across studies and investigators. However, I was unable to classify visits by specific sport or recreation activities. For instance, the algorithm cannot determine if the ED visit was due to a collegiate wrestling match or a father wrestling with his children. This limitation is the primary benefit of a manual case analysis of narrative text. Indeed, the benefit of manual analysis has been leveraged by a number of investigators2,5,6 who classified specific sporting events resulting in ED visits for a smaller population. Best research practices for manual analysis involve having multiple independent coders categorize patient visits to increase reliability,2 but this method is very time intensive and limits the investigator's ability to alter the categorization schema when new research questions arise. Despite the differences among and the limitations of both the algorithmic and manual methods, the present algorithm produced results similar to those of most previous studies (Table 1). My results were vastly different from those of Nalliah et al9; however, they assessed only the external cause of injury codes, which are known to be an incomplete characterization of sport injury.5,6
The current algorithm uses a relatively simple method of text mining. The field of data science uses text mining and text analytics to examine patterns in unstructured data. Text analytics is a more common term that specifically uses linguistic, statistical, or machine-learning methods to perform higher-order analyses on text. I used a function available in SAS/STAT, PRXPARSE, though SAS has an entire module available for purchase (Text Miner), which performs higher-level analyses. (In the data-science field, text mining is commonly performed with R or Python, both of which are free and extremely powerful.) A well-known example of text analytics in the “real world” is the Google's ability to take user Web searches in sentence or phrase form and return targeted advertisements in addition to the requested search results. Although big data and text mining can be powerful tools, they are not without pitfalls. Google does not always return desired or expected Web sites when a viewer performs an Internet search; in the same way, our algorithm may have returned some visits that were described using SR-related terms but may not have been injuries from SR. I tested multiple iterations of the algorithm before settling on the present version. After testing of each iteration, a manual case analysis of a subset of the results was performed to determine if it contained any clearly erroneous data. My results appear to be reasonable based upon previous research (Table 1); however, this does not constitute a validation of the algorithm in the strictest sense. Indeed, I hope that future sports medicine researchers will develop and use more sophisticated algorithms to understand the effect of sports injuries on public health.
The NHAMCS data used differ from the National Electronic Injury Surveillance System (NEISS) data commonly used to study SR injuries in the ED,17,18 and both data sources have important advantages and disadvantages. For instance, NHAMCS provides E-codes and verbatim text for the causes of injuries dating to 1992, whereas NEISS was primarily designed to examine product-related injuries and has sport-related coding back to 1978. As NEISS was almost exclusively designed to capture injury estimates, these estimates can be retrieved with relative ease; NHAMCS, on the other hand, was designed to capture a wide array of hospital visits in the United States and requires greater technical skill to retrieve national estimates. Using NHAMCS, a researcher could determine the number of SR-related visits in which the patient was administered acetaminophen (Tylenol; Johnson & Johnson, New Brunswick, NJ) or other medications in the course of treatment. However, NEISS does not capture the treatment administered during the hospital visitation. Whereas NEISS contains only ED data, NHAMCS also contains an outpatient component that can potentially be mined for SR injury data back to 1973. The ability to examine both outpatient and ED data may lead to a more holistic assessment of SR-related injuries that receive care in the hospital setting.
The number of ED visits for SR injuries did not vary substantially across the 13-year period of this study (Figure 1). The annual rate of SR visits (4 243 000 ED visits) multiplied by the average cost of an ED visit ($985)11 results in an estimated $4.2 billion in health care expenditures annually from SR injury visits to the ED. The burden of health care expenditures from SR is unequal across the United States: the northeast had the lowest number of annual ED visits from SR, while the southern region had the highest. Many factors may affect the regional numbers, including relative SR participation and access to onsite medical practitioners, such as athletic trainers. The publically available NHAMCS data contain only regional classifiers, but more fine-grain data are available to qualified researchers. As previously reported, younger patients had substantially higher rates of ED visitation from SR injuries,2 an unsurprising result given that active recreation is most common in these age ranges. An interesting area for future research may be to investigate a crossover from SR-related injuries to occupationally related injuries in patients ages 16–30 years. A moderate portion of the present dataset had no narrative text (12% for all ages) to ascertain if the visit was due to SR; therefore, the total burden of SR visits on the health care system may be underrepresented. Unfortunately, NHAMCS does not collect data on why narrative text was not reported.
Males presented to the ED for more SR injuries than females, which corroborates previous research3 showing that males presented at more than twice the rate of females. My study extended these findings to demonstrate that males had nearly twice the rate of ED visits for lower extremity and knee-specific injuries from SR than females. However, when considering the population of patients visiting the ED for SR injury, females were 25% and 39% more likely to visit for lower extremity and knee-specific injuries, respectively. The higher total visitation rate for males is typically explained by a higher rate of sport participation19 or risk-taking behavior (or both).20 Although the current study is limited to the population of patients presenting to the ED for SR injury, the higher odds of visitation for females provide some corroboration of previous research15,21 showing that females had higher knee injury rates than males. This finding may be due to sociologic factors associated with ED visitation or physiologic differences between the sexes at the biomechanical22 or neurologic level.23
Many authors2,3,6,9 have detailed SR injury rates as presented in EDs across the lifespan, but the longitudinal nature of the current study provides sufficient data to assess multiple age ranges for lower extremity and knee-specific injuries. Compared with the first decade of life, ED visits for SR injury are more likely to be for lower extremity and knee injuries in the second and third decades of life.
The algorithmic method of ED visit classification enables a more reliable analysis of larger datasets than would typically be feasible with a manual analysis. This method made possible the largest longitudinal analysis of SR injury visits to the ED. Assuming the algorithm is valid, the larger amount of data enable an adequately powered estimation of ED visitation for smaller subgroups. Quantifying the subpopulation of the United States that visits the ED most frequently for SR injuries allows more targeted and effective research to mitigate and treat SR injuries.
Appendix 1. .
Algorithm Text Search Terms
| Basketball |
Football |
Tackle |
Baseball |
Softball |
Ball |
Dance |
Cricket |
Hockey |
Volleyball |
| Lacrosse | Rugby | Puck | Cycling | Bicycle | Bike | Ski | Surfing | Soccer | Snowboard |
| Snowmobil | Kayak | Swim | Diving | Board | Sled | Polo | Paddle | Ballet | Toboggan |
| Trampoline | Skating | Skate | Aerobics | Field | Oar | Run | Exercis | Tennis | Cheerleading |
| Weightlift | Hunting | Track | Archery | Catch | Gym | Hike | Fishing | Boxing | Bowling |
| Badminton | Hiking | Play | Racquet | Bungee | Jog | Golf | Racket | Squash | Wrestling |
| Horseback | Martial | Fencing | Frisbee | Sailing | Tag |
Appendix 2. .
Broad International Classification of Diseases, Ninth Revision, Clinical Modification Injury Classification
| Injury Classification |
Code |
| Fractures | 800.00–829.10 |
| Dislocations | 830.00–839.90 |
| Sprains and strains | 840.00–848.90 |
| Brain trauma | 850.00–854.19 |
| Internal organ trauma | 860.00–869.10 |
| Open wounds/amputations | 870.00–904.90 |
| Superficial injuries/contusions | 910.00–924.90 |
| Bony spine and disc injuries | 720.00–724.90 |
| Diffuse joint and soft tissue injuries | 725.00–729.99 |
| Other injuriesa | All nonspecified injuries |
Diagnosis did not fall within the predefined categories.
Appendix 3. .
International Classification of Diseases, Ninth Revision, Clinical Modification Codes Classified as Lower Extremity Injury
| Codes | |||
| 1711.05–1711.07 | 1711.15–1711.17 | 1711.25–1711.27 | 1711.35–1711.37 |
| 1711.45–1711.47 | 1711.55–1711.57 | 1711.65–1711.67 | 1711.75–1711.77 |
| 1711.85–1711.87 | 1711.95–1711.97 | 1712.15–1712.17 | 1712.25–1712.27 |
| 1712.35–1712.37 | 1712.85–1712.87 | 1712.95–1712.97 | 1715.15–1715.17 |
| 1715.25–1715.27 | 1715.35–1715.37 | 1715.95–1715.97 | 1716.05–1716.07 |
| 1716.15–1716.17 | 1716.25–1716.27 | 1716.35–1716.37 | 1716.45–1716.47 |
| 1716.55–1716.57 | 1716.65–1716.67 | 1716.85–1716.87 | 1716.95–1716.97 |
| 1717.00–1717.90 | 1718.05–1718.07 | 1718.15–1718.17 | 1718.25–1718.27 |
| 1718.35–1718.37 | 1718.45–1718.47 | 1718.55–1718.57 | 1718.65 |
| 1718.75–1718.77 | 1718.85–1718.87 | 1718.95–1718.97 | 1719.05–1719.07 |
| 1719.15–1719.17 | 1719.25–1719.27 | 1719.35–1719.37 | 1719.45–1719.47 |
| 1719.55–1719.57 | 1719.65–1719.67 | 1719.85–1719.87 | 1719.95–1719.97 |
| 1734.00 | 1735.00 | 1754.30–1754.79 | 1755.60–1755.69 |
| 1820.00–1820.90 | 1821.00-1821.39 | 1822.00–1822.01 | 1823.00–1823.92 |
| 1824.00–1824.90 | 1825.00–1825.39 | 1826.00–1826.10 | 1827.00–1827.10 |
| 1828.00–1828.10 | 1829.00–1829.10 | 1835.00–1835.13 | 1836.00–1836.69 |
| 1837.00–1837.10 | 1838.00–1838.19 | 1843.00–1843.90 | 1844.00–1844.90 |
| 1845.00–1845.19 | 1846.00–1846.90 | 1890.00–1897.70 | 1904.00–1904.90 |
| 1905.30–1905.40 | 1907.50 | 1916.00–1917.90 | 1924.00–1924.90 |
| 1928.00–1928.90 | 1945.00–1945.59 | 1958.92 | 1959.60–1959.70 |
Appendix 4. .
International Classification of Diseases, Ninth Revision, Clinical Modification Codes Classified as Knee-Specific Injury
| Code |
| 1717.00–1717.90 |
| 1836.00–1836.69 |
| 1844.00–1844.90 |
REFERENCES
- 1. Centers for Disease Control and Prevention (CDC). Nonfatal sports- and recreation-related injuries treated in emergency departments—United States, July 2000–June 2001. MMWR Morb Mortal Wkly Rep. 2002; 51 33: 736– 740. [PubMed] [Google Scholar]
- 2. Burt CW, Overpeck MD. Emergency visits for sports-related injuries. Ann Emerg Med. 2001; 37 3: 301– 308. [DOI] [PubMed] [Google Scholar]
- 3. Conn JM, Annest JL, Gilchrist J. Sports and recreation related injury episodes in the US population, 1997–99. Inj Prev. 2003; 9 2: 117– 123. [DOI] [PMC free article] [PubMed] [Google Scholar]
- 4. Finch C, Valuri G, Ozanne-Smith J. Sport and active recreation injuries in Australia: evidence from emergency department presentations. Br J Sports Med. 1998; 32 3: 220– 225. [DOI] [PMC free article] [PubMed] [Google Scholar]
- 5. Simon TD, Bublitz C, Hambidge SJ. Emergency department visits among pediatric patients for sports-related injury: basic epidemiology and impact of race/ethnicity and insurance status. Pediatr Emerg Care. 2006; 22 5: 309– 315. [DOI] [PubMed] [Google Scholar]
- 6. Simon TD, Bublitz C, Hambidge SJ. External causes of pediatric injury-related emergency department visits in the United States. Acad Emerg Med. 2004; 11 10: 1042– 1048. [DOI] [PubMed] [Google Scholar]
- 7. Taylor BL, Attia MW. Sports-related injuries in children. Acad Emerg Med. 2000; 7 12: 1376– 1382. [DOI] [PubMed] [Google Scholar]
- 8. Jones RS, Taggart T. Sport related injuries attending the accident and emergency department. Br J Sports Med. 1994; 28 2: 110– 111. [DOI] [PMC free article] [PubMed] [Google Scholar]
- 9. Nalliah RP, Anderson IM, Lee MK, Rampa S, Allareddy V, Allareddy V. Epidemiology of hospital-based emergency department visits due to sports injuries. Pediatr Emerg Care. 2014; 30 8: 511– 515. [DOI] [PubMed] [Google Scholar]
- 10. Meehan WP, 3rd, Mannix R. A substantial proportion of life-threatening injuries are sport-related. Pediatr Emerg Care. 2013; 29 5: 624– 627. [DOI] [PMC free article] [PubMed] [Google Scholar]
- 11. MEPSnet Household Component for 2011. Agency for Healthcare Research and Quality Web site. Published 2011. http://meps.ahrq.gov/mepsweb/data_stats/summ_tables/hc/mean_expend/2011/table1.htm. Accessed February 19, 2016. [Google Scholar]
- 12. Free ICD-9-CM codes. Alkaline Software. http://www.icd9data.com. Accessed December 2014. [Google Scholar]
- 13. McCaig LF, Burt CW. Understanding and interpreting the National Hospital Ambulatory Medical Care Survey: key questions and answers. Ann Emerg Med. 2012; 60 6: 716– 721. [DOI] [PubMed] [Google Scholar]
- 14. Gemmell IM. Injuries among female army recruits: a conflict of legislation. J R Soc Med. 2002; 95 1: 23– 27. [DOI] [PMC free article] [PubMed] [Google Scholar]
- 15. Arendt E, Dick R. Knee injury patterns among men and women in collegiate basketball and soccer NCAA data and review of literature. Am J Sports Med. 1995; 23 6: 694– 701. [DOI] [PubMed] [Google Scholar]
- 16. Hing E, Gousen S, Shimizu I, Burt C. Guide to using masked design variables to estimate standard errors in public use files of the National Ambulatory Medical Care Survey and the National Hospital Ambulatory Medical Care Survey. Inquiry. 2003; 40 4: 401– 415. [DOI] [PubMed] [Google Scholar]
- 17. Thurman DJ, Branche CM, Sniezek JE. The epidemiology of sports-related traumatic brain injuries in the United States: recent developments. J Head Trauma Rehabil. 1998; 13 2: 1– 8. [DOI] [PubMed] [Google Scholar]
- 18. Schieber RA, Branche-Dorsey CM, Ryan GW. Comparison of in-line skating injuries with rollerskating and skateboarding injuries. JAMA. 1994; 271 23: 1856– 1858. [PubMed] [Google Scholar]
- 19. Sabo D, Veliz P. The Decade of Decline: Gender Equity in High School Sports. Ann Arbor, MI: SHARP Center for Women and Girls; 2012. [Google Scholar]
- 20. Byrnes JP, Miller DC, Schafer WD. Gender differences in risk taking: a meta-analysis. Psychol Bull. 1999; 125 3: 367– 383. [Google Scholar]
- 21. Boling M, Padua D, Marshall S, Guskiewicz K, Pyne S, Beutler A. Gender differences in the incidence and prevalence of patellofemoral pain syndrome. Scand J Med Sci Sports. 2010; 20 5: 725– 730. [DOI] [PMC free article] [PubMed] [Google Scholar]
- 22. Ford KR, Myer GD, Hewett TE. Valgus knee motion during landing in high school female and male basketball players. Med Sci Sports Exerc. 2003; 35 10: 1745– 1750. [DOI] [PubMed] [Google Scholar]
- 23. Tenan MS, , Peng Y-L, Hackney AC, Griffin L. Menstrual cycle mediates vastus medialis and vastus medialis oblique muscle activity. Med Sci Sports Exerc. 2013; 45 11: 2151– 2157. [DOI] [PubMed] [Google Scholar]