Fig. 3.
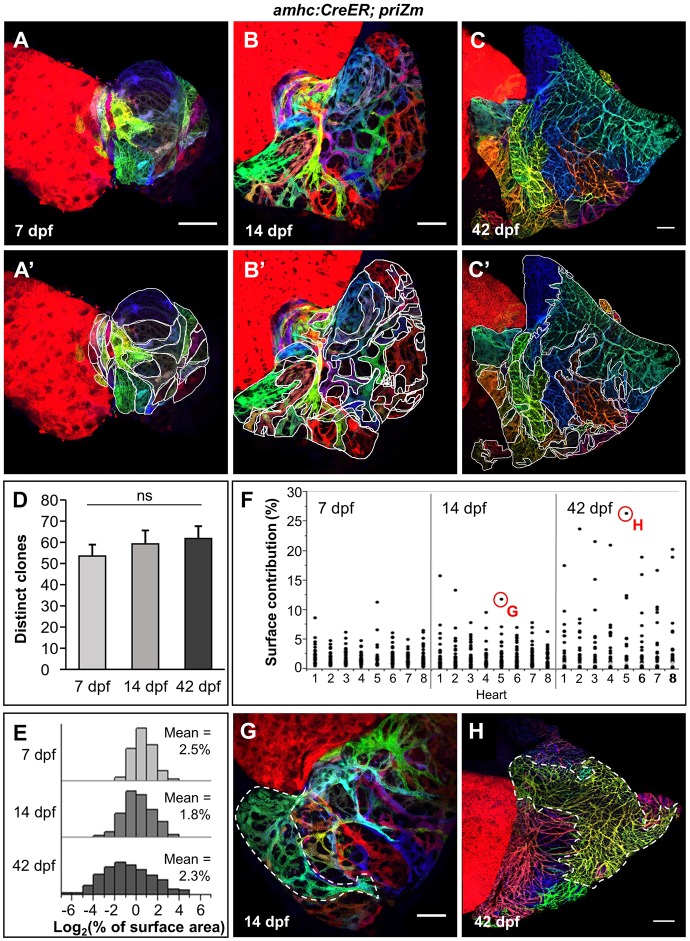
The atrial wall forms by heterogeneous expansion of clonally related muscle patches. (A-C) Surface myocardium of 7 dpf, 14 dpf and 42 dpf amhc:CreER; priZm hearts, respectively, with examples of traced clones outlined in white. (D) Number of distinct clones within 7 dpf, 14 dpf and 42 dpf amhc:CreER; priZm atria (means±s.e.m.; n=8 hearts each). The difference in the indicated means was not significant (ns) using one-way ANOVA (P>0.05). (E) Histograms of relative clone size distributions at 7 dpf, 14 dpf and 42 dpf. Data are aggregated from n=8 hearts per time point. The data are log-transformed to better show both tails of the distributions. (F-H) Distributions of relative clone sizes in individual hearts, grouped by age (n=8 at each time point), with indicated clones in F outlined in white from a 14 dpf (G) and a 42 dpf (H) heart. Scale bars: 50 µm in A,A′,B,B′,G and 100 µm in C,C′,H.

