

Abstract
Blood–brain barrier (BBB) disruption visualized in lesions by MRI is a major biomarker of disease activity in multiple sclerosis (MS). However, in MS, destruction occurs to a variable extent in lesions as well as in gray matter (GM) and in the normal appearing white matter (NAWM). A method to quantify the BBB disruption in lesions as well as in non-lesion areas would be useful for assessment of MS progression and treatments. The objective of this study was to quantify the BBB transfer rate (Ki) in WM lesions, in the NAWM, and in the full-brain of MS patients. Thirteen MS patients with active lesions and 10 healthy controls with age and gender matching were recruited for full-brain and WM Ki studies. Dynamic contrast-enhanced MRI (DCEMRI) scans were conducted using T1 mapping with partial inversion recovery (TAPIR), a fast T1 mapping technique, following administration of a quarter-dose of the contrast agent Gadolinium-DTPA (Gd-DTPA). The Patlak modeling technique was used to derive a voxel-based map of Ki. In all patients contrast-enhanced lesions, quantified by Ki maps, were observed. Compared with controls, patients with MS exhibited an increase in mean Ki of the full-brain (P-value<0.05) but no significant difference in mean Ki of NAWM. The identified increase in full-brain Ki of MS patients suggests a global vascular involvement associated with MS disease. The lack of observed significant decrease in Ki in NAWM suggests lower involvement of WM vasculature than full-brain vasculature in MS. Ki maps constructed from time series data acquired by DCEMRI provide additional information about BBB that could be used for evaluation of vascular involvement in MS and monitoring treatment effectiveness.
Keywords: Blood-brain barrier, Multiple sclerosis, Dynamic contrast-enhanced magnetic resonance imaging, Fast T1 mapping, Gadolinium, Transfer rate
1. Introduction
It has been shown that axonal injury, myelin destruction and vascular involvement occur in multiple sclerosis (MS) to a variable extent in MR-visible lesions and beyond them (Lassmann, 2011a, 2011b, 2011c). Brain atrophy (Bermel and Bakshi, 2006; Fisher et al., 2008; Miller et al., 2002) and a global reduction of cerebral blood flow (CBF) (Coisne and Engelhardt, 2011; D’Haeseleer et al., 2011; Nico and Ribatti, 2012) were reported in both gray (GM) and white matter (WM) areas in patients with MS. Damage to the blood–brain barrier (BBB) in patients with MS in areas corresponding to MR-visible lesions is frequently seen as contrast-enhanced area on longitudinal relaxation time (T1)-weighted MRI (Brochet et al., 2008; Filippi and Grossman, 2002; Filippi et al., 2011; Nessler et al., 2007). Although the leakage of the contrast agent from the BBB in MS lesions was shown by dynamic perfusion CT (Dankbaar et al., 2008, 2011; Hom et al., 2009; Schneider et al., 2010) and dynamic contrast-enhanced MRI (DCEMRI) (Larsson et al., 1990; Miller et al., 2007; Roberts et al., 2000; Silver et al., 1999, 2001; Soon et al., 2007a, 2007b), a global state of quantified impairment of BBB transfer rate (Ki) in the normal appearing white matter (NAWM) and in GM was not investigated. Recent technical advancements in MR imaging make it possible to investigate the global state of Ki. We adopted DCEMRI with a quarter-dose bolus of Gadolinium-diethylene triamine penta acetic acid (Gd-DTPA) and a fast T1 mapping sequence to acquire time series data about the health of BBB. Then we used the Patlak graphical method to generate a quantitative map of Ki on a voxel-by-voxel basis (Candelario-Jalil et al., 2011; Huisa et al., 2011; Taheri et al., 2011a, 2011b). We analyzed Ki maps for global alteration of BBB health in MS brain tissues. In this study Quantitative Ki maps were limited to six slices to reduce possible imaging artifacts and technical difficulties. Ki maps revealed high-grade and low-grade transfer rates of Gd-DTPA across the BBB in MS.
2. Materials and methods
2.1. Study participants
Thirteen relapsing/remitting MS (RRMS) patients from the University of New Mexico MS clinic with active lesions were entered into the study (mean ± SD age: 37 ± 11 [range 20–57] years). Ten patients were being treated with MS disease-modifying drugs that affected the BBB: seven were taking glatiramer acetate and/or interferon, two were on interferon alone, and one was on daclizumab. Three patients were not under any drug treatment (Table 1). Ten healthy age-matched controls (mean ± SD age: 38.8 ± 15 [range 22–62] years) free of current or previous neurological conditions, with normal neurological exams, and normal brain MRIs were recruited. All subjects underwent similar assessments consisting of physical and neurological examinations and had normal kidney function for contrast agent clearance. The study was approved by the institutional review board, and all participants signed informed consent.
Table 1.
Clinical details of cases used in this study.
| Case no. | Sex/age | Disease course | Drug | Number of MR-visible WM lesions (FLAIR) |
|---|---|---|---|---|
| MS01 | M/32 | RRMS | GA | 1 |
| MS02 | M/32 | RRMS | GA | 18 |
| MS03 | M/38 | RRMS | GA | 55 |
| MS04 | F/52 | RRMS | GA | 22 |
| MS05 | F/29 | RRMS | GA | 21 |
| MS06 | F/26 | RRMS | GA | 17 |
| MS07 | F/33 | RRMS | No MSD | 51 |
| MS08 | F/20 | RRMS | IFNB | 53 |
| MS09 | F/41 | RRMS | IFNB | 36 |
| MS10 | M/38 | RRMS | DAC | 27 |
| MS11 | F/57 | RRMS | No MSD | 10 |
| MS12 | M/52 | RRMS | No MSD | 16 |
| MS13 | M/33 | RRMS | GA | 5 |
| CO01 | F/22 | NA | NA | NA |
| CO02 | F/62 | NA | NA | NA |
| CO03 | F/35 | NA | NA | NA |
| CO04 | M/39 | NA | NA | NA |
| CO05 | F/31 | NA | NA | NA |
| CO06 | F/38 | NA | NA | NA |
| CO07 | F/47 | NA | NA | NA |
| CO08 | M/54 | NA | NA | NA |
| CO09 | F/24 | NA | NA | NA |
| CO10 | M/22 | NA | NA | NA |
CO = control; MS = multiple sclerosis; NA = not applicable; RRMS = relapsing remitting MS; GA = Glatiramer Acetate; Interferon-B1a = IFNB; Daclizumab = DAC.
2.2. Magnetic resonance data acquisition protocols
The MRI investigation was performed using a 1.5-Tesla Siemens whole-body clinical scanner with a standard eight channel array head coil (Siemens AG, Erlangen, Germany). There were two separate sessions of MR imaging. The first session was done with a full dose of Gd-DTPA (0.1 mmol/kg) as part of planned images required for clinical management and clinical trial protocols. Patients with active lesions were referred for the second imaging session. The second imaging session was conducted within 6 months of the first imaging with Gd-DTPA. To minimize the effect of dynamic nature of MS lesions on data analysis results, data that acquired in temporally close sessions were used for comparison and representations. For the second session, the MR imaging protocol consisted of three anatomical (T2-weighted, T1-weighted, and T2 fluid attenuated inversion recovery [T2 FLAIR]) and dynamic contrast-enhanced scans. For dynamic imaging data acquisition, the first T1 map was acquired pre-injection, and the rest were acquired post-injection of contrast agent. T2-weighted images were acquired with the turbo spin echo TSE technique (whole brain, axial orientation, TR/TE = 9040/64, number of averages = 1, slice thickness = 1.5 mm, FOV = 220 mm × 220 mm, matrix size = 192 × 192), and T1-weighted (T1w) images were acquired with the MPRAGE technique (whole brain, axial orientation, TR/TE/TI = 2400 ms/3.54 ms/1000 ms, flip angle = 8 degree, number of averages = 1, slice thickness = 1.2 mm, FOV = 220 mm × 220 mm, matrix size = 192 × 192). FLAIR images were acquired with the TIRM technique (whole brain, axial orientation, TR/TE/TI = 6000/358/2100 ms, number of averages = 2, slice thickness = 1.5 mm, FOV = 220 mm, matrix size = 192 × 192).
In DCEMRI, T1 was quantified with the T1 mapping with partial inversion recovery (TAPIR) sequence (Shah et al., 2001, 2003; Steinhoff et al., 2001; Zaitsev et al., 2003) using the following parameters: TR = 15 ms; banded readout scheme with three echoes at TE1:TE2:TE3 = 2.8:5.1:7.4 ms; α = 25°; FOV = 220 mm × 220 mm, slice thickness = 5.0 mm, slice gap = 5.0 mm; interleaved, number of slices = 6, number of averages = 1, Matrix size = 128 × 128, receiver bandwidth = 50 kHz; 20 time-points sampled on the relaxation curve; TI = 30 ms and preparation delay τ = 2 s. For this study, six slices above the ventricles were acquired as a compromise to shorten the time of study while minimizing the imaging artifacts. Imperfections due to the non-perfect inversion of the magnetization in TAPIR were corrected as required for an unbiased determination of T1 (Shah et al., 2003; Steinhoff et al., 2001; Zaitsev et al., 2003).
A quarter-dose (0.025 mmol/kg) of low molecular weight Gd-DTPA (MW = 938 Da; Bayer Healthcare) was used as contrast agent to perform DCEMRI (Taheri et al., 2011a, 2011b); this was done to provide an adequate washout curve for the DCEMRI study and brought the added benefit of reducing potential side effects of Gd-DTPA for patient safety. After acquiring the first T1 map, Gd-DTPA was infused within 5 s with an automatic power injector (Medrad Spectris Solaris® MR injection system) as a rapid intravenous bolus.
2.3. Data analysis methods
All the data processing, including image processing, transfer rate calculations, and volume analysis, was performed with custom software written in MATLAB (Mathworks, Natick, MA) and implemented on a PC running Ubuntu Linux 10.04. A series of tissue T1 relaxation images acquired by TAPIR were aligned and de-noised for calculation of transfer rates as described in recent publications (Taheri et al., 2011a, 2011b). The rate of transfer of Gd-DTPA from the vascular compartment into the tissue compartment, Ki, was calculated by employing a set of ordinary differential equations first proposed by Patlak (Patlak and Blasberg, 1985) and used by others (Essig et al., 2006; Ewing et al., 2003; Sood et al., 2007; Taheri and Sood, 2006). A statistical method was used to determine the distribution of values of Ki of all voxels in WM area of controls to establish a threshold of 3 × 10⁻⁴ ml/g-min based on the 95% confidence interval (Taheri et al., 2011b). We used this value for statistically classifying the higher values of Ki in WM of MS patients. The Ki values then were color-coded to map quantitatively the abnormal Ki.
We conducted a volumetric analysis to investigate for correlations between T2-weighted WM lesion volume (WMLV) and WM active lesion volume (WMALV) corresponding to the area with high Ki.
The WM volume was manually segmented and removed from the rest of the brain volume using the contrast difference in T2FLAIR images by a trained expert. WM masks were generated and used to strip out the rest of brain from WM and conduct analysis of Ki in WM. WMLV were calculated by manually drawing the volume of interest (VOI) around the area of hyperintensity on T2 FLAIR images by experts, and abnormal volumes were calculated as the sum of hyperintense voxels in VOI. A unified threshold for difference in intensity level was used to identify hyperintensity in images. This volume then removed from the WM volume to generate NAWM volume.
The volume of abnormal WM calculated from the Ki maps masked with FLAIR WM mask (volumes with higher transfer rate than the average of transfer rate of WM) were summed and averaged. Also to compare the state of BBB in MS with controls (without considering any threshold for abnormal Ki), the average of Ki was calculated for all voxels of the volume of the brain considered in the volume of data acquisition (covered by six slices 6 × 5 mm = 30 mm). Slices were carefully positioned to cover the maximum number of lesions and preferably be located above the ventricular area to reduce possible imaging artifacts and technical difficulties.
2.4. Statistical analysis
The BBB transfer rate data was analyzed statistically within the R statistical computing environment (R Development Core Team, 2008). The distribution of data were analyzed (Everitt and Hothorn, 2009) for inter-subject variability using the distribution finder in the R environment. Other statistical comparisons between data sets have been made based on the representation of mean ± SEM of data. T-test (parametric data) and Mann–Whitney test (non-parametric data) were used to detect statistical significance between data sets. For these tests, a significance level of P-value < 0.05 was adopted.
3. Results
3.1. MR-visible enhancing lesions
In all MS patients, WM lesions and contrast-enhanced lesions were detected respectively by T2 FLAIR and DCEMRI images. Hyperintensity in contrast-enhanced T1w images were corresponded to the hyperintensity of FLAIR images. In all patients with MS, from one to several foci of FLAIR hyperintensity within WM areas were observed. Representative axial slices from three different MR modalities acquired from a 32-year-old patient with RRMS are shown in (Fig. 1), revealing a single enhancing lesion confined to the WM. In this figure, the top row shows a hyperintense area in axial contrast-enhanced T1w images acquired after the injection of a full dose of Gd-DTPA, the middle row shows axial T2 FLAIR images with hyperintense area in WM, and the bottom row shows parametric images representing the abnormal color-coded Ki in the same locations. The comparison between the second and third rows shows that the elevated Ki highlighted by BBB transfer rate maps, corresponds to a higher portion of the abnormal area which was highlighted by contrast-enhanced T1w images. In this case, areas with higher values of Ki are limited to the T2 FLAIR detected lesion areas, and the Ki map represents a range of values for leakage of BBB in the lesion volume between 3 and 13 × 10−4 ml/g-min. Similar to this case, in the rest of patients we have observed variability in values of the Ki. The abnormal Ki in Fig. 1 shows that the area with higher leakage is located in the center of the lesion volume. However, we did not observe a similar pattern of variability in BBB leakage in the rest of the cohort.
Fig. 1.
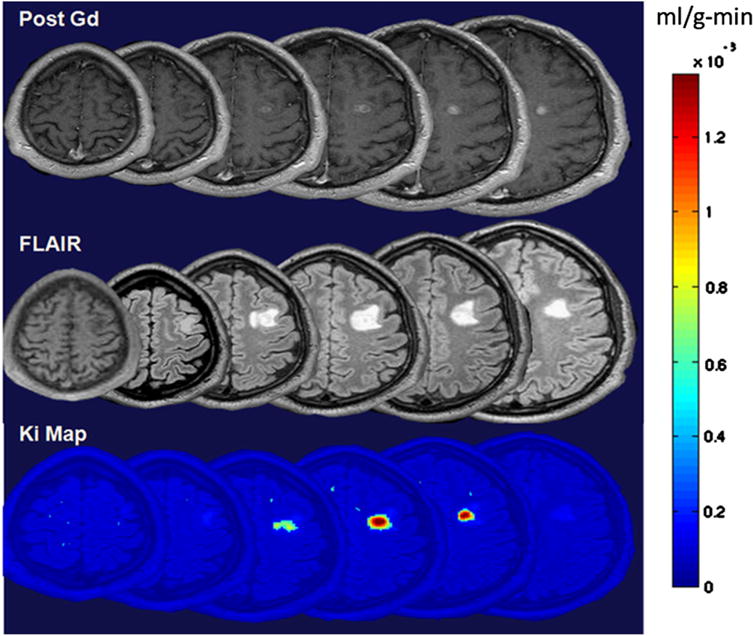
Representative images acquired from three different MR modalities in axial section showing an enhanced lesion in a 32-year-old patient with MS. Top row shows a series of T1 images acquired after IV injection of 0.1 mmol/Kg of Gd-DTPA. Hyperintense areas in figures of the top row represent the areas of an enhanced lesion. Middle row shows T2 FLAIR images in which hyperintense areas highlight abnormalities in WM. Bottom row shows BBB transfer rate maps for WM. These maps were overlaid on anatomical image for a better representation of leakage location. Color-coded BBB transfer rate map shows transfer rate values on a voxel-by-voxel basis. These images were acquired in temporally close sessions to minimize the effect of dynamic nature of lesions in MS. (For interpretation of the references to color in this figure legend, the reader is referred to the web version of this article.)
Averaged full-brain Ki in patients with MS and controls represented in Fig. 2. The distribution of average Ki for the age of controls and patients with MS are shown separately in two panels of this figure. There was a significant correlation between the age and mean Ki of full-brain of controls (p-value < 0.001, R2 = 0.5462). However, we did not observe a significant correlation between age and mean Ki of full-brain of patients with MS (R2 = 0.030) (right panel of Fig. 2).
Fig. 2.
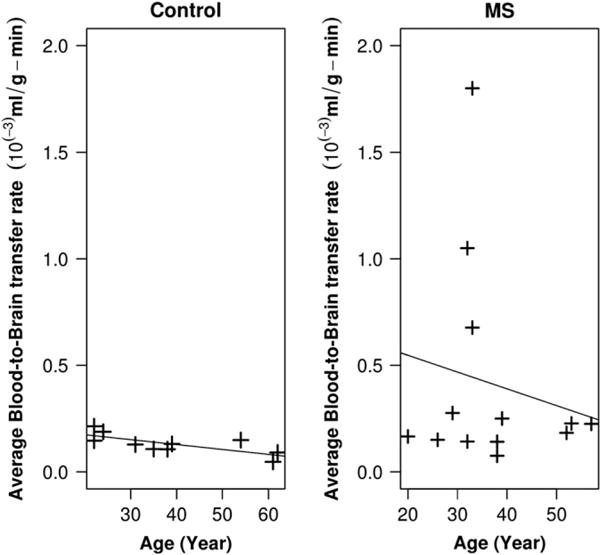
Averaged full-brain BBB transfer rate in MS and controls (calculated for the supraventricular area of brain). Left panel shows the distribution of average BBB transfer rate for the age of controls. There was a significant correlation between the age and BBB transfer rate in controls (p-value < 0.001, R2 = 0.5462). In the right panel, the distribution of full-brain BBB transfer rate in patients with MS is shown where no significant correlation between age and BBB transfer rate were observed (R2 = 0.030). Mean of BBB transfer rate for controls was 1.3 × 10⁻⁴ ml/g-min while the mean of BBB transfer rates of MS patients was 4.1 × 10⁻⁴. We found a statistically significant difference between these two means, with a p-value < 0.05.
3.2. BBB impairment in the full-brain, WM and GM
We found a significant difference between the average of Ki in the full-brain of MS patients (both under treatment and treatment-naïve) compared with those of controls. The mean Ki for controls was 1.3 × 10⁻⁴ ml/g-min while the mean Ki of MS patients was 4.1 × 10⁻⁴ ml/g-min significantly different with p-value < 0.05 (Fig. 3). Compared with the threshold value calculated for the 95% normal Ki in WM, both average values of WM and normal appearing white matter (NAWM) of MS were in the normal range. The interesting observation is that the mean of Ki in WM of controls was lower than the calculated mean Ki for the whole brain. In this group of patients though the mean full-brain Ki was higher than the mean Ki of full-brain of controls, we observed that also mean Ki of NAWM < mean Ki of full-brain. A statistical comparison between the mean Ki in WM and the mean Ki of full-brain is shown in Fig. 3. We did not find statistically significant differences in the mean Ki of WM of either treated or treatment-naïve MS compared with the WM of controls (p-value < 0.2) and we did not find significant difference with NAWM.
Fig. 3.
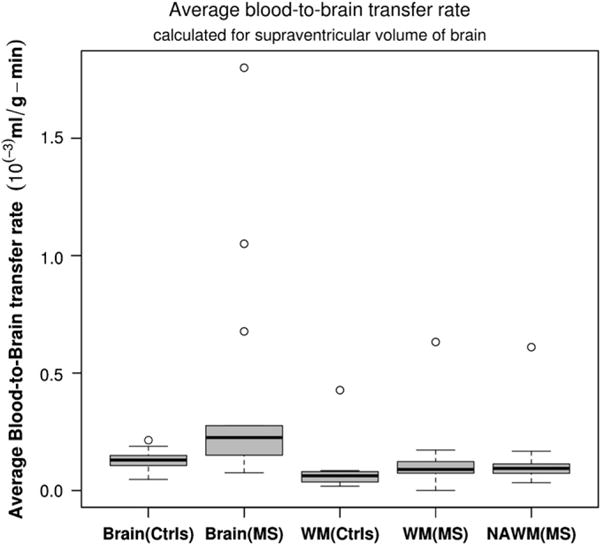
Comparison between averaged BBB transfer rate in WM and full-brain of controls and MS patients. There was statistically significant difference between blood-to-brain transfer rates in WM of MS and WM of control subjects (p-value < 0.05); however, there was no statistically significant difference between WM BBB transfer rate of MS patients compared to the controls (mean WM controls was 0.93 × 10⁻⁴ ml/g-min while mean WM of MS was 1.32 × 10⁻⁴ ml/g-min). There was no significant difference between NAWM and WM of MS and WM of controls.
3.3. Comparison between WMLV and WMALV
Estimated WMLV from FLAIR were compared with WMALV. Increases in lesion volumes calculated by FLAIR did correlate with increased lesion activity measured with Ki map (p-value < 0.001, and R2 = 0.37) (Fig. 4). As it is common in MS, WMALV were lower than WMLV calculated by FLAIR images. A higher volume of WMLV did not reflect a higher volume of lesion activity. However, for patients with higher volumes of active lesions, WMLV could be as high as WMALV.
Fig. 4.
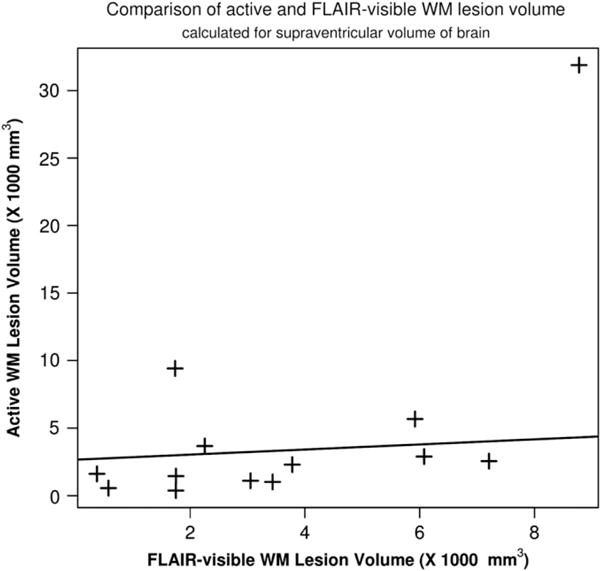
Relationship between FLAIR-visible lesion volume and active lesion volume calculated from BBB transfer rate maps. These two calculated abnormal volumes were compared for possible correlations. A linear function is fitted to the data, a weak correlation was found between these two lesion volumes (p-value < 0.001, R2 = 0.37).
3.4. Comparison between Gad-enhanced and BBB transfer rate maps
We found that, in seven patients, Ki map highlights a larger volume than Gad-enhanced T1w imaging by comparing Gad-enhanced volume of Gad-enhanced T1 images and abnormal volume of Ki map. We noted that a large portion of the enhancement area in Ki maps were subtle enhancements, which are harder to detect in contrast-enhanced T1w images. As an Illustration, three images acquired by three different MR modalities from a slice of brain of a patient with MS lesions are shown (Fig. 5). The improvement in the detection of BBB leakage can be seen by comparing the contrast-enhanced T1w images (Fig. 5A) with the T2 FLAIR image (Fig. 5B), and the map of Ki reconstructed from DCEMRI images acquired from the same anatomical level (Fig. 5C). In these images, an arrow is pointing to an area that was not enhanced by full-dose standard Gad-enhanced MRI, while hyper-intensity is demonstrated by FLAIR image in the same location. However, the Ki map corresponding to the same area shows an increased BBB transfer rate above the normal threshold.
Fig. 5.
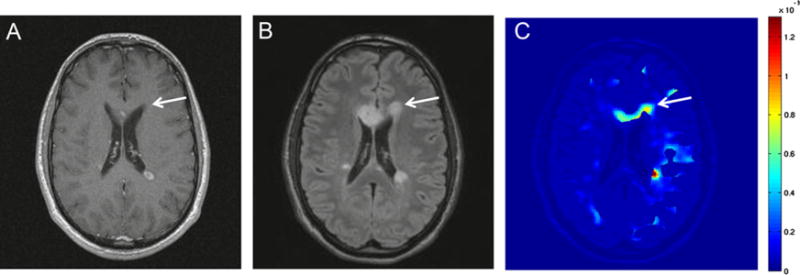
Comparison between the quantitative BBB transfer rate map acquired by DCEMRI and qualitative Gad-enhanced images for detection of WM abnormalities in MS. Image A is a Gad-enhanced T1 image acquired with a bolus injection of full dose of Gd-DTPA. Image B is a T2 FLAIR image, and image C is a parametric image, mapping the BBB transfer rate. In these images, arrows indicate the corresponding area of a FLAIR-visible lesion. The area is not highlighted in Gad-enhanced image. However, this area is color-coded as one with elevated BBB transfer rate. (For interpretation of the references to color in this figure legend, the reader is referred to the web version of this article.)
4. Discussion
In this study, we have combined an MR data acquisition protocol with a reduced dose of Gd-DTPA (Ewing et al., 2003; Fenstermacher et al., 2003; Nagaraja et al., 2010; Taheri et al., 2009, 2011b) to study the BBB transfer rates in MS patients using a 24-minute scan. With the application of this quantitative voxel-wise method in both controls and MS, a continuous distribution for Ki values was observed. In most cases, area with the higher Ki corresponded to areas with both T2 hyperintensity and Gad enhancement on standard post-gadolinium T1w images; however, our protocol identified a larger area than visualized with standard Gad-enhanced imaging. A statistically established confidence interval for normal Ki in WM (Ki < 3 × 10⁻⁴ ml/g-min) (Taheri et al., 2011a, 2011b) was used to investigate the state of Ki in WM lesions, in the NAWM, and in full-brain. We have observed different degrees of impairment in the BBB health in the NAWM and in WM lesion, however, the conclusion was drawn based on the significance of statistics of group data. The mean Ki for WM MS was 1.33 × 10⁻⁴ ml/g-min while the mean Ki of NAWM MS was 1.30 × 10⁻⁴ ml/g-min, however we did not find a significant difference between Ki of NAWM and Ki of WM MS. Variation in Ki may reflect transient states of the disease. To fully understand the dynamics and progression of BBB in MS lesions over time, further longitudinal studies on a larger data set are required.
Voxel-wise WM brain volume was assessed for BBB abnormality in full-brain. We have found that MS patients (under treatment with disease-modifying drugs and treatment-naïve) have an increased average Ki in the volume of interest when compared to controls. No significant differences between Ki in WM areas of MS and controls were observed when we masked WM from the rest of the brain tissue in the volume of interest. By removing FLAIR-identified lesion area form the brain we did not observe a significant change in the average Ki of brain (Fig. 4 Supplement). These findings lead us to conclude that a higher mean of Ki in full-brain may be related to the altered Ki in areas beyond the WM and lesions, such as in deep and cortical GM; alternatively, it may be related to changes in the cerebrospinal fluid (CSF) route of transfer from blood to brain. With these observations, we can not speculate that BBB and blood–CSF barrier are both involved in MS. More studies needed to specify which routes are more impaired or if the impairment of CSF generation because of age is involved. We have investigated the effect of age on the Ki alterations in this group of MS and controls by using a linear modeling technique. A statistically significant correlation was not found between the ages of subjects and the average of Ki in MS though it was significant in controls.
Recent observations suggest that GM is involved in an inflammatory demyelination process in early MS (Inglese et al., 2011; Khaleeli et al., 2008; Lucchinetti et al., 2011). However, no evidence was observed to confirm the change in tight junctions within the BBB in the GM of patients with MS (van Horssen et al., 2007). Also, the progression of GM atrophy is shown to be more prominent (Horakova et al., 2008) compared to WM atrophy in patients with MS (Bermel and Bakshi, 2006; Miller et al., 2002). These findings could be connected to the observed increased Ki in full-brain when WM is masked. MS disease-modifying drugs (The Multiple Sclerosis Collaborative Research Group (MSCRG), 1996; Kappos et al., 2010; Polman et al., 2006) affect the BBB transfer rate to a variable extent because of differences in the characteristics of inflammatory infiltrates among anatomical areas of brain. Cytokines such as TNF-α and transforming growth factor-beta (TGF-β) affect tight junction protein expression and transfer rates of both brain barriers: BBB and blood–CSF barrier (Killestein et al., 2001; Lundbye-Christensen et al., 2009; Zhou et al., 2010). However, the extent and effects of MS drugs on brain barriers in the full-brain and in cortical GM are not fully understood. In this study, because of technical difficulties such as large slice thickness and partial volume affects from CSF, our data do not directly elaborate on impairment of BBB in the cortical GM. More studies with MR techniques sensitive to cortical GM BBB are needed.
5. Conclusions
In conclusion, our results show two novel findings based on the quantitative measurement of BBB in MS patients: (1) the volume of Gad leakage is greater with a DCEMRI sensitive to slow leakage than conventional Gad-enhanced T1w imaging, and (2) MS patients appear to have a higher full-brain BBB transfer rate than normal controls. This increase of BBB transfer rate could be the result of the MS disease process, but a specific explanation is not apparent. Moreover, we have demonstrated a more detailed pattern of WM lesions relying on BBB data in the MS by using a DCEMRI method sensitive for the slow but abnormal transfer in MS. By considering the dynamic nature of BBB permeability in MS, more data with temporally close imaging sessions is needed to accurately measure the increased sensitivity of DCEMRI compared to regular Gad-enhanced imaging.
Quantification of BBB transfer rate could also benefit drug discovery by providing a more accurate assessment for measuring drug effects on the inflammatory process of MS.
Supplementary Material
Acknowledgments
The authors would like to thank Jillian Prestopnik and Lori Bachert for recruiting the patients and controls. The authors also wish to thank N.J. Shah and H. Neeb from the Institute fur Medizin, Forschungszentrum Juelich GmbH, Juelich, Germany, for providing the TAPIR sequence.
Appendix A. Supporting information
Supplementary data associated with this article can be found in the online version at http://dx.doi.org/10.1016/j.msard.2012.09.003.
Footnotes
Conflict of interest statement
There are no conflicts of interest that are relevant to this study.
References
- Bermel RA, Bakshi R. The measurement and clinical relevance of brain atrophy in multiple sclerosis. Lancet Neurology. 2006;5:158–70. doi: 10.1016/S1474-4422(06)70349-0. [DOI] [PubMed] [Google Scholar]
- Brochet B, Dousset V, Deloire M, Boiziau C, Petry KG. MRI to predict severe tissue damage in inflammatory lesions in animal models of multiple sclerosis. Brain: A Journal of Neurology. 2008;131:e92. doi: 10.1093/brain/awm261. [DOI] [PubMed] [Google Scholar]
- Candelario-Jalil E, Thompson J, Taheri S, Grossetete M, Adair JC, Edmonds E, et al. Matrix metalloproteinases are associated with increased blood–brain barrier opening in vascular cognitive impairment. Stroke: A Journal of Cerebral Circulation. 2011;42:1345–50. doi: 10.1161/STROKEAHA.110.600825. [DOI] [PMC free article] [PubMed] [Google Scholar]
- Coisne C, Engelhardt B. Tight junctions in brain barriers during central nervous system inflammation. Antioxidants & Redox Signaling. 2011;15:1285–303. doi: 10.1089/ars.2011.3929. [DOI] [PubMed] [Google Scholar]
- D’Haeseleer M, Cambron M, Vanopdenbosch L, De Keyser J. Vascular aspects of multiple sclerosis. Lancet Neurology. 2011;10:657–66. doi: 10.1016/S1474-4422(11)70105-3. [DOI] [PubMed] [Google Scholar]
- Dankbaar JW, Hom J, Schneider T, Cheng SC, Lau BC, van der Schaaf I, et al. Dynamic perfusion CT assessment of the blood–brain barrier permeability: first pass versus delayed acquisition. AJNR American journal of neuroradiology. 2008;29:1671–6. doi: 10.3174/ajnr.A1203. [DOI] [PMC free article] [PubMed] [Google Scholar]
- Dankbaar JW, Hom J, Schneider T, Cheng SC, Bredno J, Lau BC, et al. Dynamic perfusion-CT assessment of early changes in blood brain barrier permeability of acute ischaemic stroke patients. Journal de Neuroradiologie (Journal of Neuroradiology) 2011;38:161–6. doi: 10.1016/j.neurad.2010.08.001. [DOI] [PubMed] [Google Scholar]
- Essig M, Weber MA, von Tengg-Kobligk H, Knopp MV, Yuh WT, Giesel FL. Contrast-enhanced magnetic resonance imaging of central nervous system tumors: agents, mechanisms, and applications. Topics in Magnetic Resonance Imaging. 2006;17:89–106. doi: 10.1097/01.rmr.0000245464.36148.dc. [DOI] [PubMed] [Google Scholar]
- Everitt BS, Hothorn T. A handbook of statistical analysis using R. Second. CRC Press; 2009. [Google Scholar]
- Ewing JR, Knight RA, Nagaraja TN, Yee JS, Nagesh V, Whitton PA, et al. Patlak plots of Gd-DTPA MRI data yield blood–brain transfer constants concordant with those of 14C-sucrose in areas of blood–brain opening. Magnetic Resonance in Medicine: Official Journal of the Society of Magnetic Resonance in Medicine/Society of Magnetic Resonance in Medicine. 2003;50:283–92. doi: 10.1002/mrm.10524. [DOI] [PubMed] [Google Scholar]
- Fenstermacher JD, Knight RA, Ewing JR, Nagaraja T, Nagesh V, Yee JS, et al. Estimating blood–brain barrier opening in a rat model of hemorrhagic transformation with Patlak plots of Gd-DTPA contrast-enhanced MRI. Acta Neurochirurgica. 2003;S86:37–9. doi: 10.1007/978-3-7091-0651-8_7. [DOI] [PubMed] [Google Scholar]
- Filippi M, Grossman RI. MRI techniques to monitor MS evolution: the present and the future. Neurology. 2002;58:1147–53. doi: 10.1212/wnl.58.8.1147. [DOI] [PubMed] [Google Scholar]
- Filippi M, Rocca MA, Barkhof F, Bakshi R, Fazekas F, Khan O, et al. Multiple sclerosis and chronic cerebrospinal venous insufficiency: the neuroimaging perspective. AJNR American journal of neuroradiology. 2011;32:424–7. doi: 10.3174/ajnr.A2348. [DOI] [PMC free article] [PubMed] [Google Scholar]
- Fisher E, Lee JC, Nakamura K, Rudick RA. Gray matter atrophy in multiple sclerosis: a longitudinal study. Annals of Neurology. 2008;64:255–65. doi: 10.1002/ana.21436. [DOI] [PubMed] [Google Scholar]
- Hom J, Dankbaar JW, Schneider T, Cheng SC, Bredno J, Wintermark M. Optimal duration of acquisition for dynamic perfusion CT assessment of blood–brain barrier permeability using the Patlak model. AJNR American Journal of neuroradiology. 2009;30:1366–70. doi: 10.3174/ajnr.A1592. [DOI] [PMC free article] [PubMed] [Google Scholar]
- Horakova D, Cox JL, Havrdova E, Hussein S, Dolezal O, Cookfair D, et al. Evolution of different MRI measures in patients with active relapsing–remitting multiple sclerosis over 2 and 5 years: a case-control study. Journal of Neurology, Neurosurgery, and Psychiatry. 2008;79:407–14. doi: 10.1136/jnnp.2007.120378. [DOI] [PubMed] [Google Scholar]
- Huisa BN, Gasparovic C, Taheri S, Prestopnik JL, Rosenberg GA. Imaging of subacute blood–brain barrier disruption after methadone overdose. Journal of Neuroimaging: Official Journal of the American Society of Neuroimaging. 2011 doi: 10.1111/j.1552-6569.2011.00669.x. Epub ahead of print. [DOI] [PMC free article] [PubMed] [Google Scholar]
- Inglese M, Oesingmann N, Casaccia P, Fleysher L. Progressive multiple sclerosis and gray matter pathology: an MRI perspective. The Mount Sinai Journal of Medicine, New York. 2011;78:258–67. doi: 10.1002/msj.20247. [DOI] [PMC free article] [PubMed] [Google Scholar]
- Kappos L, Radue EW, O’Connor P, Polman C, Hohlfeld R, Calabresi P, et al. A placebo-controlled trial of oral fingolimod in relapsing multiple sclerosis. The New England Journal of Medicine. 2010;362:387–401. doi: 10.1056/NEJMoa0909494. [DOI] [PubMed] [Google Scholar]
- Khaleeli Z, Altmann DR, Cercignani M, Ciccarelli O, Miller DH, Thompson AJ. Magnetization transfer ratio in gray matter: a potential surrogate marker for progression in early primary progressive multiple sclerosis. Archives of Neurology. 2008;65:1454–9. doi: 10.1001/archneur.65.11.1454. [DOI] [PubMed] [Google Scholar]
- Killestein J, Kalkers NF, Meilof JF, Barkhof F, van Lier RA, Polman CH. TNFalpha production by CD4(+) T cells predicts long-term increase in lesion load on MRI in MS. Neurology. 2001;57:1129–31. doi: 10.1212/wnl.57.6.1129. [DOI] [PubMed] [Google Scholar]
- Larsson HB, Stubgaard M, Frederiksen JL, Jensen M, Henriksen O, Paulson OB. Quantitation of blood–brain barrier defect by magnetic resonance imaging and gadolinium-DTPA in patients with multiple sclerosis and brain tumors. Magnetic Resonance in Medicine: Official Journal of the Society of Magnetic Resonance in Medicine/Society of Magnetic Resonance in Medicine. 1990;16:117–31. doi: 10.1002/mrm.1910160111. [DOI] [PubMed] [Google Scholar]
- Lassmann H. The architecture of inflammatory demyelinating lesions: implications for studies on pathogenesis. Neuropathology and Applied Neurobiology. 2011a;37:698–710. doi: 10.1111/j.1365-2990.2011.01189.x. [DOI] [PubMed] [Google Scholar]
- Lassmann H. Pathophysiology of inflammation and tissue injury in multiple sclerosis: what are the targets for therapy. Journal of the Neurological Sciences. 2011b;306:167–9. doi: 10.1016/j.jns.2010.07.023. [DOI] [PubMed] [Google Scholar]
- Lassmann H. A dynamic view of the blood–brain barrier in active multiple sclerosis lesions. Annals of Neurology. 2011c;70:1–2. doi: 10.1002/ana.22494. [DOI] [PubMed] [Google Scholar]
- Lucchinetti CF, Popescu BF, Bunyan RF, Moll NM, Roemer SF, Lassmann H, et al. Inflammatory cortical demyelination in early multiple sclerosis. The New England Journal of Medicine. 2011;365:2188–97. doi: 10.1056/NEJMoa1100648. [DOI] [PMC free article] [PubMed] [Google Scholar]
- Lundbye-Christensen S, Dethlefsen C, Gorst-Rasmussen A, Fischer T, Schonheyder HC, Rothman KJ, et al. Examining secular trends and seasonality in count data using dynamic generalized linear modelling: a new methodological approach illustrated with hospital discharge data on myocardial infarction. European Journal of Epidemiology. 2009;24:225–30. doi: 10.1007/s10654-009-9325-z. [DOI] [PubMed] [Google Scholar]
- Miller DH, Barkhof F, Frank JA, Parker GJ, Thompson AJ. Measurement of atrophy in multiple sclerosis: pathological basis, methodological aspects and clinical relevance. Brain: A Journal of Neurology. 2002;125:1676–95. doi: 10.1093/brain/awf177. [DOI] [PubMed] [Google Scholar]
- Miller DH, Soon D, Fernando KT, MacManus DG, Barker GJ, Yousry TA, et al. MRI outcomes in a placebo-controlled trial of natalizumab in relapsing MS. Neurology. 2007;68:1390–401. doi: 10.1212/01.wnl.0000260064.77700.fd. [DOI] [PubMed] [Google Scholar]
- Nagaraja TN, Karki K, Ewing JR, Divine GW, Fenstermacher JD, Patlak CS, et al. The MRI-measured arterial input function resulting from a bolus injection of Gd-DTPA in a rat model of stroke slightly underestimates that of Gd-[14C]DTPA and marginally overestimates the blood-to-brain influx rate constant determined by Patlak plots. Magnetic Resonance in Medicine: Official Journal of the Society of Magnetic Resonance in Medicine/Society of Magnetic Resonance in Medicine. 2010;63:1502–9. doi: 10.1002/mrm.22339. [DOI] [PMC free article] [PubMed] [Google Scholar]
- Nessler S, Boretius S, Stadelmann C, Bittner A, Merkler D, Hartung HP, et al. Early MRI changes in a mouse model of multiple sclerosis are predictive of severe inflammatory tissue damage. Brain: A Journal of Neurology. 2007;130:2186–98. doi: 10.1093/brain/awm105. [DOI] [PubMed] [Google Scholar]
- Nico B, Ribatti D. Morphofunctional aspects of the blood–brain barrier. Current Drug Metabolism. 2012;13:50–60. doi: 10.2174/138920012798356970. [DOI] [PubMed] [Google Scholar]
- Patlak CS, Blasberg RG. Graphical evaluation of blood-to-brain transfer constants from multiple-time uptake data. Generalizations. Journal of Cerebral Blood Flow and Metabolism: Official Journal of the International Society of Cerebral Blood Flow and Metabolism. 1985;5:584–90. doi: 10.1038/jcbfm.1985.87. [DOI] [PubMed] [Google Scholar]
- Polman CH, O’Connor PW, Havrdova E, Hutchinson M, Kappos L, Miller DH, et al. A randomized, placebo-controlled trial of natalizumab for relapsing multiple sclerosis. The New England Journal of Medicine. 2006;354:899–910. doi: 10.1056/NEJMoa044397. [DOI] [PubMed] [Google Scholar]
- R Development Core Team. R: A language and environment for statistical computing. R Foundation for Statistical Computing; Vienna, Austria: 2008. [Google Scholar]
- Roberts HC, Roberts TP, Brasch RC, Dillon WP. Quantitative measurement of microvascular permeability in human brain tumors achieved using dynamic contrast-enhanced MR imaging: correlation with histologic grade. AJNR American Journal of Neuroradiology. 2000;21:891–9. [PMC free article] [PubMed] [Google Scholar]
- Schneider T, Hom J, Bredno J, Dankbaar JW, Cheng SC, Wintermark M. Delay correction for the assessment of blood–brain barrier permeability using first-pass dynamic perfusion CT. AJNR American Journal of Neuroradiology. 2010;32:134–8. doi: 10.3174/ajnr.A2152. [DOI] [PMC free article] [PubMed] [Google Scholar]
- Shah NJ, Zaitsev M, Steinhoff S, Zilles K. A new method for fast multislice T(1) mapping. NeuroImage. 2001;14:1175–85. doi: 10.1006/nimg.2001.0886. [DOI] [PubMed] [Google Scholar]
- Shah NJ, Neeb H, Zaitsev M, Steinhoff S, Kircheis G, Amunts K, et al. Quantitative T1 mapping of hepatic encephalopathy using magnetic resonance imaging. Hepatology (Baltimore, Md) 2003;38:1219–26. doi: 10.1053/jhep.2003.50477. [DOI] [PubMed] [Google Scholar]
- Silver N, Lai M, Symms M, Barker G, McDonald I, Miller D. Serial gadolinium-enhanced and magnetization transfer imaging to investigate the relationship between the duration of blood–brain barrier disruption and extent of demyelination in new multiple sclerosis lesions. Journal of Neurology. 1999;246:728–30. doi: 10.1007/s004150050442. [DOI] [PubMed] [Google Scholar]
- Silver NC, Tofts PS, Symms MR, Barker GJ, Thompson AJ, Miller DH. Quantitative contrast-enhanced magnetic resonance imaging to evaluate blood–brain barrier integrity in multiple sclerosis: a preliminary study. Multiple Sclerosis. 2001;7:75–82. doi: 10.1177/135245850100700201. [DOI] [PubMed] [Google Scholar]
- Sood R, Taheri S, Estrada EY, Rosenberg GA. Quantitative evaluation of the effect of propylene glycol on BBB permeability. Journal of Magnetic Resonance Imaging: JMRI. 2007;25:39–47. doi: 10.1002/jmri.20802. [DOI] [PubMed] [Google Scholar]
- Soon D, Altmann DR, Fernando KT, Giovannoni G, Barkhof F, Polman CH, et al. A study of subtle blood brain barrier disruption in a placebo-controlled trial of natalizumab in relapsing remitting multiple sclerosis. Journal of neurology. 2007a;254:306–14. doi: 10.1007/s00415-006-0356-z. [DOI] [PubMed] [Google Scholar]
- Soon D, Tozer DJ, Altmann DR, Tofts PS, Miller DH. Quantification of subtle blood–brain barrier disruption in non-enhancing lesions in multiple sclerosis: a study of disease and lesion subtypes. Multiple Sclerosis. 2007b;13:884–94. doi: 10.1177/1352458507076970. [DOI] [PubMed] [Google Scholar]
- Steinhoff S, Zaitsev M, Zilles K, Shah NJ. Fast T(1) mapping with volume coverage. Magnetic Resonance in Medicine: Official Journal of the Society of Magnetic Resonance in Medicine/Society of Magnetic Resonance in Medicine. 2001;46:131–40. doi: 10.1002/mrm.1168. [DOI] [PubMed] [Google Scholar]
- Taheri S, Sood R. Kalman filtering for reliable estimation of BBB permeability. Magnetic Resonance Imaging. 2006;24:1039–49. doi: 10.1016/j.mri.2006.07.002. [DOI] [PubMed] [Google Scholar]
- Taheri S, Candelario-Jalil E, Estrada EY, Rosenberg GA. Spatiotem-poral correlations between blood–brain barrier permeability and apparent diffusion coefficient in a rat model of ischemic stroke. PLoS One. 2009;4:e6597. doi: 10.1371/journal.pone.0006597. [DOI] [PMC free article] [PubMed] [Google Scholar]
- Taheri S, Gasparovic C, Shah NJ, Rosenberg GA. Quantitative measurement of blood–brain barrier permeability in human using dynamic contrast-enhanced MRI with fast T1 mapping. Magnetic Resonance in Medicine: Official Journal of the Society of Magnetic Resonance in Medicine/Society of Magnetic Resonance in Medicine. 2011b;65:1036–42. doi: 10.1002/mrm.22686. [DOI] [PMC free article] [PubMed] [Google Scholar]
- Taheri S, Gasparovic C, Huisa BN, Adair JC, Edmonds E, Prestopnik J, et al. Blood–brain barrier permeability abnormalities in vascular cognitive impairment. Stroke: A Journal of Cerebral Circulation. 2011;42:2158–63. doi: 10.1161/STROKEAHA.110.611731. [DOI] [PMC free article] [PubMed] [Google Scholar]
- The Multiple Sclerosis Collaborative Research Group (MSCRG) Intramuscular interferon beta-1a for disease progression in relapsing multiple sclerosis. Annals of Neurology. 1996;39:285–94. doi: 10.1002/ana.410390304. [DOI] [PubMed] [Google Scholar]
- van Horssen J, Brink BP, de Vries HE, van der Valk P, Bo L. The blood–brain barrier in cortical multiple sclerosis lesions. Journal of Neuropathology and Experimental Neurology. 2007;66:321–8. doi: 10.1097/nen.0b013e318040b2de. [DOI] [PubMed] [Google Scholar]
- Zaitsev M, Steinhoff S, Shah NJ. Error reduction and parameter optimization of the TAPIR method for fast T1 mapping. Magnetic Resonance in Medicine: Official Journal of the Society of Magnetic Resonance in Medicine/Society of Magnetic Resonance in Medicine. 2003;49:1121–32. doi: 10.1002/mrm.10478. [DOI] [PubMed] [Google Scholar]
- Zhou Q, Fan J, Ding X, Peng W, Yu X, Chen Y, et al. TGF-{beta}-induced MiR-491-5p expression promotes Par-3 degradation in rat proximal tubular epithelial cells. The Journal of Biological Chemistry. 2010;285:40019–27. doi: 10.1074/jbc.M110.141341. [DOI] [PMC free article] [PubMed] [Google Scholar]
Associated Data
This section collects any data citations, data availability statements, or supplementary materials included in this article.