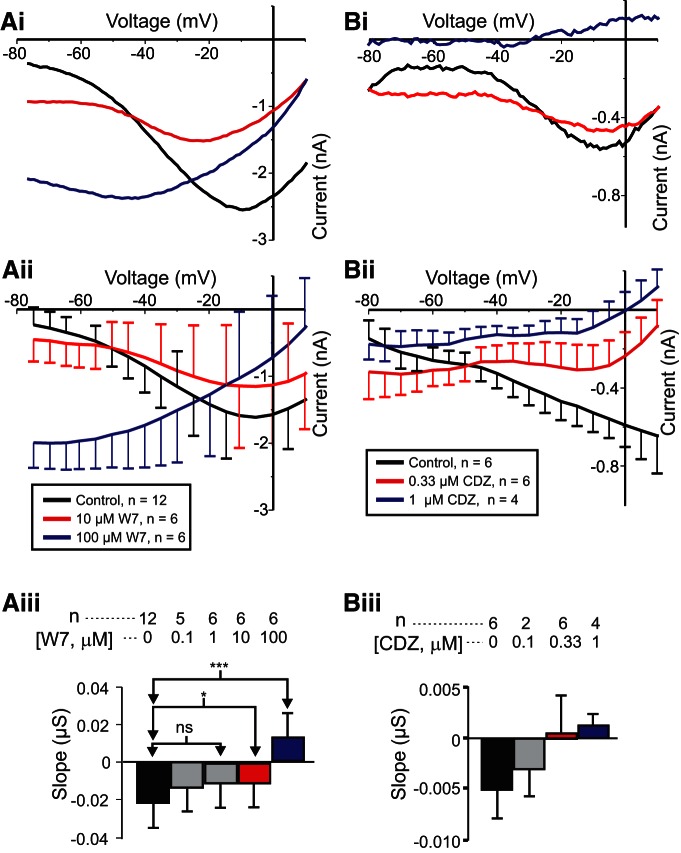
Figure 2.
The effect of calmodulin inhibitors on IMI voltage dependence. Left, Proctolin-induced IMI at different concentrations of W7. Ai, Representative I–V curves of a W7 experiment. Aii, Averaged I–V curves across W7 experiments. Aiii, Quantification of W7 data. A one-way repeated-measures ANOVA showed that W7 changed the proctolin-induced IMI slope (F(4,19) = 15.972, p = 6.96 × 10⁻⁶j). Error bars indicate the SEM. Tukey’s test; *p < 0.05; ***p < 0.001. Right, Proctolin-induced IMI in different concentrations of calmidazolium (CDZ). Bi, Representative I–V curves. Bii, Average I–V curves from all calmidazolium experiments. Biii, Quantification of all calmidazolium data. A one-way repeated-measures ANOVA showed that calmidazolium significantly altered IMI slope (F(3,9) = 4.846, p = 0.028n). However, no significant post hoc pairwise differences were observed. Tukey’s post hoc test, p < 0.05. Error bars indicate the SEM. Data are from LP neurons.

