

Abstract
The coloration of flowers is due to the wavelength-selective absorption by pigments of light backscattered by structures inside the petals. We investigated the optical properties of flowers using (micro)spectrophotometry and anatomical methods. To assess the contribution of different structures to the overall visual signal of flowers, we used an optical model, where a petal is considered as a stack of differently pigmented and structured layers and we interpreted the visual signals of the model petals with insect vision models. We show that the reflectance depends, in addition to the pigmentation, on the petal's thickness and the inhomogeneity of its interior. We find large between-species differences in floral pigments, pigment concentration and localization, as well as floral interior structure. The fractions of reflected and transmitted light are remarkably similar between the studied species, suggesting common selective pressures of pollinator visual systems. Our optical model highlights that pigment localization crucially determines the efficiency of pigmentary filtering and thereby the chromatic contrast and saturation of the visual signal. The strongest visual signal occurs with deposition of pigments only on the side of viewing. Our systematic approach and optical modelling open new perspectives on the virtues of flower colour.
Keywords: absorbance, anatomy, pollination, pigment, reflectance, vision model
1. Introduction
Plants attract pollinators by displaying distinctly coloured flowers [1–4]. The role of flower colours in pollination has been studied in many experiments, providing valuable insight into the complex nature of plant–pollinator interactions [3,5]. Accordingly, for numerous flowers the coloration, characterized by their reflectance spectrum, has been reported (e.g. [6–10]), but the optics, i.e. the complex interaction of light with the inner components of flowers, has so far received much less attention. A quantitative understanding of flower coloration is, nonetheless, important in order to comprehend the ecology and evolution of visual signalling of flowers, as it aids in our understanding of the proximate aspects underlying floral visual signals.
Flower coloration is due to the combined effect of wavelength-selective absorption by pigments and light scattering by the petal interior [11–14]. The reflected light in the wavelength ranges complementary to the pigment's absorption band determines the flower's hue and saturation. Backscattering of light occurs at the irregularly structured inner petal components (e.g. the vacuoles and air spaces; figure 1). Flower coloration is thus the combined effect of the pigment absorption spectrum, scattering structures, and flower thickness, yet the relative contribution of these different aspects to the overall visual signal of flowers is poorly understood.
Figure 1.
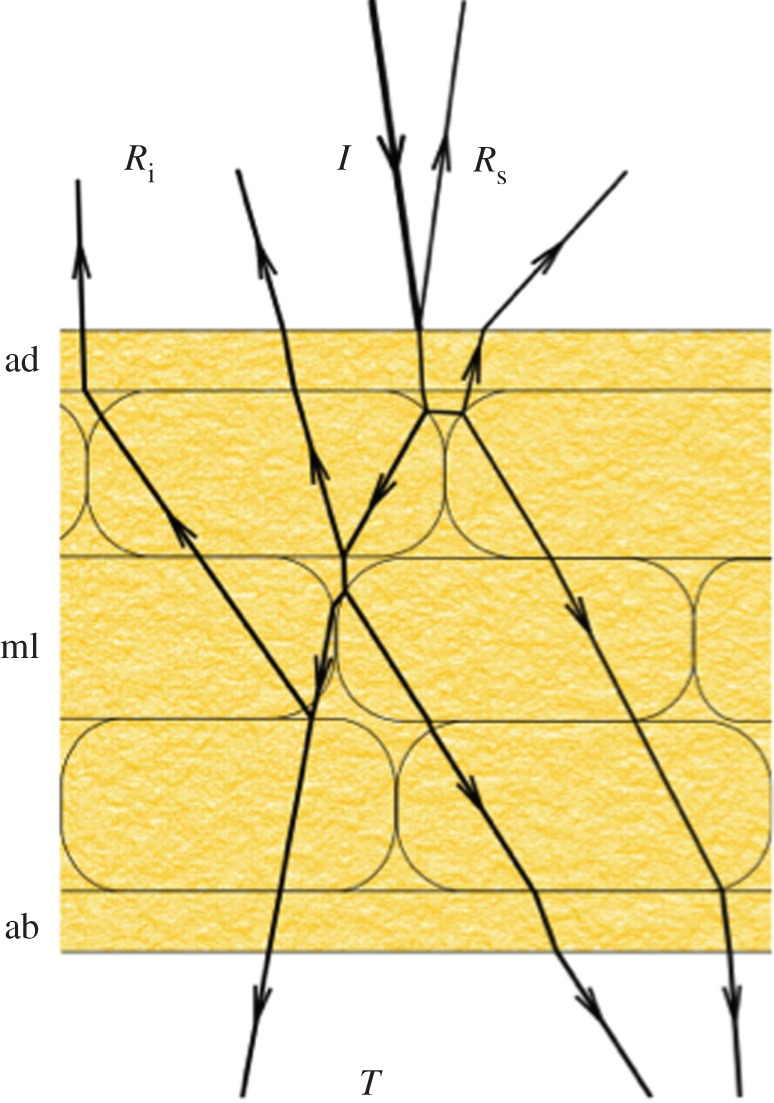
Simplified diagram of the propagation of incident light (I) in a petal. A small part of the incident light is reflected by the surface (Rs) of the adaxial side of the petal (ad), but reflections and refractions inside the petal at the boundaries of irregularly arranged components of the mesophyll layer (ml) result in diffusely scattered light from the interior (Ri). The light that is not reflected or absorbed is transmitted (T) through the abaxial side (ab) of the petal.
In this study, we illustrate and quantify different aspects of flower coloration with the aim of determining the common optical principles of flower coloration. We first provide an overview of the general optical characteristics of flowers, i.e. the fractions of reflected, transmitted, and absorbed light, flower absorbance spectra and types of pigment localization. To understand the functional consequences of different pigment localizations and amounts of scattering, we applied our recently developed optical model that treats a petal as a stack of layers, with each layer having specific absorption and scattering characteristics [14]. The optical properties of each individual layer (e.g. the epidermal and mesophyll layers; figure 1) are calculated using the Kubelka–Munk theory for absorbing and scattering media [15]. The Kubelka–Munk model has proved to be useful in modelling plant leaf optics as well as artificial materials such as dyes and paints [15,16]. Although the Beer–Lambert law yields the transmittance of a homogeneous, pigmented medium with negligible scattering, the Kubelka–Munk theory [15] incorporates scattering and accordingly yields the medium's transmittance as well as reflectance. Using a calculation procedure for a stack of layers [16–18] and parameters based on real flowers, we show that the overall reflectance of a petal can be calculated with the Kubelka–Munk-layer-stack model; with increasing thickness and inhomogeneity (due to cell walls, air holes, or amyloplasts) a petal's transmittance decreases while the reflectance increases. The differences in reflectance spectra due to changes in pigment localizations and optical properties are interpreted with models for bee vision.
2. Material and methods
(a). Plant material, photography, and spectrophotometry
Flower samples of randomly chosen species were obtained from meadows and roadsides around Groningen and the Botanical Garden in Haren, The Netherlands, or were grown from seeds (obtained from the Botanical Garden of Nijmegen, The Netherlands and De Bolster, Epe, The Netherlands). Flowers were photographed with a Nikon D70 digital camera equipped with an F Micro-Nikkor (60 mm, f2.8) macro objective (Nikon, Tokyo, Japan). Petal details were photographed with an Olympus SZX16 stereomicroscope equipped with an Olympus DP70 digital camera (Olympus, Tokyo, Japan) or a Zeiss Universal Microscope (Zeiss, Oberkochen, Germany) with a Mueller DCM510 camera (Mueller Optronic, Erfurt, Germany).
We measured the reflectance and transmittance of the floral elements with an integrating sphere (for equipment details, see [14]). The dominant coloured flower areas were mounted with the display side (generally the adaxial surface) facing the detector. For reflectance measurements, the floral element was close to perpendicular, directionally illuminated from within the sphere. For transmittance measurements, the petal was perpendicularly illuminated from outside the sphere via an optical fibre. Several measurements were taken from floral elements of two to five plants; for flowers of the same species, the shape of the spectra was virtually constant and the amplitude varied only a few per cent. The combined averaged reflectance (R) and transmittance (T) of the flowers yielded the absorptance A = 1 − (R + T). Absorbance spectra of floral elements immersed in water were measured with a microspectrophotometer (MSP), as in [14].
(b). Floral anatomy
Thickness values were measured for floral elements from at least two plants using a caliper. We placed a piece (one petal/ligule for small flowers or a 1 cm2 piece for large flowers) of the element in between two cover glasses and measured the thickness at five points. For a subset of species, the thickness measurements obtained with the caliper were verified using the Zeiss microscope yielding similar results (see the electronic supplementary material). The pigment distribution within the floral elements was examined via cross sections of flower pieces. We embedded small pieces of the flower in a 6% solution of agarose (Duchefa, Haarlem, The Netherlands) at a temperature near the point of solidification (approx. 55°C). The sections were cut using a sharp razor blade and immediately examined with the Zeiss microscope using the Olympus 20× (NA 0.45) objective.
(c). Modelling petal reflectance and transmittance
We modelled the reflectance and transmittance of the petals by considering a petal as a stack of absorbing and scattering layers [14]. In this optical model, we combined the Kubelka–Munk theory [15] with a calculation procedure for a stack of absorbing and reflecting layers [16–18]. The model allows calculating the effect of scattering of the individual petal layers and the petal as a whole on the transmittance and reflectance. Although the Kubelka–Munk theory was developed for diffuse light, and the illumination applied in the integrating sphere was directional, we assume that the incident light becomes readily diffuse, owing to the highly irregular flower surfaces and interiors found in virtually all species [11–14,19,20].
In our optical model, the scattering parameter of a layer, S*, plays a central role. This is the scattering coefficient, S (i.e. the scattering per unit thickness), times the layer thickness, d: S* = Sd. In the case that absorption is negligible, we assumed for all petal layers a wavelength-independent scattering coefficient that was uniform for the different layers of the flower. It should be noted, however, that the scattering coefficient is expected to be higher for pigmented layers than for unpigmented layers, because pigment granules (and possibly other high refractive index materials) increase the inhomogeneity [14]. Provided the pigment concentration is the same for different models, the scattering parameter of a stack of pigmented and unpigmented layers can nonetheless be calculated using the weighted average of the different layers. Hence, the scattering parameters considered in the models are similar as those found in real flowers (see below).
(d). Vision models
The reflectance spectra of differently pigmented model flowers were interpreted with a bee-subjective view applying the receptor noise-limited (RNL) [21,22] and colour hexagon (CH) [23] model, which have been applied in many previous studies (e.g. [7–9,24,25]). We used measured bee photoreceptor sensitivity spectra [26] and the daylight spectrum D65. (See the electronic supplementary material for more details about the insect vision models.)
3. Results
(a). Reflectance, transmittance, and absorptance of flowers
We investigated the flowers of 39 plant species from 23 angiosperm families (table 1; electronic supplementary material, figure S1). Figure 2 presents the spectra of four different-coloured exemplary flowers. Flowers that appear white to the human eye always had a low UV reflectance (figure 1a; electronic supplementary material, figure S2; see also [10,27]). The blue, yellow, and red flowers yielded a high reflectance in the short-, medium-, and long-wavelength ranges, respectively, and occasionally featured an additional high ultraviolet (UV) reflectance (figure 1; electronic supplementary material, figure S1). For both the long- and short-wavelength ranges, the transmittance was often higher than the reflectance (figure 2; electronic supplementary material, figure S1; table 1). The colour contrast calculated with the reflectance and transmittance spectra greatly varied between species, likely due to differences in absorption by pigments (table 1). Interestingly, the absorptance spectrum of many yellow flowers had a minor, yet consistent peak at approximately 660 nm, presumably due to the presence of α-chlorophyll (figure 1c; electronic supplementary material, figure S1).
Table 1.
Parameters of floral elements from different species and families. R, reflectance value at 800 nm; d: thickness; s.d., standard deviation; S*, scattering parameter; S, scattering coefficient; just noticeable differences (JND) R and JND T, perceptual distance in JND of the reflectance and transmittance spectra against a green background, calculated using the RNL model.
| family | species name | R | s.d. R | d (µm) | s.d. d (µm) | S* | S (mm−1) | JND R | JND T |
|---|---|---|---|---|---|---|---|---|---|
| Apiaceae | Astrantia major | 0.36 | 0.01 | 246 | 21 | 0.56 | 2.28 | 4.7 | 11.1 |
| Apocynaceae | Vinca minor | 0.48 | 0.01 | 222 | 44 | 0.92 | 4.16 | 13.2 | 10.1 |
| Asteraceae | Cichorium intybus | 0.37 | 0.01 | 146 | 53 | 0.59 | 4.04 | 6.3 | 8.9 |
| Balsaminaceae | Impatiens glandulifera | 0.39 | 0.05 | 127 | 16 | 0.64 | 5.03 | 9.8 | 6.7 |
| Balsaminaceae | Impatiens parviflora | 0.36 | 0.02 | 164 | 17 | 0.56 | 3.43 | 7.5 | 4.1 |
| Boraginaceae | Borago officinalis | 0.32 | 0.01 | 162 | 23 | 0.47 | 2.91 | 8.2 | 6.6 |
| Boraginaceae | Echium vulgare | 0.20 | 0.02 | 209 | 58 | 0.25 | 1.19 | 6.4 | 5.4 |
| Brassicaceae | Eruca sativa | 0.43 | 0.05 | 119 | 23 | 0.75 | 6.30 | 6.6 | 4.7 |
| Caryophyllaceae | Silene dioica | 0.42 | 0.03 | 102 | 17 | 0.72 | 7.08 | 6.4 | 8.6 |
| Caryophyllaceae | Silene latifolia ssp. alba | 0.47 | 0.02 | 200 | 38 | 0.89 | 4.44 | 12.8 | 9.1 |
| Cleomaceae | Cleome spinosa | 0.43 | 0.01 | 184 | 17 | 0.75 | 4.11 | 20.4 | 9.6 |
| Colchicaceae | Colchicum autumnale | 0.46 | 0.00 | 327 | 58 | 0.85 | 2.61 | 11.1 | 11.3 |
| Convolvulaceae | Convolvulus sepium | 0.33 | 0.01 | 128 | 17 | 0.49 | 3.85 | 4.7 | 11.1 |
| Fabaceae | Lathyrus pratensis | 0.24 | 0.01 | 162 | 38 | 0.32 | 1.95 | 6.6 | 10.0 |
| Fabaceae | Phaseolus coccineus | 0.41 | 0.02 | 379 | 17 | 0.69 | 1.83 | 11.1 | 8.9 |
| Geraniaceae | Geranium robertianum | 0.47 | 0.01 | 100 | 26 | 0.89 | 8.84 | 11.9 | 8.0 |
| Hypericaceae | Hypericum calycinum | 0.46 | 0.05 | 254 | 75 | 0.85 | 3.36 | 10.7 | 10.0 |
| Hypericaceae | Hypericum perforatum | 0.44 | 0.00 | 180 | 34 | 0.79 | 4.37 | 15.6 | 10.4 |
| Lamiaceae | Salvia guarantica | 0.26 | 0.00 | 109 | 22 | 0.35 | 3.23 | 8.4 | 10.3 |
| Malvaceae | Hibiscus trionum | 0.35 | 0.01 | 186 | 22 | 0.54 | 2.90 | 8.4 | 14.0 |
| Malvaceae | Malva moschata | 0.31 | 0.01 | 146 | 30 | 0.45 | 3.08 | 5.6 | 5.2 |
| Malvaceae | Malva sylvestris | 0.28 | 0.03 | 139 | 36 | 0.39 | 2.79 | 7.8 | 6.5 |
| Nymphaceae | Nuphar lutea | 0.45 | 0.03 | 419 | 71 | 0.82 | 1.95 | 10.5 | 15.0 |
| Onagraceae | Epilobium hirsutum | 0.30 | 0.02 | 96 | 17 | 0.43 | 4.48 | 9.3 | 7.4 |
| Onagraceae | Oenothera biennis | 0.45 | 0.03 | 220 | 75 | 0.82 | 3.73 | 9.3 | 8.8 |
| Onagraceae | Oenothera glazioviana | 0.46 | 0.02 | 190 | 85 | 0.85 | 4.48 | 8.9 | 7.6 |
| Onagraceae | Oenothera lindheimeri | 0.43 | 0.01 | 154 | 46 | 0.75 | 4.89 | 7.5 | 11.1 |
| Papaveraceae | Chelidonium majus | 0.37 | 0.02 | 98 | 29 | 0.59 | 6.02 | 14.6 | 10.7 |
| Papaveraceae | Papaver rhoeas | 0.31 | 0.01 | 75 | 12 | 0.45 | 5.99 | 10.3 | 15.1 |
| Plantaginaceae | Linaria vulgaris | 0.32 | 0.01 | 97 | 48 | 0.47 | 4.85 | 7.4 | 9.6 |
| Ranunculaceae | Caltha palustris | 0.49 | 0.01 | 304 | 65 | 0.96 | 3.16 | 17.6 | 13.8 |
| Rosaceae | Geum urbanum | 0.44 | 0.03 | 104 | 9 | 0.79 | 7.54 | 16.5 | 12.2 |
| Solanaceae | Browallia americana | 0.42 | 0.02 | 172 | 24 | 0.72 | 4.21 | 14.8 | 11.0 |
| Solanaceae | Nicotiana tabacum | 0.40 | 0.01 | 210 | 23 | 0.67 | 3.18 | 3.2 | 9.8 |
| Solanaceae | Nolana paradoxa | 0.40 | 0.01 | 139 | 58 | 0.67 | 4.80 | 8.3 | 7.2 |
| Solanaceae | Petunia nyctaginiflora | 0.38 | 0.04 | 200 | 48 | 0.61 | 3.07 | 12.3 | 11.6 |
| Solanaceae | Physalis philadelphica | 0.25 | 0.01 | 132 | 27 | 0.33 | 2.52 | 8.6 | 6.4 |
| Solanaceae | Solanum trisectum | 0.25 | 0.05 | 326 | 90 | 0.33 | 1.02 | 6.6 | 5.4 |
| Tropaeolaceae | Tropaelum majus | 0.46 | 0.02 | 228 | 26 | 0.85 | 3.73 | 23.2 | 9.5 |
Figure 2.

Spectral characteristics of four differently coloured flowers. (a) Hibiscus trionum, (b) Borago officinalis, (c) Oenothera biennis, and (d) Papaver rhoeas. The transmittance (T, red curves) and reflectance (R, green curves) spectra of single petals were measured with an integrating sphere, and the absorptance (blue curves) was calculated from A = 1 – (R + T).
(b). Scattering in flower petals
Despite the great differences in peak absorption of the pigments, we found that pigment absorption was always negligible in the long-wavelength range (i.e. above 800 nm; figures 2 and 3; electronic supplementary material, figure S1). The reflectance in the long-wavelength range thus is solely determined by the flowers' scattering structures. The lowest reflectance value was obtained for the flowers of Echium vulgare (20%) and the highest reflectance value was for the flowers of Caltha palustris (49%) (electronic supplementary material, figure S1; table 1).
Figure 3.
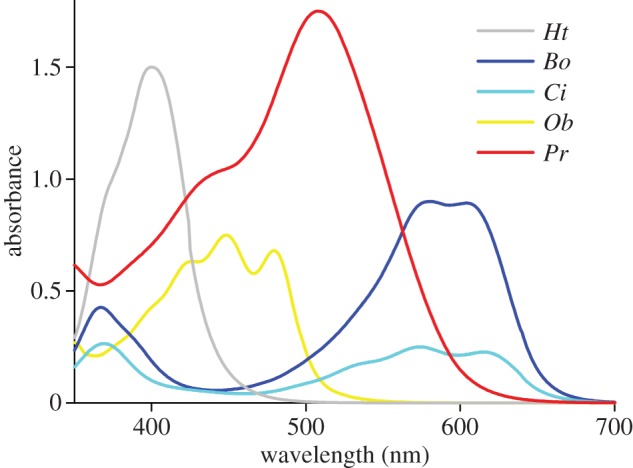
Absorbance spectra of petals in water measured with a MSP. Ht, Hibiscus trionum; Bo, Borago officinalis; Ci, Cichorium intybus; Ob, Oenothera biennis; Pr, Papaver rhoeas.
In order to quantitatively assess the scattering of flowers, we heuristically considered the petals as a single, homogeneously diffusing plate and we neglected the surface reflections, as these are generally very small, i.e. only a few per cent [11,14]. When the absorption is negligible (i.e. at wavelengths more than 800 nm), the scattering parameter S* follows from the reflectance value, R: S* = R/(1 − R) [14]. Accordingly, the lowest and highest scattering parameters were obtained for the flowers of E. vulgare and C. palustris, respectively. The flowers' thickness value, d, was more variable and ranged from 75 µm (Papaver rhoeas) to 419 µm (Nuphar lutea; table 1). The scattering coefficient (S = S*/d) is a measure of the inhomogeneity of the flower's interior and was found to vary considerably between species (table 1). The flowers of Solanum trisectum, which have a reflectance value R = 0.25 and thickness d = 0.33 mm, yielded the lowest scattering coefficient, S = 1.0 mm−1. The small thickness (d = 0.075 mm) and fairly high reflectance (R = 0.31) of P. rhoeas flowers yielded a high scattering coefficient of S = 6.0 mm−1. The scattering coefficient was even higher for flowers of Geranium robertianum, which were slightly thicker (d = 0.10 mm) but considerably brighter (R = 0.47), resulting in a very high scattering coefficient of S = 8.8 mm−1. In other words, the moderately thick flowers of S. trisectum are inefficient reflectors and the flowers of P. rhoeas and G. robertianum, which consist of only a few cell layers, are very efficient reflectors.
(c). Absorption of light by different pigment concentrations
From the reflectance and transmittance spectra, the absorptance spectra can be derived. These do not reliably represent the pigment absorption spectra, because scattering inside the petal distort the latter spectra. A more accurate way is to measure the absorbance of the floral element in a refractive index-matching fluid with a MSP. This revealed the presence of a diverse set of pigments (figure 3). The white area of the Hibiscus trionum petals yielded an absorbance spectrum with a high, narrow-band peak in the (ultra-)violet wavelength range. The yellow Oenothera biennis flowers featured an absorbance spectrum similar to that of β-carotene, the flowers of P. rhoeas show a pigment with a broad-band absorption spectrum with maximal absorption at approximately 500 nm, and the spectra of the blue flowers of Borago officinalis and Cichorium intybus indicated the presence of very similar pigments, but with about a threefold difference in absorbance (figure 3; see also figure 2b and electronic supplementary material, figure S1a). An extreme case of dense pigmentation is the deeply red-coloured proximal area of H. trionum petals (absorbance peak value approx. 2.5; electronic supplementary material, figure S2).
(d). Localization of floral pigments
Previous studies showed that the localization of floral pigments varies among plant species [12,13]. Generally, pigments can be localized throughout the floral elements in three ways (figure 4): (i) the pigment is rather evenly distributed throughout the petal (e.g. O. biennis, figure 4a), (ii) the upper and lower epidermises are pigmented, whereas the layer in between (mesophyll or starch layer) is unpigmented (e.g. Phaseolus coccineus, figure 4b), (iii) the pigment is asymmetrically localized in only one of the two epidermises (e.g. Browallia americana, figure 4c). The functional implications of the different pigment localizations will be discussed below.
Figure 4.

Localization of pigments in petals. (a) Oenothera biennis, (b) Phaseolus coccineus, and (c) Browallia americana. Scale bars, 50 µm.
(e). Modelling flower optics
The Kubelka–Munk-layer-stack model (Material and methods; [14]) was used to illustrate the consequences of different pigment localizations and scattering parameters on flower coloration. For the model petal, we assumed a thickness of 0.25 mm and a scattering coefficient S = 4 mm−1, hence a scattering parameter S* = 1. These values are similar to those found in real flowers (table 1). We considered five different cases, all having an equal amount of blue-absorbing carotenoid pigment. In all five cases, the long-wavelength reflectance was 50%. Since for transmission the pigment localization is unimportant, the model yields identical transmittance spectra for the different types of pigmentation, i.e. a low transmittance in the blue and a distinct peak in the UV. The flowers' reflectance spectra, however, strongly depended on the localization of the pigment (figure 5a). In case 1, the pigment was homogeneously distributed throughout the petal, resulting in a fairly high UV reflectance and a more moderate reflectance in the blue wavelength range (figure 5a). In case 2, an equal amount of pigment was distributed in the upper and lower 0.05 mm of the petal, yielding a reflectance spectrum similar to case 1, but with slightly lower UV and blue reflectance (figure 5a). In case 3, the pigment was located only in the top 0.05 mm of the petal, which resulted in a low reflectance in the UV and a very low reflectance in the blue wavelength range. The reflectance of the lower side of this model petal (as in case 4; figure 5a), however, is virtually wavelength independent, because the light is backscattered before it reaches the pigmented layer. Similarly, the hypothetical case of pigment localized only in the mesophyll layer also showed a weak modulation of the reflected light (case 5; figure 5a).
Figure 5.
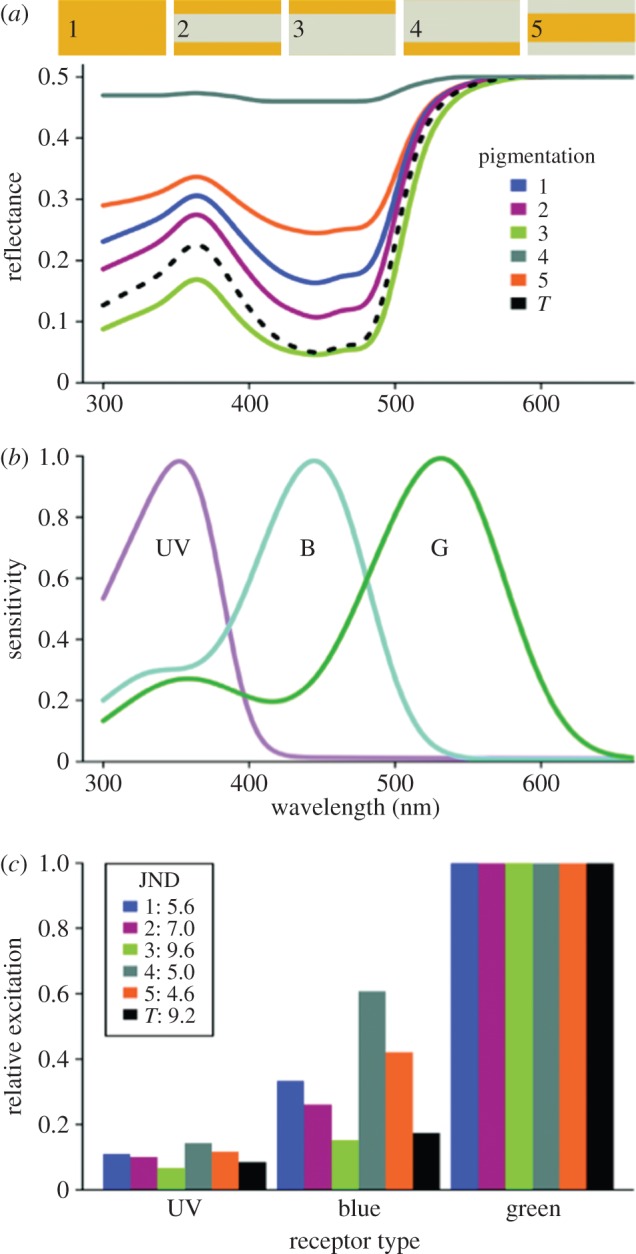
Different types of pigment localization of the model petal and their visual signals. (a) Reflectance spectrum of five model petals (thickness d = 0.25 mm, scattering parameter S* = 1) containing the same amount of the blue-absorbing pigment of Oenothera biennis (figure 3), with pigment homogeneously distributed (case 1), equally distributed in both a top and bottom layer of 0.05 mm (case 2), existing in a 0.05 mm top or bottom layer (case 3 and 4, respectively), and located only in the middle layer (case 5); the transmittance spectrum (T) is the same for all types of pigment localization. (b) Normalized spectral sensitivities of the honeybee photoreceptors used in the vision models. UV, ultraviolet; B, blue; G, green. (c) Bar plots of the relative excitation of the set of photoreceptors for the spectra of the model petal with the different types of pigment localization as shown in (a); inset: colour contrast values (in JND) using the RNL model.
(f). The bee visual system
We calculated the relative excitations of the set of bee photoreceptors by daylight and the reflectance spectra of the five model flowers (figure 5). The overall hue of the model petals was yellow, hence the strongest excitation always occurred in the green photoreceptor, but the excitation of the UV and blue photoreceptors distinctly varied between the different pigment localizations (figure 5c). The very weakly modulated reflectance spectra of cases 4 and 5 (figure 5a) resulted in a high excitation of the UV and blue photoreceptors but excitation of these photoreceptors was considerably less for a homogeneous (case 1) as well as symmetrical (case 2) pigmentation. The excitation of the UV and blue photoreceptors was very low for the spectrum of the model petal where pigment is only localized at the side of viewing (case 3, figure 5a), showing that this type of pigment localization yields a visual signal with the highest saturation. The saturation of the transmitted light is slightly lower than that created by the reflected light in case 3, because the peak in the UV is slightly higher for the transmitted light.
We interpreted the visual signal of the model spectra of figure 5a against that of a green background with a bee-subjective view using the RNL [21,22] model for insect vision (figure 5c, inset; electronic supplementary material, table S1). The model's results showed that the colour contrast of the flower against a green background increases when the spectral modulation of the reflected light increases, i.e. when absorption in the blue wavelength range increases. Consequently, the spectra of figure 5a yield colour contrast values that are low for the asymmetrical pigmentation observed from the unpigmented side as well as for the case where pigment only occurs in the mesophyll layer. The colour contrast is more moderate for homogeneous and symmetrical pigmentation, and very high when pigments occur only at the side of viewing (figure 5c, inset). For the transmission signal, the modulation of the spectrum is also strong, but not as strong as when the pigments only occur at the side of viewing. Clearly, symmetrical and homogeneous pigment localizations yield a moderately distinct coloration from a green background, whereas pigment localization solely at the display side provides the highest colour contrast. Using the CH model [23], very similar perceptual differences between the types of pigment localization were obtained, that is, both models showed low- or high-contrast values for specific spectra, as shown by the ratio of values normalized to the mean that is always close to 1 (electronic supplementary material, table S1).
Pairwise comparisons of the different reflectance spectra by the model petals yielded similar results: larger differences in the fraction of blue light absorbed resulted in larger contrast values (electronic supplementary material, table S1). The visual signals of petals with homogeneous and symmetrical pigmentation are similar (figure 5), and a pairwise comparison yields contrast values indeed below the threshold value for both vision models (electronic supplementary material, table S1). This shows that, although a symmetrical distribution of pigments yields a slightly higher colour contrast with the background, for the chosen set of model parameters homogeneously and symmetrically pigmented flowers are not visibly different.
We also tested the optical model with the same pigment localizations and thickness value as before (d = 0.25 mm) but with a lower scattering parameter, S* = 0.5 (electronic supplementary material, figure S3a), which is also commonly found in real species (table 1). The obtained spectra, photoreceptor quantum catches, and colour contrast values were similar to S* = 1 (electronic supplementary material, figure S3b; table S1), demonstrating that the pigment localization also strongly determines the visual signal for petals with a more moderately inhomogeneous interior.
4. Discussion
The plant kingdom encompasses a bewildering array of differently coloured flowers [3,6,10,13,27], with variations in anatomy, pigments, and pigment localizations, but how these differences contribute to the overall visual signal of flowers is largely unknown. Absorption by pigments occurs in the (ultra)violet, short-, and medium-wavelength ranges, but not in the long-wavelength range, i.e. above 800 nm (figures 1 and 2 and electronic supplementary material, figure S1). Although the long-wavelength reflectance is of no importance for visual signalling, because many flower-visiting insects, like bees, have negligible spectral sensitivity above approximately 650 nm [26], it can be used to quantify the amount of backscattering by a petal, as it is fully determined by scattering structures.
We measured the floral reflectance and transmittance of many species and found that the long-wavelength reflectance was always between 20 and 50% (figure 2; electronic supplementary material, figure S1; table 1). For both the long- and short-wavelength ranges, the transmittance was often higher than the reflectance (figure 2; electronic supplementary material, figure S1; table 1). This is somewhat surprising, because the transmitted light will often not be detected by foraging pollinators. In order for the transmittance to be perceived by pollinators, the flower needs to be positioned in between the pollinator and sun. Although this may occur for flowers attached high on trees or under specific circumstances, such as shortly after dawn or before sunset, in the majority of cases, however, the sun is high in the sky so that pollinators will perceive reflected light. The reflectance and transmittance of the flower examples presented here are similar to those found in flowers of other plant species [28–30].
The selective pressures—or the lack of them—imposed by the visual ecology of pollinators may explain the virtual absence of very weakly and strongly reflecting flowers. In order to provide a sufficiently coloured signal, flowers need to reflect a minimum amount of light. The observed long-wavelength reflectance minimum of 20% is presumably sufficient to create a substantial modulation by pigments of the reflected light. Conversely, the absence of flowers with a long-wavelength reflectance of more than 50% suggests that a higher value will not effectively enhance the visibility to pollinators. Indeed, the colour contrast values obtained for reflectance and transmittance spectra of real flowers showed great variation independent of the brightness (table 1), highlighting that the absorption by pigments is very important for creating a distinct visual signal. Behavioural and psychophysiological experiments with diurnal insect pollinators have shown that brightness of the visual signal may play a role for long-distance detection of flowers [31,32], whereas chromatic aspects are important for short-distance discrimination [24,33,34]. Extreme increases in floral brightness need not necessarily be beneficial, however, because insect colour vision generally adapts to intensity changes [35–37], a phenomenon known as ‘colour constancy’ (reviewed in [38]). The virtual absence of flowers with reflectance below or above the 20–50% range hence suggests that flowers could be physiologically limited to increase their scattering, and/or that this range is sufficient to create distinct colours.
In order to obtain a quantitative measure of the inhomogeneity of the flower's interior independent of the flower thickness, we calculated the scattering coefficient. The observed eightfold variation in the scattering coefficient as well as in the thickness values between the investigated species (table 1) illustrates that flowers of different species greatly differ in their anatomy. The thickness of a flower is presumably correlated with the flower's size, because thicker flowers will need to have more mechanical strength. The amount of vacuoles, amyloplasts, and cell walls in flowers varies considerably amongst different species [12,18], comparable to what was previously found for leaves [39]. From this study, it is clear that thin flowers are not necessarily dim flowers, that is, flowers with very thin petals can—and maybe must—have a very inhomogeneous interior to achieve sufficient light reflection for luring pollinators.
The floral pigment selectively filters the backscattered light (figure 2; electronic supplementary material, figure S1), and increases in pigment concentration will result in more absorption of light in a specific wavelength range (figure 3; electronic supplementary material, figure S2). Increases in pigment concentration may, however, not always be an optimal strategy, e.g. when pigment synthesis is energetically costly. Alternatively, deposition of pigments in specific layers can increase the colour contrast (figures 4 and 5). Our modelling showed that deposition of pigments exclusively in the middle mesophyll layer is inefficient, because part of the light is backscattered before it reaches the pigment. The resulting low contrast with the background (figure 5c) may explain why it is almost never found in real flowers [12]. Homogeneous or symmetrical pigment deposition in the epidermal layers causes similarly coloured upper and lower sides of the flower but a rather moderate modulation of the spectrum and moderate contrast values (figure 5c; electronic supplementary material, table S1). Pigment deposition solely in the upper epidermal layer resulted in a pigmented side that strongly contrasted with the green background, whereas the unpigmented side was weakly discriminable from a green background (9.6 versus 5.0 JND units; figure 5c). When viewed from the side of viewing, the pigment is most efficiently used, because the light backscattered by the unpigmented layer traverses the pigmented layer twice. Because higher perceptual differences are distinguished by bees with more accuracy [40], asymmetrical pigment deposition at the side of viewing yields the strongest visual signal. Furthermore, the pigmented side has a very high saturation (figure 5c), a trait that is preferred by bees [41,42]. Similar contrast values were obtained for model petals with a lower scattering parameter (electronic supplementary material, figure S3 and table S1), as well as for real flowers with asymmetrically located pigment (Vinca minor and G. robertianum; electronic supplementary material, figure S4 and table S2), demonstrating that pigment localization strongly determines the visual signal of flowers. Because asymmetrical deposition of pigments yields dramatically different-coloured floral sides (electronic supplementary material, figure S4; [14]), this pigmentation is expected for flowers that are visited from only one side.
Based on a survey covering 201 plant species from 60 families, Kay et al. [12] noted that carotenoids generally occur in both the mesophyll and epidermal layers, whereas anthocyanin and UV-absorbing flavonoid pigments are more frequently located solely in the epidermal layers. Spatial differences in pigmentation (e.g. [6,43]) can be due to differences in expression of the pigments' biosynthetic pathway, which likely is phylogenetically constrained, but may also be due to a different interior inhomogeneity in the tubes, lobes, and veins of flowers [14,44]. The complex interplay between the visual ecology of pollinators and the physiological constraints of flowers provides an intriguing avenue for further research. Emerging research questions involve comparing the visual signals of large-flowered plants versus small ones, as small flowers may need to compensate for their reduced conspicuousness via a stronger visual signal [24,45], and studying whether the significance of transmission as a visual signal changes under different illumination conditions, such as in (dense) forests where illumination is less directional. A modelling approach may reveal which types of pigment localization are optimal for flowers with different scattering parameters or thicknesses. Of particular interest is examining whether the variance in optical properties found in flowers can be linked to the visual system of their pollinators.
In conclusion, this study explored the common optical principles of flower coloration. Backscattering of light by flowers increases when the flower's thickness and inhomogeneity of the interior increase. The fractions of reflected and transmitted light are similar, hinting at restrictions imposed by the plants' physiology and ecology, as well as by the visual ecology of pollinators. The efficiency of pigmentary filtering strongly depends on the concentration and localization of the pigment. Our optical model in conjunction with insect vision models opens new perspectives for studies on the virtues of flower colour.
Supplementary Material
Acknowledgements
The authors gratefully acknowledge Hein Leertouwer for assistance and two referees for valuable comments.
Data accessibility
The datasets supporting this article have been uploaded as part of the electronic supplementary material.
Authors' contributions
C.J.v.d.K., M.S., and D.G.S. performed measurements. C.J.v.d.K. and D.G.S. designed the study, carried out the modelling and drafted the manuscript. All authors analysed the results and contributed to the manuscript.
Competing interests
We have no competing interests.
Funding
This work was funded by EOARD/AFOSR grant no. FA8655-12-1-2053.
References
- 1.Faegri K, Van der Pijl L. 1979. The principles of pollination ecology. Oxford, UK: Pergamon Press. [Google Scholar]
- 2.Chittka L, Menzel R. 1992. The evolutionary adaptation of flower colours and the insect pollinators’ colour vision. J. Comp. Phys. A 171, 171–181. ( 10.1007/BF00188925) [DOI] [Google Scholar]
- 3.Menzel R, Shmida A. 1993. The ecology of flower colours and the natural colour vision of insect pollinators: the Israeli flora as a study case. Biol. Rev. 68, 81–120. ( 10.1111/j.1469-185X.1993.tb00732.x) [DOI] [Google Scholar]
- 4.Kevan PG, Baker HG. 1983. Insects as flower visitors and pollinators. Annu. Rev. Ento. 28, 407–453. ( 10.1146/annurev.en.28.010183.002203) [DOI] [Google Scholar]
- 5.Hempel de Ibarra N, Vorobyev M, Menzel R. 2014. Mechanisms, functions and ecology of colour vision in the honeybee. J. Comp. Phys. A 200, 411–433. ( 10.1007/s00359-014-0915-1) [DOI] [PMC free article] [PubMed] [Google Scholar]
- 6.Vorobyev M, Gumbert A, Kunze J, Giurfa M, Menzel R. 1997. Flowers through insect eyes. Isr. J. Plant Sci. 45, 93–101. ( 10.1080/07929978.1997.10676676) [DOI] [Google Scholar]
- 7.Dyer AG, Boyd-Gerny S, McLoughlin S, Rosa MG, Simonov V, Wong BB. 2012. Parallel evolution of angiosperm colour signals: common evolutionary pressures linked to hymenopteran vision. Proc. R. Soc. B 279, 3606–3615. ( 10.1098/rspb.2012.0827) [DOI] [PMC free article] [PubMed] [Google Scholar]
- 8.Ohashi K, Makino TT, Arikawa K. 2015. Floral colour change in the eyes of pollinators: testing possible constraints and correlated evolution. Funct. Ecol. 29, 1144–1155. ( 10.1111/1365-2435.12420) [DOI] [Google Scholar]
- 9.Papiorek S, et al. 2016. Bees, birds and yellow flowers: pollinator-dependent convergent evolution of UV patterns. Plant Biol. 18, 46–55. ( 10.1111/plb.12322) [DOI] [PubMed] [Google Scholar]
- 10.van der Kooi CJ, Pen I, Staal M, Stavenga DG, Elzenga JTM. 2016. Competition for pollinators and intra-communal spectral dissimilarity of flowers. Plant Biol. 18, 56–62. ( 10.1111/plb.12328) [DOI] [PubMed] [Google Scholar]
- 11.van der Kooi CJ, Wilts BD, Leertouwer HL, Staal M, Elzenga JTM, Stavenga DG. 2014. Iridescent flowers? Contribution of surface structures to optical signaling. New Phytol. 203, 667–673. ( 10.1111/nph.12808) [DOI] [PubMed] [Google Scholar]
- 12.Kay QON, Daoud HS, Stirton CH. 1981. Pigment distribution, light reflection and cell structure in petals. Bot. J. Linnean Soc. 83, 57–83. ( 10.1111/j.1095-8339.1981.tb00129.x) [DOI] [Google Scholar]
- 13.Lee DW. 2007. Nature's Palette. The science of plant color. Chicago, IL: University of Chicago Press. [Google Scholar]
- 14.Stavenga DG, van der Kooi CJ. 2016. Coloration of the Chilean Bellflower, Nolana paradoxa, interpreted with a scattering and absorbing layer stack model. Planta 243, 171–181. ( 10.1007/s00425-015-2395-0) [DOI] [PMC free article] [PubMed] [Google Scholar]
- 15.Kubelka P, Munk F. 1931. Ein Beitrag zur Optik der Farbanstriche. Z. Tech. Phys. 12, 593–601. [Google Scholar]
- 16.Yamada N, Fujimura S. 1991. Nondestructive measurement of chlorophyll pigment content in plant leaves from three-color reflectance and transmittance. Appl. Opt. 30, 3964–3973. ( 10.1364/AO.30.003964) [DOI] [PubMed] [Google Scholar]
- 17.Stavenga DG, Giraldo MA, Hoenders BJ. 2006. Reflectance and transmittance of light scattering scales stacked on the wings of pierid butterflies. Opt. Express 14, 4880–4890. ( 10.1364/OE.14.004880) [DOI] [PubMed] [Google Scholar]
- 18.van der Kooi CJ. 2015. The coloration toolkit of flowers. Filtering pigments, scattering structures and biological significance. PhD thesis, Groningen, University of Groningen.
- 19.Horváth G, Gál J, Labhart T, Wehner R. 2002. Does reflection polarization by plants influence colour perception in insects? Polarimetric measurements applied to a polarization-sensitive model retina of Papilio butterflies. J. Exp. Biol. 205, 3281–3298. [DOI] [PubMed] [Google Scholar]
- 20.van der Kooi CJ, Dyer AG, Stavenga DG. 2015. Is floral iridescence a biologically relevant cue in plant–pollinator signaling? New Phytol. 205, 18–20. ( 10.1111/nph.13066) [DOI] [PubMed] [Google Scholar]
- 21.Vorobyev M, Osorio D. 1998. Receptor noise as a determinant of colour thresholds. Proc. R. Soc. Lond. B 265, 351–358. ( 10.1098/rspb.1998.0302) [DOI] [PMC free article] [PubMed] [Google Scholar]
- 22.Vorobyev M, Brandt R, Peitsch D, Laughlin SB, Menzel R. 2001. Colour thresholds and receptor noise: behaviour and physiology compared. Vis. Res. 41, 639–653. ( 10.1016/S0042-6989(00)00288-1) [DOI] [PubMed] [Google Scholar]
- 23.Chittka L. 1992. The colour hexagon: a chromaticity diagram based on photoreceptor excitations as a generalized representation of colour opponency. J. Comp. Phys. A 170, 533–543. ( 10.1007/BF00199331) [DOI] [Google Scholar]
- 24.Spaethe J, Tautz J, Chittka L. 2001. Visual constraints in foraging bumblebees: flower size and color affect search time and flight behavior. Proc. Natl Acad. Sci. USA 98, 3898–3903. ( 10.1073/pnas.071053098) [DOI] [PMC free article] [PubMed] [Google Scholar]
- 25.Kemp DJ, Herberstein ME, Fleishman LJ, Endler JA, Bennett ATD, Dyer AG, Hart NS, Marshall J, Whiting MJ. 2015. An integrative framework for the appraisal of coloration in nature. The American Naturalist. 185, 705–724. ( 10.1086/681021) [DOI] [PubMed] [Google Scholar]
- 26.Peitsch D, Fietz A, Hertel H, Desouza J, Ventura DF, Menzel R. 1992. The spectral input systems of hymenopteran insects and their receptor-based color-vision. J. Comp. Phys. A 170, 23–40. ( 10.1007/BF00190398) [DOI] [PubMed] [Google Scholar]
- 27.Chittka L, Shmida A, Troje N, Menzel R. 1994. Ultraviolet as a component of flower reflections, and the colour perception of Hymenoptera. Vis. Res. 34, 1489–1508. ( 10.1016/0042-6989(94)90151-1) [DOI] [PubMed] [Google Scholar]
- 28.Gorton HL, Vogelmann TC. 1996. Effects of epidermal cell shape and pigmentation on optical properties of Antirrhinum petals at visible and ultraviolet wavelengths. Plant Phys. 112, 879–888. [DOI] [PMC free article] [PubMed] [Google Scholar]
- 29.McKee J, Richards A. 1998. Effect of flower structure and flower colour on intrafloral warming and pollen germination and pollen-tube growth in winter flowering Crocus L. (Iridaceae). Bot. J. Linnean Soc. 128, 369–384. ( 10.1111/j.1095-8339.1998.tb02127.x) [DOI] [Google Scholar]
- 30.Patino S, Grace J. 2002. The cooling of convolvulaceous flowers in a tropical environment. Plant Cell Environ. 25, 41–51. ( 10.1046/j.0016-8025.2001.00801.x) [DOI] [Google Scholar]
- 31.Giurfa M, Vorobyev M, Kevan P, Menzel R. 1996. Detection of coloured stimuli by honeybees: minimum visual angles and receptor specific contrasts. J. Comp. Phys. A 178, 699–709. ( 10.1007/BF00227381) [DOI] [Google Scholar]
- 32.Hempel de Ibarra N, Vorobyev M, Brandt R, Giurfa M. 2000. Detection of bright and dim colours by honeybees. J. Exp. Biol. 203, 3289–3298. [DOI] [PubMed] [Google Scholar]
- 33.Giurfa M, Vorobyev M, Brandt R, Posner B, Menzel R. 1997. Discrimination of coloured stimuli by honeybees: alternative use of achromatic and chromatic signals. J. Comp. Phys. A 180, 235–243. ( 10.1007/s003590050044) [DOI] [Google Scholar]
- 34.Niggebrügge C, Hempel de Ibarra N. 2003. Colour-dependent target detection by bees. J. Comp. Phys. A 189, 915–918. ( 10.1007/s00359-003-0466-3) [DOI] [PubMed] [Google Scholar]
- 35.Neumeyer C. 1981. Chromatic adaptation in the honeybee: successive color contrast and color constancy. J. Comp. Phys. A 144, 543–553. ( 10.1007/BF01326839) [DOI] [Google Scholar]
- 36.Dyer AG. 1998. The colour of flowers in spectrally variable illumination and insect pollinator vision. J. Comp. Phys. A 183, 203–212. ( 10.1007/s003590050248) [DOI] [Google Scholar]
- 37.Kinoshita M, Arikawa K. 2000. Colour constancy in the swallowtail butterfly Papilio xuthus. J. Exp. Biol. 203, 3521–3530. [DOI] [PubMed] [Google Scholar]
- 38.Kelber A, Osorio D. 2010. From spectral information to animal colour vision: experiments and concepts. Proc. R. Soc. B 277, 1617–1625. ( 10.1098/rspb.2009.2118) [DOI] [PMC free article] [PubMed] [Google Scholar]
- 39.Gausman H, Allen W. 1973. Optical parameters of leaves of 30 plant species. Plant Phys. 52, 57–62. ( 10.1104/pp.52.1.57) [DOI] [PMC free article] [PubMed] [Google Scholar]
- 40.Dyer AG. 2006. Discrimination of flower colours in natural settings by the bumblebee species Bombus terrestris (Hymenoptera: Apidae). Ent. Gener. 28, 257–268. [Google Scholar]
- 41.Lunau K. 1990. Colour saturation triggers innate reactions to flower signals: flower dummy experiments with bumblebees. J. Comp. Phys. A 166, 827–834. ( 10.1007/BF00187329) [DOI] [Google Scholar]
- 42.Rohde K, Papiorek S, Lunau K. 2013. Bumblebees (Bombus terrestris) and honeybees (Apis mellifera) prefer similar colours of higher spectral purity over trained colours. J. Comp. Phys. A 199, 197–210. ( 10.1007/s00359-012-0783-5) [DOI] [PubMed] [Google Scholar]
- 43.Hempel De Ibarra N, Langridge KV, Vorobyev M. 2015. More than colour attraction: behavioural functions of flower patterns. Curr. Opin. Insect Sci. 12, 64–70. ( 10.1016/j.cois.2015.09.005) [DOI] [PMC free article] [PubMed] [Google Scholar]
- 44.Martin C, Gerats T. 1993. Control of pigment biosynthesis genes during petal development. Plant Cell 5, 1253 ( 10.1105/tpc.5.10.1253) [DOI] [PMC free article] [PubMed] [Google Scholar]
- 45.Dafni A, Kevan PG. 1997. Flower size and shape: implications in pollination. Isr. J. Plant Sci. 45, 201–211. ( 10.1080/07929978.1997.10676684) [DOI] [Google Scholar]
Associated Data
This section collects any data citations, data availability statements, or supplementary materials included in this article.
Supplementary Materials
Data Availability Statement
The datasets supporting this article have been uploaded as part of the electronic supplementary material.