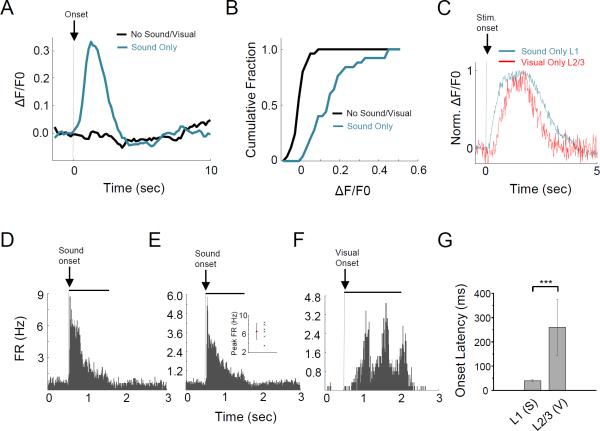
Figure 6. Sound alone excites L1 neurons.
(A) Average Ca2+ response trace of an example L1 neuron to sound stimulation alone (blue). Black, trigger only with zero sound output.
(B) Cumulative distribution of L1 neurons’ peak Ca2+ response amplitudes to sound (n = 27 cells).
(C) Population Ca2+ response of 5 L1 neurons to sound stimulation alone (blue) and that of 5 L2/3 neurons to visual stimulation alone (red) imaged in the same mouse, both normalized to their respective peak amplitude.
(D) PSTH of spike responses of an example L1 neuron to sound stimulation alone. Solid black line marks the sound duration.
(E) Average PSTH for 6 L1 neurons. Inset, peak firing rates of individual neurons and their mean. Bar = SD.
(F) PSTH for responses of an example L2/3 neuron to visual stimulation alone. Black bar marks the duration of moving gratings.
(G) Average onset latencies of L1 neuron spike responses to sound stimulation and L2/3 neuron spike responses to gratings. Onset latency was determined from the PSTH of an individual cell by the time when spike rate exceeds the average baseline firing rate plus two standard deviations of baseline fluctuations. Bar = SD. **p < 0.01, t-test, n = 6 for L1 and 14 for L2/3.

