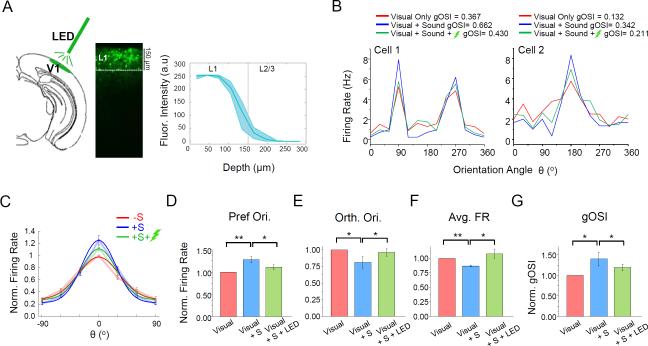
Figure 7. Suppressing L1 neurons reduces the sound-induced OS sharpening effect.
(A) Left, schematic diagram of the experimental setup. Green LED illumination was applied to V1 surface. Middle, expression pattern of ArchT-GFP in a GAD2-Cre mouse. Right, average fluorescence intensity of ArchT-GFP at different depths across animals examined (n = 4). Shade = 95% confidence level.
(B) Tuning curves of evoked firing rate for two example L2/3 pyramidal neurons. Red, blue and green lines represent visual stimulation only, visual plus sound stimulation, visual plus sound plus inhibiting L1, respectively.
(C) Average tuning curves in three different conditions across all the cells recorded (n = 11).
(D-G) Normalized evoked firing rates at the preferred (D) and orthogonal orientation (E), average evoked firing rates across all orientations (F), as well gOSI values (G) under the three different conditions. Data represent mean ± SEM. *, p < 0.05; **, p < 0.01, one-way ANOVA with repeated measures.

