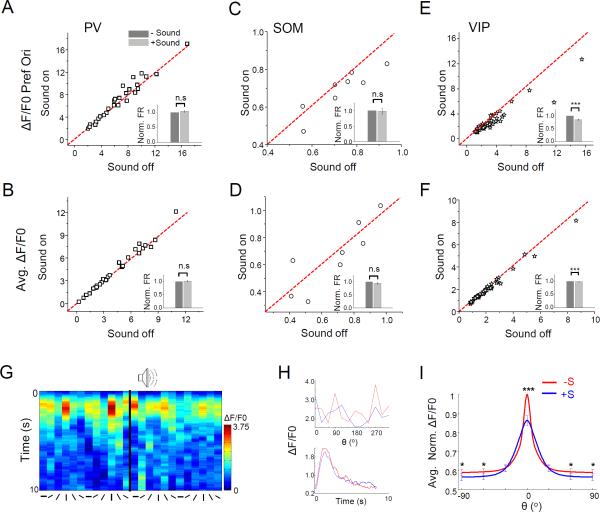
Figure 8. Effects of sound stimulation on PV, SOM and VIP neurons in L2/3.
(A-B) Plots of peak Ca2+ response amplitude at the preferred orientation (A) and of average response amplitude across orientations (B) in the sound-on versus sound-off conditions for PVneurons (n = 30). Insets, mean normalized response amplitudes. Bar = SEM. “n.s.”, p > 0.05, Wilcoxon signed-rank test.
(C-D) Plots of response amplitudes for SOM neurons (n = 8). Data are presented in the same manner as in (A-B). “n.s.”, p > 0.05, paired t-test.
(E-F) Plots of response amplitudes for VIP neurons (n = 40). ***, p < 0.001, Wilcoxon signed-rank test (E) or paired t-test (F).
(G) Color map of ΔF/F0 for an example L2/3 VIP neuron.
(H) Top, tuning curves of peak ΔF/F0. Bottom, time-dependent ΔF/F0 averaged across all orientations for the same cell shown in (G). Red, visual stimulation alone; blue, visual plus sound stimulation.
(I) Average of Gaussian fits of tuning curves of individual VIP neurons. * p < 0.05; *** p < 0.001, Wilcoxon signed-rank test.

