

Abstract
Research Objective
This study examines small area variations in readmission rates to assess whether higher readmission rate in an area is associated with higher clusters of patients with multiple chronic conditions.
Study Design
The study uses hospital discharge data of adult (18+) patients in 6 U.S. states for 2009 from the Healthcare Cost and Utilization Project of the Agency for Healthcare Research and Quality, linked to contextual and provider data from Health Resources and Services Administration. A multivariate cross sectional design at primary care service area (PCSA) level is used.
Principal Findings
Adjusting for area characteristics, the readmission rates were significantly higher in PCSAs having higher proportions of patients with 2–3 chronic conditions and those with 4+ chronic conditions, compared with areas with a higher concentration of patients with 0–1 chronic conditions.
Conclusions
Using small area analysis, the study shows that areas with higher concentration of patients with increased comorbid conditions are more likely to have higher readmission rates.
Keywords: Hospital readmissions, multiple chronic conditions, small area analysis, comorbidities, U.S. states
Readmission to U.S. hospitals has received growing attention because of implications on cost and quality of care. To add to this growing interest are concerns that a remarkable number of readmissions are preventable (Weissman et al. 1999; Jiang et al. 2003; Friedman and Basu 2004; Jencks, Williams, and Coleman 2009). While the readmission rate is often presented as a measure of the performance of hospitals, it may also be a useful indicator of the performance of our health care system (Ashton and Wray 1996; Jencks, Williams, and Coleman 2009). Although studies document urban‐rural differences in readmission rates, no study has yet examined the variations in readmission rates across small areas. Dartmouth Atlas group examined hospital referral regions and reported striking variations in 30‐day readmission rates for medical and surgical discharges (Goodman, Fisher, and Chang 2011; Dartmouth Atlas 2013). These studies also indicate that little progress has been made in reducing readmissions and improving care coordination between 2004 and 2009. The findings of these studies consistently highlight widespread and systematic failures in coordinating care for patients after they are discharged from the hospital.
The broad purpose of this study is to assess the small area variations in readmission rates and to examine the extent to which multiple chronic illnesses contribute to such variations. The issue is significant in the context of previous research that reported chronic conditions to be a stronger predictor of hospital readmission rates relative to acute conditions (Jiang et al. 2003; Friedman, Jiang, and Elixhauser 2006, 2008; Hubbard et al. 2014). To add to this body of research, this is the first study that adopts a small area‐level approach to assess the independent association between hospital readmission rates and the proportion of patients with multiple chronic illnesses in the area. By focusing on the area of residence of patients, the study also addresses a research gap that links readmission rates to where patients live (Dartmouth Atlas 2013; Goodman 2013). The study builds on work by Herrin et al. (2015) that shows the importance of the community factors in predicting readmission rates. This is also the first study that provides an analysis of readmission rates at the primary care service area (PCSA) level, developing a conceptual framework and testing hypotheses at that level.
Background and Conceptual Framework
Typically, a complex interplay of personal, medical, and social factors determines whether patients successfully recover or cope with their condition following a hospital stay or experience deterioration that leads to readmission (McCarthy, Johnson, and Audet 2013). Figure 1 depicts a conceptual model for readmissions using a combination of the Andersen‐Newman framework (Andersen 1995) and Structure‐Process‐Outcomes framework by Aday et al. (1998) and Ashton and Wray (1996). The model shows that various socio‐demographic features of the patients and the community, including predisposing (gender, race, age), enabling (income, insurance, literacy), need (health status, prevalence of chronic illness), and environmental (resource supplies, primary care provider and population density, and geographic location) characteristics together contribute to generate a hospital admission. The factors that contribute to readmissions should include all of the above, plus those occurring during the hospital stay such as poor processes of care (delivery of care such as care coordination, service utilization, adequate length of stay, equitable care, and safety‐net status), and suboptimal structure of care (workforce, number of hospital beds) followed by the transition into a suitable post‐discharge care environment (such as inadequate care coordination, self‐management capabilities, and access to primary care, etc.). Hospital structural characteristics and measures of processes of care, as well as hospital mortality outcomes, are often used as indicators of quality of hospital care. In the multivariate analysis that follows, we will use selected variables based on this conceptual framework.
Figure 1.
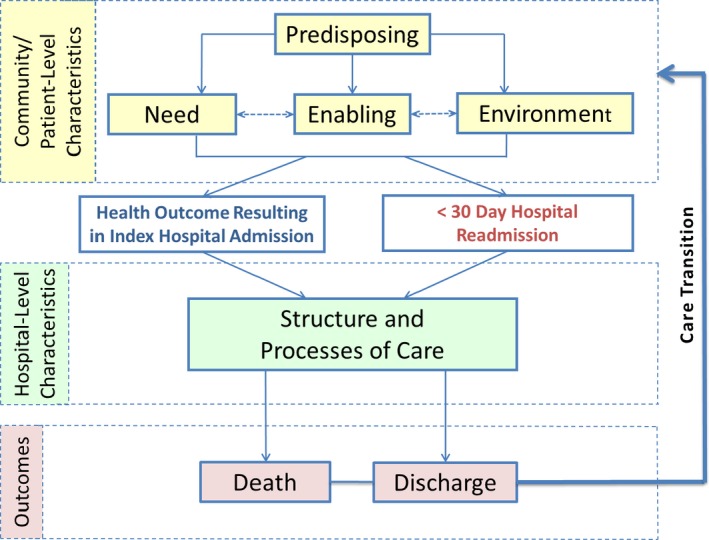
- Note. Readmission occurs after the patient is discharged from the index hospital admission.
Study Design and Methods
The study uses a multivariate cross sectional design, regressing area hospital readmission rates for all causes on area‐level prevalence indicators of chronic conditions, holding other area‐level factors constant. Consistent with the conceptual framework, the analysis is conducted using two models. In the first model, we primarily focus on the personal and community characteristics that contribute generally to a hospital admission (Model 1, Table 3). In the second model, which constitutes the broader analysis (Model 2, Table 3), a fuller model is constructed with selected additional covariates representing the characteristics and the quality of the hospitals of the area. This latter set of variables may include both encounter‐level and organizational factors described by Vest et al. (2010) and are related to suboptimal structure of care provided in the community and hospital, as described in the conceptual framework.
Table 3.
Multivariate Analysis Results, 2009
| Independent Variables | Model 1 | Model 2 | |||||
|---|---|---|---|---|---|---|---|
| Coefficient (SE) | 95% CI | Coefficient (SE) | 95% CI | ||||
| Primary | Chronic conditions discharges (ref: 0–1 conditions) | ||||||
| 2–3 conditions | 0.44 (0.218)a | 0.02 | 0.87 | 0.43 (0.213)a | 0.01 | 0.85 | |
| 4+ conditions | 0.25 (0.116)a | 0.02 | 0.48 | 0.27 (0.112)a | 0.05 | 0.49 | |
| Geographic | Population density | −3.2E‐07 (4.1E‐07) | −1.1E‐06 | 5.0E‐07 | −4.0E‐07 (4.1E‐07) | −1.2E‐06 | 4.02E3‐07 |
| Rural/urban (ref: urban) | |||||||
| Suburban | 0.00 (0.015) | −0.03 | 0.03 | −0.01 (0.015) | −0.03 | 0.02 | |
| Large town | −0.02 (0.015) | −0.05 | 0.01 | −0.02 (0.015) | −0.05 | 0.01 | |
| Small town | −0.05 (0.018)a | −0.09 | −0.02 | −0.05 (0.018)a | −0.09 | −0.02 | |
| Rural/isolated | 0.01 (0.022) | −0.04 | 0.05 | 0.01 (0.022) | −0.04 | 0.05 | |
| State (ref: California) | |||||||
| Florida | 0.05 (0.022)a | 0.01 | 0.09 | 0.07 (0.023)a | 0.03 | 0.12 | |
| Missouri | 0.19 (0.022)b | 0.14 | 0.23 | 0.20 (0.022)b | 0.15 | 0.24 | |
| Nebraska | 0.08 (0.031)a | 0.02 | 0.14 | 0.10 (0.030)a | 0.04 | 0.16 | |
| New York | 0.12 (0.015)b | 0.09 | 0.15 | 0.12 (0.017)b | 0.08 | 0.15 | |
| Tennessee | 0.00 (0.024) | −0.04 | 0.05 | 0.01 (0.024) | −0.04 | 0.06 | |
| Demographics | Gender (ref: female) | ||||||
| Male | −0.46 (0.193)a | −0.84 | −0.09 | −0.55 (0.185)a | −0.91 | −0.19 | |
| Age (ref: 18–34 years) | |||||||
| 35–44 years | 1.32 (0.035)b | 0.64 | 2.00 | 1.24 (0.345) | 0.56 | 1.92 | |
| 45–54 years | −0.13 (0.456) | −1.03 | 0.76 | −0.16 (0.443) | −1.03 | 0.71 | |
| 55–64 years | 0.54 (0.469) | −0.38 | 1.46 | 0.41 (0.474) | −0.52 | 1.34 | |
| 65–74 years | −1.41 (0.592)a | −2.57 | −0.25 | −1.43 (0.589)a | −2.59 | −0.28 | |
| 75–84 years | 1.42 (0.717)a | 0.02 | 2.83 | 1.44 (0.730)a | 0.01 | 2.87 | |
| 85+ years | −0.77 (0.810) | −2.36 | 0.81 | −1.11 (0.857) | −2.79 | 0.57 | |
| Ethnicity (ref: non‐Hispanic) | |||||||
| Hispanic | −0.05 (0.040) | −0.13 | 0.02 | −0.04 (0.039) | −0.12 | 0.03 | |
| Race (ref: white) | |||||||
| Black | 0.04 (0.037) | −0.03 | 0.11 | 0.02 (0.039) | −0.06 | 0.09 | |
| Other | 0.07 (0.052) | −0.03 | 0.18 | 0.07 (0.052) | −0.03 | 0.17 | |
| Median income, 2008 | −2.9E‐07 (5.1E‐07) | −1.3E‐06 | 7.2E‐07 | −3.1E‐07 (5.2E‐07) | −1.3E‐06 | 7.1E‐07 | |
| Accessibility | Primary care physician (ref: 0–4 PCP per 100,000), 2007 | ||||||
| 5 to 14 per 100,000 | 0.06 (0.017)b | 0.02 | 0.09 | 0.06 (0.017)b | 0.02 | 0.09 | |
| 15 to 57 per 100,000 | 0.05 (0.019)a | 0.01 | 0.08 | 0.05 (0.018)a | 0.01 | 0.09 | |
| 58+ per 100,000 | 0.06 (0.020)a | 0.02 | 0.10 | 0.06 (0.020)a | 0.03 | 0.10 | |
| Discharges by insurance type (ref: private) | |||||||
| Medicare | 0.87 (0.110)b | 0.65 | 1.08 | 0.78 (0.116)b | 0.56 | 1.01 | |
| Medicaid | 0.35 (0.120)a | 0.12 | 0.59 | 0.33 (0.125)a | 0.08 | 0.58 | |
| Uninsured | 0.43 (0.257) | −0.08 | 0.93 | 0.42 (0.261) | −0.09 | 0.94 | |
| Other | 0.51 (0.175)a | 0.17 | 0.86 | 0.57 (0.187)a | 0.21 | 0.94 | |
| Hospital | Hospital mortality | 2.15 (0.873)a | 0.44 | 3.86 | |||
| Length of stay (days) | 0.02 (0.012) | −0.01 | 0.04 | ||||
| Hospital size (ref: small) | |||||||
| Percent large | −0.06 (0.025)a | −0.11 | −0.01 | ||||
| Percent medium | −0.09 (0.028)b | −0.15 | −0.04 | ||||
Number of observations in both regression models = 1,261. Rounding errors may be present in the estimates.
Estimates are significant at the α = .05 level.
Estimates are significant at the α = .001 level.
The study uses hospital discharge data of patients in six US states: California (CA), Florida (FL), Missouri (MO), Nevada (NE), New York (NY), and Tennessee (TN), for 2009 in the adult age group (18 and above). The states were selected based on the availability of confidential 2009 HCUP‐SID data and encrypted patient identifier to calculate readmissions. The data are obtained from the Healthcare Cost and Utilization Project (HCUP) State Inpatient Databases (SID) of the Agency for Healthcare Research and Quality (AHRQ, 2004), linked to the contextual and provider data from Health Resources and Services Administration (HRSA) by the PCSAs (described below).
In this study, we use PCSA as the small area unit, a group of zip codes validated in previous research as natural markets for primary care (Goodman et al. 2003). We classified patients by their areas of residence, and PCSA is used as the areal unit. To create the analytical files, we first created PCSAs by using 2009 zip code file by state with latitude and longitude, and 2006 PCSA boundary files from RTI or HRSA website, and determined, for each zip code, whether latitude and longitude of the zip code is inside a particular PCSA. Next, we combined the discharge data in HCUP‐SID available by zip code of patient residence and linked to data from American Hospital Association (AHA) for hospital characteristics. Finally, we merged discharge data by PCSA derived from HCUP on to HRSA files to obtain the contextual data at the PCSA level. Dataset was limited to PCSAs within the state. There are a total of 1,261 PCSAs in the six states we use for the study.
Table 1 displays the data on average admission rates per 1,000 population, average 30‐day readmission rates per 1,000 population, average 30‐day readmissions as percent of total index admissions, and the coefficient of variations (CV) estimates. The table indicates that there were substantial variations in both admissions per 1,000 and 30‐day readmissions per 1,000 across PCSAs of each state, the variability being higher for 30‐day readmissions than admissions per 1,000 population. The readmissions as percent of total admissions indicate smaller overall variation than the other two measures.
Table 1.
Total Admissions and Readmissions Per 1,000 Population, Percent Readmissions and Coefficient of Variation (CV) among Primary Care Service Areas by State,a 2009
| State | Number of PCSAs | Total Admissions Per 1,000 Population | Readmissions within 30 Days | ||||
|---|---|---|---|---|---|---|---|
| Per 1,000 Population | Percent of Total Admissions | ||||||
| Rate Per 1,000 | CV | Rate Per 1,000 | CV | % of Total Admissions | CV | ||
| California | 333 | 92.9 | 0.29 | 7.3 | 0.36 | 7.8 | 0.15 |
| Florida | 165 | 113.6 | 0.30 | 9.6 | 0.39 | 8.4 | 0.23 |
| Missouri | 201 | 120.9 | 0.29 | 10.9 | 0.36 | 8.9 | 0.14 |
| Nebraska | 115 | 127.5 | 0.37 | 11.1 | 0.44 | 8.5 | 0.13 |
| New York | 309 | 131.0 | 0.32 | 11.6 | 0.36 | 8.7 | 0.11 |
| Tennessee | 138 | 142.7 | 0.27 | 14.3 | 0.36 | 9.9 | 0.19 |
| All states | 1,261 | 118.4 | 0.34 | 10.5 | 0.44 | 8.7 | 0.18 |
Coefficient of variation (CV) shows the extent of variation by dividing the standard deviation by the mean PCSA value. A higher value means more variation.
Only includes in‐state residents that received care in their respective states.
Source: Healthcare Cost and Utilization Project State Inpatient database (2009); Health Resources and Services Administration, Spatial data Warehouse (http://datawarehouse.hrsa.gov).
Multivariate Models
Model Selection: To examine small area‐variations in readmission rates, we first conducted the Breusch‐Pagan and Park tests for heteroskedasticity. Both show evidence of heteroskedasticity; therefore, we used a generalized linear model which relaxes normality and heteroskedasticity assumptions (see McCullagh and Nelder 1989). Goodness of fit analyses were conducted to correctly specify the model, in which a gamma distribution and log link were selected. The model also used fixed effects by state to control for time invariant unmeasured factors as well as to partially adjust for the omitted variable bias in the estimation process.
Dependent Variable: Area Hospital Readmission Rates
We focus on all‐cause hospital readmission rates within 30 days of an index hospital admission of any type. The 30‐day readmission rate is defined as the percentage of patients who are readmitted within 30 days after being discharged from an index hospital stay between January and November 2009. Each hospital stay can be a new index admission, and a single patient can be counted multiple times during the course of the January through November observation period. In addition, a hospital stay may be a readmission for a prior stay and the index admission for a subsequent readmission. However, no more than one readmission is counted within the 30‐day period since the outcome measure assessed here is the percentage of patients who are readmitted.
Primary Explanatory Variable: Patients with Multiple Chronic Conditions
The primary explanatory variable in this study is the number of discharges with multiple chronic conditions as a percent of total hospital discharges of area residents. According to the conceptual framework, this variable approximates the need characteristics of the population in the community. We define patients with multiple chronic conditions using algorithms consistent with other research using HCUP‐SID data (Steiner and Friedman 2013). The study used the set of chronic conditions developed by the Department of Health and Human Services Interagency Workgroup on multiple chronic conditions and the Office of the Assistant Secretary of Health (Goodman et al. 2013). These conditions included both physical and behavioral health factors and are listed below.1 Highly related diagnoses of the same condition were grouped together using an established Clinical Classification System (CCS) (HCUP CCS 2012). The CCS categories were matched to the established set of chronic conditions. Following suggested and recently used methods (Elixhauser et al. 1998; Steiner and Friedman 2013), we use a count of chronic conditions, allowing for clusters as necessary, and use the following groups: 0–1; 2 or 3; 4 and above. The relative occurrence of multiple chronic conditions in an area is calculated as proportions of total hospital discharges in a PCSA with the following clusters of chronic conditions: 0–1 (reference); 2–3; 4 and more.
Other Covariates
The following independent variables were considered in the first regression model (Model 1, Table 3), all calculated as proportions of total population (or total discharges as proxies) in the PCSA. Three variables are used to measure predisposing characteristics of the population living in the community, contributing to population lifestyle or socio‐economic status: age, race, ethnicity, and gender. Two variables representing enabling characteristics of the population in the community are insurance status and median household income. Insurance categories were calculated as the proportions of total hospital discharges in a PCSA having the respective insurance types: private (reference), Medicare, Medicaid, uninsured, other payers. Three variables representing environment characteristics were primary care provider density, population density, and PCSAs with urban/rural residence status, retrieved from HRSA's spatial data warehouse and calculated respectively as number of primary care physicians (PCP) per 100,000 population (divided into discrete categories 0–4; 5–14; 15–57; 58+ (reference)), thousands of total population per square mile land area, and urban rural commuting area (RUCA).
The second model displays a fuller analysis including additional area‐level variables that reflect structure and processes of care in the hospital, as described in the conceptual framework (Model 2, Table 3). These additional variables, calculated from individual discharge data from HCUP (linked to AHA data) and aggregated and averaged to the PCSA level, included average bed size of the hospitals (measured by its bed size grouped into small, medium and large), average length of stay (LOS) of patients discharged from the hospitals, and average mortality rate of patients discharged from the hospitals.
Findings from the Multivariate Analysis
Table 2 shows the descriptive statistics on the independent variables by six states for which we pool data together for the multivariate analysis. The data are pooled for a total 1,261 PCSAs in these states, showing wide variations across states in socio‐economic characteristics as well as health care accessibility factors. For example, patients who had four or more chronic conditions ranged from 48 percent (Nebraska) to 65 percent (Tennessee) of total hospital discharges. States varied by geographical characteristics with PCSAs in Nebraska being mostly rural and those in California, Florida, and New York mostly urban. The average PCSA age distribution tends to be younger in California and older in Nebraska. PCSAs in Nebraska and Missouri are predominantly white, whereas Florida and California have the largest proportions of blacks and Hispanics, respectively.
Table 2.
Independent Variables (IV) for the Multivariate Analysis: Mean and Standard Errors (SE) by State, 2009
| Independent Variables (IV) | Total | CA | FL | MO | NE | NY | TN | |
|---|---|---|---|---|---|---|---|---|
| Estimate (SE) | Estimate (SE) | Estimate (SE) | Estimate (SE) | Estimate (SE) | Estimate (SE) | Estimate (SE) | ||
| Primary IV | Proportion of chronic condition discharges | |||||||
| 0–1 condition | 0.21 (0.002) | 0.25 (0.003) | 0.18 (0.004) | 0.19 (0.003) | 0.24 (0.006) | 0.22 (0.004) | 0.16 (0.003) | |
| 2–3 conditions | 0.22 (0.001) | 0.21 (0.002) | 0.20 (0.002) | 0.21 (0.003) | 0.28 (0.005) | 0.23 (0.002) | 0.19 (0.003) | |
| 4+ conditions | 0.57 (0.002) | 0.54 (0.004) | 0.61 (0.006) | 0.60 (0.005) | 0.48 (0.008) | 0.56 (0.005) | 0.65 (0.005) | |
| Geographic | Population density | 2,589 (274) | 1,839 (177) | 1,047 (130) | 190 (50) | 31 (11) | 7,799 (1,043) | 201 (36) |
| Proportion of rural/urban | ||||||||
| Urban | 0.38 (0.014) | 0.52 (0.027) | 0.56 (0.039) | 0.11 (0.022) | 0.04 (0.017) | 0.51 (0.028) | 0.21 (0.035) | |
| Suburban | 0.13 (0.010) | 0.12 (0.018) | 0.17 (0.029) | 0.14 (0.025) | 0.05 (0.021) | 0.15 (0.020) | 0.13 (0.029) | |
| Large town | 0.15 (0.010) | 0.15 (0.020) | 0.10 (0.024) | 0.14 (0.025) | 0.19 (0.037) | 0.13 (0.019) | 0.23 (0.036) | |
| Small town | 0.15 (0.010) | 0.10 (0.016) | 0.13 (0.026) | 0.23 (0.030) | 0.24 (0.040) | 0.09 (0.016) | 0.23 (0.036) | |
| Rural/isolated | 0.19 (0.011) | 0.11 (0.017) | 0.04 (0.016) | 0.37 (0.034) | 0.49 (0.047) | 0.13 (0.019) | 0.20 (0.034) | |
| Demographic | Gender | |||||||
| Proportion of male | 0.50 (0.001) | 0.51 (0.002) | 0.50 (0.003) | 0.49 (0.002) | 0.49 (0.001) | 0.49 (0.001) | 0.49 (0.002) | |
| Proportion by age (18+ years) group | ||||||||
| 18–24 years | 0.13 (0.001) | 0.14 (0.002) | 0.11 (0.002) | 0.12 (0.002) | 0.12 (0.003) | 0.13 (0.003) | 0.11 (0.002) | |
| 25–34 years | 0.17 (0.001) | 0.18 (0.002) | 0.16 (0.003) | 0.17 (0.002) | 0.13 (0.003) | 0.16 (0.002) | 0.18 (0.002) | |
| 35–44 years | 0.17 (0.001) | 0.18 (0.002) | 0.17 (0.003) | 0.16 (0.001) | 0.15 (0.002) | 0.18 (0.001) | 0.18 (0.001) | |
| 45–54 years | 0.19 (0.001) | 0.19 (0.002) | 0.17 (0.002) | 0.18 (0.001) | 0.20 (0.002) | 0.19 (0.001) | 0.18 (0.001) | |
| 55–64 years | 0.15 (0.001) | 0.15 (0.002) | 0.15 (0.002) | 0.15 (0.001) | 0.16 (0.001) | 0.15 (0.001) | 0.16 (0.001) | |
| 65–74 years | 0.10 (0.001) | 0.09 (0.001) | 0.11 (0.003) | 0.11 (0.002) | 0.11 (0.002) | 0.09 (0.001) | 0.10 (0.001) | |
| 75–84 years | 0.07 (0.001) | 0.06 (0.001) | 0.08 (0.003) | 0.07 (0.001) | 0.09 (0.002) | 0.06 (0.009) | 0.06 (0.001) | |
| 85+ years | 0.03 (0.000) | 0.02 (0.000) | 0.03 (0.002) | 0.03 (0.009) | 0.05 (0.002) | 0.03 (0.001) | 0.02 (0.001) | |
| Ethnicity | ||||||||
| Proportion Hispanic | 0.14 (0.005) | 0.33 (0.013) | 0.15 (0.012) | 0.02 (0.003) | 0.05 (0.007) | 0.10 (0.008) | 0.02 (0.002) | |
| Proportion by race | ||||||||
| White | 0.80 (0.006) | 0.65 (0.010) | 0.78 (0.011) | 0.93 (0.007) | 0.94 (0.008) | 0.81 (0.013) | 0.88 (0.013) | |
| Black | 0.06 (0.003) | 0.04 (0.003) | 0.14 (0.009) | 0.04 (0.007) | 0.01 (0.001) | 0.08 (0.008) | 0.09 (0.012) | |
| Other | 0.13 (0.004) | 0.31 (0.009) | 0.09 (0.005) | 0.04 (0.002) | 0.06 (0.008) | 0.11 (0.007) | 0.03 (0.001) | |
| Median income ($US), 2008 | 49,766 (521) | 58,200 (1,122) | 47,099 (1,095) | 39,729 (655) | 42,560 (569) | 56,069 (1,237) | 39,115 (830) | |
| Accessibility | PCP per 100,000 | 55 (2.9) | 84 (7.3) | 83 (9.8) | 21 (3.8) | 11 (4.1) | 56 (5.1) | 33 (5.0) |
| Area proportions of PCPs, 2007 | ||||||||
| 0–4 per 100,000 | 0.23 (0.012) | 0.14 (0.019) | 0.10 (0.024) | 0.42 (0.035) | 0.59 (0.046) | 0.18 (0.022) | 0.13 (0.029) | |
| 5–14 per 100,000 | 0.25 (0.012) | 0.20 (0.022) | 0.17 (0.029) | 0.32 (0.033) | 0.31 (0.043) | 0.21 (0.023) | 0.39 (0.042) | |
| 15–57 per 100,000 | 0.26 (0.012) | 0.23 (0.023) | 0.30 (0.036) | 0.18 (0.027) | 0.07 (0.024) | 0.35 (0.027) | 0.33 (0.040) | |
| 58+ per 100,000 | 0.26 (0.012) | 0.42 (0.027) | 0.42 (0.039) | 0.08 (0.019) | 0.03 (0.015) | 0.26 (0.025) | 0.15 (0.030) | |
| Proportion of discharges by insurance type | ||||||||
| Private | 0.28 (0.088) | 0.31 (0.091) | 0.24 (0.061) | 0.23 (0.080) | 0.13 (0.067) | 0.32 (0.081) | 0.23 (0.066) | |
| Medicare | 0.50 (0.003) | 0.44 (0.005) | 0.52 (0.007) | 0.55 (0.006) | 0.58 (0.008) | 0.46 (0.004) | 0.56 (0.006) | |
| Medicaid | 0.14 (0.002) | 0.17 (0.004) | 0.13 (0.004) | 0.15 (0.004) | 0.08 (0.003) | 0.15 (0.005) | 0.13 (0.003) | |
| Uninsured | 0.04 (0.001) | 0.03 (0.001) | 0.07 (0.002) | 0.05 (0.002) | 0.01 (0.001) | 0.04 (0.001) | 0.06 (0.001) | |
| Other | 0.03 (0.010) | 0.05 (0.002) | 0.04 (0.003) | 0.03 (0.002) | 0.01 (0.002) | 0.03 (0.002) | 0.02 (0.001) | |
| Hospital | Hospital mortality | 0.02 (0.000) | 0.03 (0.000) | 0.02 (0.000) | 0.02 (0.000) | 0.02 (0.001) | 0.03 (0.000) | 0.03 (0.001) |
| Length of stay (days) | 4.76 (0.023) | 4.70 (0.054) | 4.62 (0.030) | 4.57 (0.041) | 4.03 (0.043) | 5.35 (0.040) | 4.64 (0.037) | |
| Proportion of area hospital size | ||||||||
| Large | 0.60 (0.008) | 0.55 (0.014) | 0.66 (0.022) | 0.62 (0.019) | 0.48 (0.023) | 0.61 (0.015) | 0.64 (0.022) | |
| Medium | 0.24 (0.007) | 0.29 (0.014) | 0.25 (0.021) | 0.18 (0.015) | 0.15 (0.015) | 0.26 (0.014) | 0.23 (0.019) | |
| Small | 0.16 (0.006) | 0.16 (0.010) | 0.09 (0.014) | 0.20 (0.015) | 0.37 (0.021) | 0.13 (0.012) | 0.13 (0.013) | |
The statistics in this table present mean and standard errors of independent variables calculated across the primary care service areas (PCSAs) of each state and the total of all states. The number of observations (PCSAs) equals 1,261 for all states together, representing the sample frame of this study.
Source: Healthcare Cost and Utilization Project State Inpatient database, 2009; Health Resources and Services Administration, Spatial data warehouse (http://datawarehouse.hrsa.gov/).
Table 3 shows the results from the multivariate regression models, where both Models 1 and 2 are presented. Controlling for covariates, readmission rates are significantly greater in areas with a higher prevalence of multiple chronic condition discharges in Model 1. The readmission rates are significantly higher in PCSAs having higher proportions of patients with 2–3 chronic conditions (coefficient = 0.44, p < .05), as well as those with 4+ chronic conditions (coefficient = 0.25, p < .05), compared to the areas with a higher concentration of patients with 0–1 chronic conditions (the reference group). Readmission rates are also greater in areas with higher prevalence of Medicare and Medicaid beneficiary discharges, higher proportion of female population and by certain population age groups. Readmission rates, on the other hand, are lower in areas with higher proportion of male populations and 65–74 year olds (relative to 18–34), lower PCP capacity, and small towns. State‐specific fixed effects report readmission rates to be higher in FL, MO, NE, and NY compared to CA. Model 2 confirms our earlier findings of a positive association between readmission rates and chronic condition intensity of the area. Controlling for covariates, readmission rates were significantly higher in PCSAs having higher proportions of patients with 2–3 chronic conditions (coefficient = 0.43, p < .05), as well as those with 4+ chronic conditions (coefficient = 0.27, p < .05), compared to the areas with a higher concentration of patients with 0–1 chronic conditions. These coefficients were comparable in size relative to the corresponding ones in Model 1 and continue to be significant, indicating a positive association between area readmission rates and area chronicity levels.
Readmissions were also greater in areas with higher prevalence of Medicare and Medicaid beneficiary discharges, female population, certain population age groups, and higher hospital mortality rates, as well as a higher proportion of small hospitals. Neither area's racial ethnic composition nor percentage of uninsured patients was significant in either model.
Discussion
This is the first study that uses small area analysis to show that the prevalence of multiple chronic conditions in an area is associated with increasing hospital readmission rates and thereby health care utilization and costs. The finding highlights the importance of multiple comorbidities and patient needs in explaining spatial variations in readmission rates. The analysis, conducted in two models, confirms that the findings were robust not only to the inclusion of various area‐level variables reflecting patient demographics, environment, and resource availabilities, but also to the hospital‐specific factors driving area readmissions.
Among other major findings also of interest, a noteworthy one is the significant positive associations between the supply of primary care physicians and readmission rates, contrary to expectations and earlier evidence (Hernandez et al. 2010; Sharma et al. 2010). Further tests to assess whether primary care could reduce readmissions among patients having fewer chronic conditions produced no reportable findings. The issue needs further investigation since primary care could play important role in care transitions and care coordination. National data on Medicare beneficiaries reveal striking variations and low primary care visit rates across hospital regions (Goodman 2013).
Findings pertaining to patient characteristics of the area show areas with higher percent of Medicare, Medicaid, and older (75–84) patients to have higher readmission rates. Interestingly, lower readmission rates were found in areas with higher concentration of 65–74 than 18–34 adults, possibly indicating a combination of factors such as lifestyle, health status, health insurance, social support, and access to care. Among hospital characteristics, we found no association between PCSA readmission rates and its mean LOS. The finding is consistent with previous research by Kaboli et al. (2012) and Capelastegui et al. (2008). Area average hospital mortality rate was positively associated with readmission rates, possibly confounding the effect of LOS as both should increase with higher severity (Ashton and Wray 1996). Consistent with Joynt and Jha (2011), areas with concentration of smaller hospitals had higher readmissions.
The study is policy relevant in the context of the Affordable Care Act (ACA) as it provides a framework to predict the extent to which improved access to care for chronically ill patients may potentially reduce the risks of area readmissions. These findings suggest that policies to target areas with more chronically ill patients may have greater benefits in terms of improved outcomes and reduced costs. Emerging evidence indicates that identification and care management of high‐risk, complex patients in primary care can yield cost savings, lower mortality, better outcomes, and improved patient experience (Friedberg et al. 2014). In addition to confirming the need to focus on the high‐risk patients, the study's findings corroborate recent work (Herrin et al. 2015) that highlight the importance of community factors in addressing hospital readmissions.
The study has several limitations, including its inability to account for the postdischarge care coordination and transitional care, which could not be directly measured. We expect the state fixed effects models to capture some of these state‐specific factors. The role of primary care clinicians and care teams needs to be better addressed. Only selected hospital characteristics could be considered that directly or indirectly related to hospital quality. The threshold definition of multiple chronic conditions (2 and above), while consistent with recent work, needs to be revisited. Better data to measure prevalence of multiple chronic illnesses across small areas will augment the analysis. Finally, since the data used in this study is from 2009, study results need to be updated with more recent data to capture the trends in the post‐ACA period.
Conclusion
Persons with multiple chronic conditions represent approximately 30 percent of the U.S. population and over 70 percent of health care expenditures. Using hospital discharge data from six U.S. states, we found readmissions to be greater in PCSAs with a higher proportion of patients with multiple chronic conditions. The results from this study emphasize the importance of using multiple methods, such as small area analysis, to inform health policy, improve care transitions, and empower primary care teams to enhance care management and seek to reduce hospital readmissions.
Supporting information
Appendix SA1: Author Matrix.
Acknowledgments
Joint Acknowledgment/Disclosure Statement: This research is funded wholly by the authors’ employer, the Agency for Healthcare Research and Quality (AHRQ). The views expressed in this paper are those of the authors. No official endorsement by any agency of the federal government is intended or should be inferred. The authors acknowledge the state data organizations that participate in the HCUP State Inpatient Databases in California, Florida, New York, Tennessee, Missouri, and Nevada. The authors also acknowledge the data and programming support provided by Social and Scientific Systems, Inc. in Maryland.
Disclosures: None.
Disclaimers: None.
Note
These conditions included hypertension; hyperlipidemia; congestive heart failure; coronary artery disease; diabetes; stroke; cardiac arrhythmias; arthritis; cancer; depression; dementia; substance abuse disorders; COPD; asthma; chronic kidney disease; autism spectrum disorder; schizophrenia; and osteoporosis.
References
- Aday, L. A. , Begley C. E., Lairson D. R., and Slater C. H.. 1998. Evaluating the Healthcare System: Effectiveness, Efficiency, and Equity. Chicago, IL: Health Administration Press. [Google Scholar]
- AHRQ . 2004. Agency for Healthcare Research and Quality: Healthcare Cost and Utilization Project (HCUP). Rockville, MD: AHRQ; [accessed on April 1, 2015]. Available at http://www.hcup-us.ahrq.gov/db/state/siddbdocumentation.jsp [PubMed] [Google Scholar]
- Andersen, R. M. 1995. “Revisiting the Behavioral Model and Access to Medical Care: Does it Matter?” Journal of Health and Social Behavior 36 (March): 1–10. [PubMed] [Google Scholar]
- Ashton, C. M. , and Wray N. P.. 1996. “A Conceptual Framework for the Study of Early Readmission as an Indicator of Quality of Care.” Social Science and Medicine 43 (11): 1533–41. [DOI] [PubMed] [Google Scholar]
- Capelastegui, A. , España P. P., Quintana J. M., Gallarreta M., Gorordo I., Esteban C., Urrutia I., and Bilbao A.. 2008. “Declining Length of Hospital Stay for Pneumonia and Postdischarge Outcomes.” American Journal of Medicine 121 (10): 845–52. [DOI] [PubMed] [Google Scholar]
- Dartmouth Atlas . 2013. Project & Lake Research Group. Revolving Door: A Report on US Hospital Readmissions. Robert Wood Johnson Foundation; [accessed on August 1, 2014]. Available at http://www.dartmouthatlas.org/pages/readmissions2013 [Google Scholar]
- Elixhauser, A. , Steiner C., Harris D. R., and Coffey R. M.. 1998. “Comorbidity Measures for Use with Administrative Data.” Medical Care 36 (1): 8–27. [DOI] [PubMed] [Google Scholar]
- Friedberg, M. W. , Schneider E. C., Rosenthal M. B., Volpp K. G., and Werner R. M.. 2014. “Association between Participation in a Multipayer Medical Home Intervention and Changes in Quality, Utilization, and Costs of Care.” Journal of the American Medical Association 311 (8): 815–25. [DOI] [PMC free article] [PubMed] [Google Scholar]
- Friedman, B. , and Basu J.. 2004. “The Rate and Cost of Hospital Readmissions for Preventable Conditions.” Medical Care Research and Review 61 (2): 225–40. [DOI] [PubMed] [Google Scholar]
- Friedman, B. , Jiang H. J., and Elixhauser A.. 2006. “Segal A Hospital Inpatient Costs for Adults with Multiple Chronic Conditions.” Medical Care Research and Review: MCRR 63 (3): 327–46. [DOI] [PubMed] [Google Scholar]
- Friedman, B. Jiang H. J. Elixhauser A.. 2008. “Costly Hospital Readmissions and Complex Chronic Conditions.” Inquiry 45 (4): 408–21. [DOI] [PubMed] [Google Scholar]
- Goodman, D. C. 2013, February 27. Beyond Reducing Hospital Readmissions: The Thirty‐First Day, Invited Testimony. Hearing on Strengthening Medicare for Today and the Future, The United States Senate Special Committee on Aging. [Google Scholar]
- Goodman, D. C. , Fisher E. S., Chang C., and the Dartmouth Atlas of Health Care . 2011. After Hospitalization: A Dartmouth Atlas Report on Post‐Acute Care for Medicare Beneficiaries. Hanover, NH: Dartmouth College. [PubMed] [Google Scholar]
- Goodman, D. C. , Mick S. S., Bott D., Stukel T., Chang C., Marth N., Poage J., and Carretta H. J.. 2003. “Primary Care Service Areas: A New Tool for the Evaluation of Primary Care Services.” Health Services Research 38 (1): 287–310. [DOI] [PMC free article] [PubMed] [Google Scholar]
- Goodman, R. A. , Posner S. F., Huang E. S., Parekh A. K., and Koh H. K.. 2013. “Defining and Measuring Chronic Conditions: Imperatives for Research, Policy, Program and Practice.” Preventing Chronic Disease 10: 120239. [DOI] [PMC free article] [PubMed] [Google Scholar]
- HCUP CCS . 2012. Healthcare Cost and Utilization Project (HCUP). Rockville, MD: Agency for Healthcare Research and Quality; [accessed February 27, 2013]. Available at http://www.hcup-us.ahrq.gov/toolssoftware/ccs/ccs.jsp [Google Scholar]
- Hernandez, A. F. , Greiner M. A., Fonarow G. C., Hammill B. G., Heidenreich P. A., Yancy C. W., Peterson E. D., and Curtis L. H.. 2010. “Relationship between Early Physician Follow‐Up and 30‐Day Readmission among Medicare Beneficiaries Hospitalized for Heart Failure.” Journal of the American Medical Association 303 (17): 1716–22. [DOI] [PubMed] [Google Scholar]
- Herrin, J. , StAndre J., Kenward K., Joshi M. S., Audet A.‐M. J., and Hines S. C.. 2015. “Community Factors and Hospital Readmission Rates.” Health Services Research 50(1): 20–39. [DOI] [PMC free article] [PubMed] [Google Scholar]
- Hubbard, M. , Frost S., Siu K., Quon N., and Esposito D.. 2014. “Association between Outpatient Visits Following Hospital Discharge and Readmissions among Medicare Beneficiaries with a Trial Fibrillation and Other Chronic Conditions.” American Journal of Medical Quality 29 (3): 206–12. [DOI] [PubMed] [Google Scholar]
- Jencks, S. F. , Williams M. V., and Coleman E. A.. 2009. “Rehospitalizations among Patients in the Medicare Fee‐for‐Service Program.” New England Journal of Medicine 360: 1418–28. [DOI] [PubMed] [Google Scholar]
- Jiang, J. , Stryer D., Friedman B., and Andrews R.. 2003. “Multiple Hospitalizations for Patients with Diabetes Mellitus.” Diabetes Care 26 (5): 1421–6. [DOI] [PubMed] [Google Scholar]
- Joynt, K. , and Jha A. K.. 2011. “Who Has Higher Readmission Rates for Heart Failure, and Why? Implications for Efforts to Improve Care Using Financial Incentives.” Circulation: Cardiovascular Quality and Outcomes 4: 53–9. [DOI] [PMC free article] [PubMed] [Google Scholar]
- Kaboli, P. J. , Go J. T., Hockenberry J., Glasgow J. M., Johnson S. R., Rosenthal G. E., Jones M. P., and Vaughan‐Sarrazin M.. 2012. “Associations between Reduced Hospital Length of Stay and 30‐Day Readmission Rate and Mortality: 14‐Year Experience in 129 Veterans Affairs Hospitals.” Annals of Internal Medicine 157 (12): 837–45. [DOI] [PubMed] [Google Scholar]
- McCarthy, D. , Johnson M., and Audet A.‐M.. 2013. “Recasting Readmissions by Placing the Hospital Role in Community Context.” Journal of the American Medical Association 309 (4): 351–2. [DOI] [PubMed] [Google Scholar]
- McCullagh, P. , and Nelder J.. 1989. Generalized Linear Models, 2nd Edition Boca Raton, FL: Chapman and Hall/CRC. [Google Scholar]
- Sharma, G. , Kuo Y. F., Freeman J. L., Zhang D. D., and Goodwin J. S.. 2010. “Outpatient Follow‐Up Visit and 30‐Day Emergency Department Visit and Readmission in Patients Hospitalized for Chronic Obstructive Pulmonary Disease.” Archives of Internal Medicine 170 (18): 1664–70. [DOI] [PMC free article] [PubMed] [Google Scholar]
- Steiner, C. A. , and Friedman B.. 2013. “Hospital Utilization, Costs, and Mortality for Adults with Multiple Chronic Conditions, Nationwide Inpatient Sample, 2009.” Preventing Chronic Disease 10: 120292. doi:10.5888/pcd10.120292. [DOI] [PMC free article] [PubMed] [Google Scholar]
- Vest, J. R. , Gamm L. D., Oxford B. A., Gonzalez M. I., and Slawson K. M.. 2010. “Determinants of Preventable Readmissions in the United States: A Systematic Review.” Implementation Science 5: 88. [DOI] [PMC free article] [PubMed] [Google Scholar]
- Weissman, J. S. , Ayanian J. Z., Chasan‐Taber S., Sherwood M. J., Roth C., and Epstein A. M.. 1999. “Hospital Re‐Admissions and Quality of Care.” Medical Care 37: 490–501. [DOI] [PubMed] [Google Scholar]
Associated Data
This section collects any data citations, data availability statements, or supplementary materials included in this article.
Supplementary Materials
Appendix SA1: Author Matrix.