

Abstract
The majority of hepatocellular carcinoma (HCC) develops in the background of chronic liver inflammation caused by viral hepatitis and alcoholic or non-alcoholic steatohepatitis. However, the impact of different types of chronic inflammatory microenvironments on the phenotypes of tumors generated by distinct oncogenes is largely unresolved. To address this issue, we generated murine liver tumors by constitutively active AKT-1 (AKT) and β-catenin (CAT) followed by induction of chronic liver inflammation by 3,5-diethoxycarbonyl-1,4-dihydrocollidine (DDC) and carbon tetrachloride (CCl4). Also, the impact of DDC-induced chronic liver inflammation was compared between two liver tumor models using a combination of AKT-CAT or AKT-NRASG12V. Treatment with DDC and CCl4 significantly facilitated the adenoma-to-carcinoma conversion and accelerated the growth of AKT-CAT tumors. Furthermore, DDC treatment altered the morphology of AKT-CAT tumors and caused loss of lipid droplets. Transcriptome analysis of AKT-CAT tumors revealed that cellular growth and proliferation was mainly affected by chronic inflammation and caused upregulated of Cxcl16, Galectin-3 and Nedd9 among others. Integration with transcriptome profiles from human HCCs further demonstrated that AKT-CAT tumors generated in the context of chronic liver inflammation showed enrichment of poor prognosis gene sets or decrease of good prognosis gene sets. In contrast, DDC had a more subtle effect on AKT-NRASG12V tumors and primarily enhanced already existent tumor characteristics as supported by transcriptome analysis. However, it also reduced lipid droplets in AKT-NRASG12V tumors.
Conclusion
Our study suggests that liver tumor phenotype is defined by a combination of driving oncogenes but also the nature of chronic liver inflammation.
Keywords: hepatocellular carcinoma, chronic inflammation, tumor immunology, tumor microenvironment, cirrhosis
INTRODUCTION
Research on hepatocellular carcinoma (HCC) has focused predominantly on the understanding of genetic and epigenetic alterations responsible for driving the neoplastic process in the liver. Over the last years, key alterations in HCC tumors have been identified and utilized to predict patient survival and to provide possible therapeutic targets(1). However, accumulating evidence suggests that tumor phenotype is dictated not only by genetic and epigenetic alterations in the tumor cells per se, but also influenced by molecular cross-talk between tumor cells and the surrounding microenvironment(2). This concept is particularly relevant for liver cancer where the majority of HCCs (up to 90%) develop in the background of chronic liver inflammation caused by hepatitis B or C virus, alcoholic steatohepatitis (ASH) or non-alcoholic steatohepatitis (NASH)(3). Although the recognition that the hepatic microenvironment contributes to tumor phenotype is generally accepted, the extent to which it affects HCC phenotype, including biology, remains unresolved. A direct comparison between HCC’s developing in non-cirrhotic liver and cirrhotic liver could give some insight into the role of chronic inflammation. However, the results are difficult to interpret, because compared tumors would need to have the same molecular features, such as identical mutations, which is an almost impossible requirement to meet in a clinical setting(4).
Therefore, we genetically engineered liver tumors using different combinations of oncogenes with two inflammation-promoting regiments. This approach allowed us to address the impact of (i) the different microenvironment on the same tumor type, and (ii) the same microenvironment on different tumor types. To initiate liver tumors, we employed oncogenes known to be frequently activated in HCC: β-catenin (CAT), NRASG12V and AKT1 (AKT)(1). Chronic liver inflammation was induced by feeding mice with 3,5-diethoxycarbonyl-1,4-dihydrocollidine (DDC), a non-genotoxic hepatotoxin causing portal inflammation and fibrosis(5). As a second inflammatory model, we used chronic administration of carbon tetrachloride (CCl4) resulting in centrilobular liver damage with accompanying inflammation and fibrosis(6).
Our results provide evidence that chronic inflammation driven by DDC diet or exposure to CCl4 had a profound impact on liver tumor phenotype. Both inflammation-promoting regiments increased tumor growth, accelerated malignant conversion, and caused inflammation-specific changes in tumor transcriptome of AKT-CAT tumors. DDC-mediated inflammation also influenced biology of AKT-NRASG12V driven hepatocarcinogenesis, albeit to a lesser degree as compared to AKT-CAT tumors. We conclude that the outcome of liver cancer development is dependent on the cooperation between initiating oncogenes and the nature of inflammation.
RESULTS
DDC and CCl4 exposure caused chronic liver inflammation
Liver tumors were engineered by myristoylated and therefore activated AKT1 (named AKT) and activated truncated β-catenin (named CAT), introduced into mouse hepatocytes by hydrodynamic tail vein injection(7). Three days after injection, mice were exposed to DDC diet (AKT-CAT+DDC group) or kept on standard chow (AKT-CAT group). DDC diet was tolerated well by all mice and caused typical liver pathology, which included progressive protoporphyria with pigment deposition, formation of Mallory-Denk bodies, and hepatomegaly (data not shown)(5). In addition, DDC affected the portal area where it caused a pronounced ductular reaction of biliary cells and a chronic inflammation containing CD3+ T cells and Ly6.G+ neutrophils (Fig. 1). Mice under continuous DDC treatment developed moderate fibrosis in the portal tract with few portal-to-portal septa, which started to form after four to six weeks of diet onset and gave a nodular appearance (Fig. 1, Sirius red stain). Alternatively, chronic inflammation was induced by CCl4 administration. Three days after hydrodynamic injection of AKT-CAT plasmids, mice received the first intraperitoneal injection of CCl4, which was continued thereafter twice a week (AKT-CAT+CCl4 group). Chronic exposure to CCl4 caused centrilobular and portal inflammation, which consisted mainly of Ly6.G+ neutrophil granulocytes and CD3+ T lymphocytes (Fig. 1). Continuous CCl4 administration provoked mild to moderate fibrosis around central veins with few central-to-central septa (Fig. 1, Sirius red stain) starting after 4–6 weeks of treatment onset. No tumor nodules were found 4–6 weeks after hydrodynamic injection and typical DDC or CCl4 liver pathology was independent from stable AKT-CAT expression.
Figure 1.
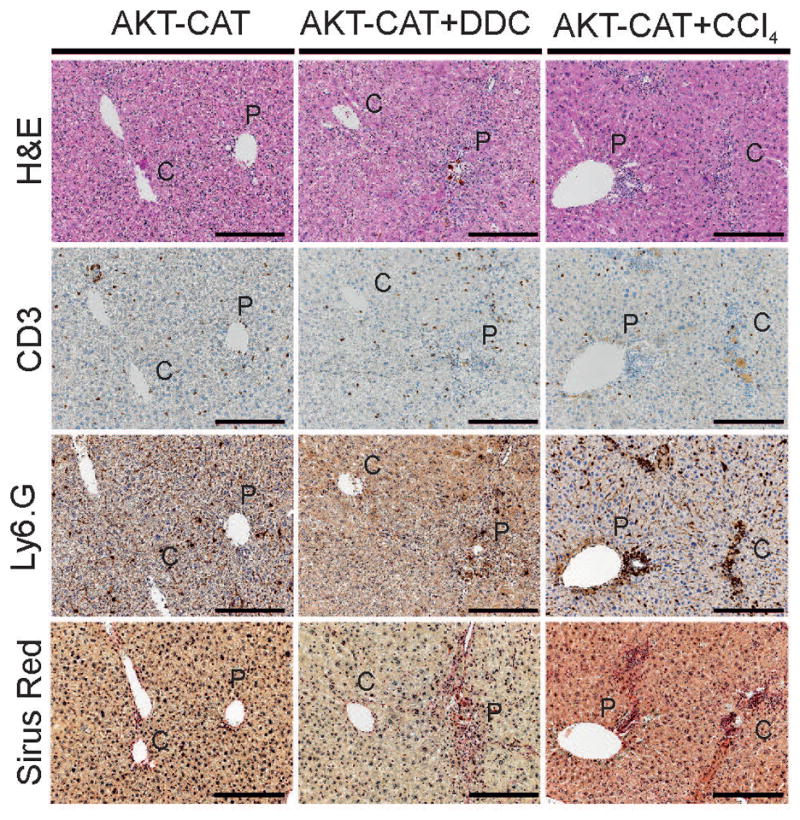
Chronic liver inflammation caused by DDC and CCl4 treatment. Three days after hydrodynamic injection of AKT-CAT plasmids, mice remained on standard chow (AKT-CAT), were subjected to DDC diet (AKT-CAT+DDC), or treated with intraperitoneal CCl4 administration (AKT-CAT+CCl4). H&E, immunohistochemistry for CD3, and Ly6.G, and Sirius red after at least 6 weeks of DDC or CCl4 treatment. For all pictures one representative image shown from each group (4 – 9 mice/group). Bar=100μm. P: portal tract; C: central vein.
Chronic inflammation induced by DDC and CCl4 enhanced growth of AKT-CAT tumors
On average, 17.9 ± 3.4 weeks after hydrodynamic injection, AKT-CAT mice developed ascites due to excessive liver tumor growth or showed palpable liver nodules and had to be sacrificed. Macroscopic analysis revealed numerous liver tumor nodules in AKT-CAT mice (n=8) (Fig. 2A). DDC treatment considerably accelerated tumor growth, and AKT-CAT+DDC mice (n=7) had to be sacrificed at 11.0 ± 2.8 weeks after hydrodynamic injection (Fig. 2A). By this time, AKT-CAT+DDC tumors reached up to 5 mm in diameter, whereas maximal diameter of the age-matched AKT-CAT tumors was less than 1 mm (Fig. 2A). Similarly, growth of AKT-CAT tumors was enhanced in the inflammatory environment generated by CCl4. AKT-CAT+CCl4 mice had to be sacrificed 13.6 ±0.8 weeks (n=4) after hydrodynamic injection, when liver tumor nodules were up to 4 mm in diameter (Fig. 2A).
Figure 2.

AKT-CAT tumors generated in the background of chronic liver inflammation. A) Representative macroscopic liver pictures containing AKT-CAT, AKT-CAT+DDC or AKT-CAT+CCl4 tumors in weeks after hydrodynamic injection. Bar=1cm. 4 – 9 mice/group. Arrow: tumor nodule. B) Histogram with number of liver tumor nodules with a diameter of > 2mm and visible from the outside at the time of sacrifice. Mean and SEM from 4 – 9 mice/group. C) AKT-CAT, AKT-CAT+DDC, and AKT-CAT+CCl4 tumors analyzed for β-catenin and p-AKT by immunohistochemistry. Bar=50μm. D) Total copy number of pT3 plasmid/DNA in AKT-CAT, AKT-CAT+DDC and AKT-CAT+CCl4 tumors. Mean and SEM of 6 samples/group. One representative image shown from each group.
Interestingly, in AKT-CAT+DDC mice, there were fewer tumors but they were larger as compared to that in AKT-CAT and AKT-CAT+CCl4 mice (Fig. 2B). This suggests that DDC interfered with tumor initiation while promoting growth of the established tumors. Of note, control mice maintained on DDC diet (n=7) for 26 weeks did not develop any neoplastic lesions. Similarly, mice treated continuously with CCl4 (n=8) for 20 weeks did not generate tumors. In addition, no tumor development was detected after injection of AKT or CAT alone to either untreated mice (n=6 for each oncogene, 26 weeks of observation) or DDC-treated mice (n=3 mice/group, 12 weeks of observation).
Immunohistochemistry for β-catenin showed a strong nuclear staining with a similar intensity in all three types of AKT-CAT tumors (Fig. 2C). Likewise, the staining intensity for the second oncogene, activated AKT (pAKT473), was also comparable in all AKT-CAT tumors albeit it was considerably weaker (Fig. 2C). This confirmed a similar expression of both oncogenes in all three different AKT-CAT tumor models. To exclude that DDC diet or CCl4 exposure changed the distribution or type of in vivo transfected liver cells, we performed hydrodynamic injection with a GFP-positive plasmid followed by the treatment with DDC or CCl4 for 7 and 12 days. Consistently, only hepatocytes showed GFP signals, regardless of treatment (Supplementary Fig. 1). GFP-expressing hepatocytes were primarily located in the central and pericentral areas (zone 1 and 2) of the hepatic lobule. Cholangiocytes and progenitor cells did not display GFP-positivity, and therefore, as shown before, were not transfected after hydrodynamic injection(8). There were no quantitative differences in the GFP expression between untreated and DDC treated mice on day 7 and 12 after hydrodynamic injection. Mice treated with CCl4 showed a slight reduction in the number of GFP-positive hepatocytes most likely due to the pericentral necrosis, caused by the first CCl4 injection(6). Furthermore, we compared the integrated AKT plasmid copy number in AKT-CAT, AKT-CAT+DDC and AKT-CAT+CCl4 tumors. Quantitative PCR showed that integrated AKT plasmid copy number was very similar in all three tumor groups (Fig. 2D). Further, liver cell lines (SNU-449 and PLC/PRF/5) treated with DDC did not show changes in proliferation rate (Supplementary Fig. 2). Altogether, these results indicate that the inflammatory microenvironment, rather than increased plasmid integration, change in cell type transfected or direct effect of DDC on hepatocytes was responsible for the promotion of tumor growth.
Change of tumor phenotype in the background of chronic liver inflammation
We next performed a more detailed histopathological assessment of tumor lesions according to a recent consensus report on murine liver tumor classification, which differs from human liver tumor classification(9). Three types of AKT-CAT driven liver tumors were recognized: hepatocellular adenoma (HCA), mixed hepatocellular adenoma-carcinoma (HCA-HCC), and hepatoblastoma (HB). A mixed HCA-HCC was diagnosed if at least 5% of the HCA was composed of a HCC. In contrast to human liver tumors, a focus of a HCC within a HCA is a common feature in murine liver tumors and thought to reflect the conversion of a HCA to a more malignant HCC phenotype(9, 10). The predominant tumor type in all three groups was either a HCA or a mixed HCA-HCC (Fig. 3A). Pure HCC was not detected, and no metastasis was found in any of the tumor groups. Chronic inflammation increased the frequency of liver tumors with a mixed phenotype from 19% in untreated mice to 46% and 27%, in DDC and CCl4 treated mice, respectively (Fig. 3A). Chronic inflammation also caused a marked expansion of the HCC component within the mixed HCA-HCCs. In AKT-CAT mice, the percentage of mixed HCA-HCC ranged between 5–25%, whereas it was 5–50% and 5–60% in AKT-CAT+DDC and AKT-CAT+CCl4 mice, respectively. Thus, chronic inflammation promoted the progression of murine hepatocellular adenoma into hepatocellular carcinoma. In addition, a minority of tumors was classified as HBs. The HBs were found only in AKT-CAT and AKT-CAT+DDC mice without any difference in morphology. Therefore, for adequate comparison between all three AKT-CAT tumor groups, further analyses were performed only on hepatocellular tumors (HCA and mixed HCA-HCC).
Figure 3.

Histological analysis of AKT-CAT tumors generated in the background of chronic liver inflammation. A) Distribution of HCA and mixed HCA-HCC (with percentage) within total number of hepatocellular tumors. B) H&E and Oil-red O of AKT-CAT, AKT-CAT+DDC and AKT-CAT+CCl4 tumors. Bar=50μm. One representative picture of 4 – 9 mice/group. T: tumoral tissue, NT: non-tumoral tissue.
In accordance with earlier observations(7), most AKT-CAT tumors (84.1% ± 9.7%) were steatotic and contained lipid droplets as confirmed by Oil-red O staining (Fig. 3B). Tumors were defined as steatotic if > 50% of the tumor cells showed lipid droplets. In contrast, none of the AKT-CAT+DDC tumors were steatotic, but 69.8% ± 10.3% of the AKT-CAT+CCl4 tumors were steatotic (Fig. 3B; H&E and Oil-red-O). In contrast, the number of tumor infiltrating CD3+ T cells was similar in all AKT-CAT tumors and only a few single intratumoral Ly6.G+ neutrophils could be found (Supplementary Figure 3).
Change of tumor transcriptome in the background of chronic liver inflammation
We performed transcriptome analysis of the AKT-CAT tumors developed with an inflammatory microenvironment modified by either DDC diet or CCl4 exposure. All tumors selected for microarray analysis had a similar size (3.0–3.4 mm in diameter) and were examined by histology to ensure that only hepatocellular tumors were included. Analysis was performed with four mice per experimental group and RNA was pooled after isolation from 3–4 tumor nodules from each mouse. Unsupervised hierarchical clustering (average linkage) of all detected genes (n=9037) clearly subdivided tumoral and non-tumoral tissue into distinct clusters according to the experimental groups (Fig. 4A and Supplementary Fig. 4). This confirmed that background inflammation induced drastic changes of the tumor transcriptome. Next, we identified genes differentially expressed in each tumor group in comparison to normal untreated liver. A total of 336 genes were differently expressed in AKT-CAT tumors, 630 genes in AKT-CAT+DDC tumors and 572 genes in AKT-CAT+CCl4 tumors (Supplementary Table 1–3). To characterize the pathways most affected by DDC and CCl4 treatment, we used Ingenuity Pathway Analysis (IPA). In each group we identified the top five pathways associated with disease and function and searched for the differences between the tumor groups. “Cell death and survival” and “Cancer” were shared among all AKT-CAT tumors (Table 1), however p-values were higher in DDC and CCl4 treated tumors. “Cellular growth and proliferation” exemplified the AKT-CAT+DDC and AKT-CAT+CCl4 tumors, while in AKT-CAT tumors this function was ranked only on the 17th place. Accordingly, cell proliferation as measured by Ki-67 confirmed that tumor growth rate was considerably higher in AKT-CAT+DDC and AKT-CAT+CCl4 tumors compared to AKT-CAT tumors (Fig. 4B). The remaining most affected pathways were unique for each group (see Table 1). Thus, the background inflammation had a strong impact on pathway activation in each AKT-CAT tumor group.
Figure 4.
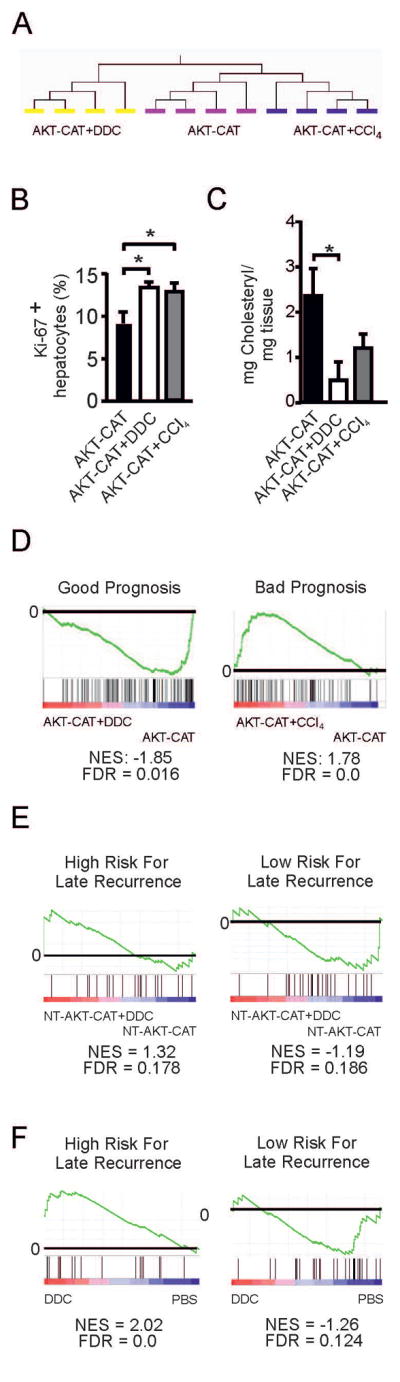
Transcriptome of AKT-CAT tumors generated in the background of chronic liver inflammation. A) Unsupervised hierarchical clustering of gene expression profiles from AKT-CAT, AKT-CAT+DDC and AKT-CAT+CCl4 tumors. B) Percentage of proliferating Ki-67 positive hepatocytes within total hepatocytes, measured by immunohistochemistry. Mean and SEM from 7 – 8 tumors/group. C) Cholesteryl ester concentration in AKT-CAT and AKT-CAT+DDC tumors. Mean and SEM of 4 tumor samples/group. D) GSEA of AKT-CAT and AKT-CAT+DDC tumors using a gene set with good prognosis (left) and of AKT-CAT and AKT-CAT+CCl4 tumors using a gene set with bad prognosis (right). E, F) GSEA of non-tumoral tissue of AKT-CAT and AKT-CAT+DDC mice (E) or mice treated with DDC only (F) using gene sets with low and high risk of late recurrence.
Table 1.
Most significant diseases and function affected in AKT-CAT, AKT-CAT+DDC, and AKT-CAT+CCl4 tumors
| Tumor group | p-Value |
|---|---|
| Shared by all tumor groups | |
| AKT-CAT | |
| Cell Death and Survival | 6.68E-07-1.33E-02 |
| Cancer | 2.32E-06-1.34E-02 |
| AKT-CAT+DDC | |
| Cell Death and Survival | 5.2E-14-2.29E-03 |
| Cancer | 6.03E-11-2.46E-03 |
| AKT-CAT+CCl4 | |
| Cell Death and Survival | 1.82E-09-1.04E-02 |
| Cancer | 2.33E-06-1.05E-02 |
| Shared by AKT-CAT+DDC and AKT-CAT+CCl4 | |
| AKT-CAT+DDC | |
| Cellular Growth and Proliferation | 1.75E-13-2.23E-03 |
| AKT-CAT+CCl4 | |
| Cellular Growth and Proliferation | 5.12E-10-1.06E-02 |
| Unique in each tumor group | |
| AKT-CAT | |
| Cell Signaling | 6.7E-07-3.53E-03 |
| Tumor Morphology | 2.32E-06-1.33E-02 |
| Organismal Injury and Abnormalities | 1.28E-05-1.33E-02 |
| AKT-CAT+DDC | |
| Cardiovascular Disease | 2.01E-10-2.29E-03 |
| Development Disorder | 1.17E-09-4.97E-04 |
| AKT-CAT+CCl4 | |
| Cardiovascular System Development and Function | 6.19E-08-1.02E-02 |
| Organismal Development | 6.19E-08-1.02E-02 |
Next, we analyzed the “cellular growth and proliferation” network, which contained 205 genes for AKT-CAT+DDC tumors and 169 genes for AKT-CAT+CCl4 tumors (Supplementary Table 4 and 5). Comparison between these two gene sets identified Col4a2, Cxcl16, Elf3, Galectin-3, Lxn, Mvp, and Nedd9, which were shared by AKT-CAT+DDC and AKT-CAT+CCl4 tumors and which showed furthermore a significant deregulation from AKT-CAT tumors (p<0.01, fold change >1.5). As Cxcl16, Galectin-3 and Nedd9 have been associated with worse prognosis in HCC patients (11–13), we tested their expression by qPCR (Supplementary Fig. 5). Indeed, their expression was highest in AKT-CAT+DDC and AKT-CAT+CCl4 tumors.
AKT-CAT+DDC tumors also showed an increase in pathways connected to vascular disease, which included atherosclerosis and arteriosclerosis. AKT-CAT+CCl4 tumors showed a significant change in cardiovascular system development and function which included proliferation and migration of endothelial cells as well as neovascularization. Yet, microvessel density remained similar in all AKT-CAT tumor groups (Supplementary Fig. 6).
Histologically, one of the most striking characteristic of DDC-treated tumors was loss of lipid droplets. IPA analysis showed that lipid metabolism was more significantly changed in AKT-CAT+DDC tumors (p = 5.62E08 – 2.46E-3) than in AKT-CAT tumors (p =1.71E03 – 1.33E02) and AKT-CAT+CCl4 tumors (p = 5.53E04 – 9.67E03). Detailed analysis showed that synthesis, flux, efflux and uptake of lipids, as well as uptake and metabolism of fatty acid were affected in AKT-CAT+DDC tumors and the majority of these functions showed a reduced activation score. To corroborate the involvement in lipid metabolism further, we determined the content of cholesteryl esters and triglycerides, which are both stored in lipid droplets(14). Cholesteryl ester concentration was significantly reduced in AKT-CAT+DDC tumors in comparison to AKT-CAT tumors, whereas AKT-CAT+CCl4 tumors had an intermediate concentration (Fig. 4C). Triglycerides were only slightly reduced in AKT-CAT+DDC tumors (Supplementary Fig. 7). Accordingly, proteins, which are involved in fatty acid and cholesterol metabolism (15): fatty acid synthase, phospho-ATP-citrate lyase, mammalian long chain acyl-CoA synthetase (ACSL), cytoplasmic acetyl-CoA synthetase (AceCS1), and phospho-S6-ribosomal protein (pS6) showed a reduced expression in AKT-CAT+DDC and AKT-CAT+CCl4 tumors (Supplementary Fig. 7).
Gene set enrichment analysis of tumoral and non-tumoral tissue
Next, we performed cross-species comparison and gene set enrichment analysis (GSEA) to relate our murine data to human data(16). We used our previously published human HCC gene sets, which define HCC patients with good and bad prognosis(17). Consistent with a more aggressive phenotype of tumors grown in the inflammatory environment, AKT-CAT+DDC tumors were characterized by a significant decrease of good prognosis genes (Fig. 4D), and AKT-CAT+CCl4 tumors showed an enrichment of poor prognosis genes (Fig. 4D). Thus, the biology of AKT-CAT+DDC and AKT-CAT+CCl4 tumors showed similarities with human HCC’s.
Given the importance of the non-tumoral liver tissue in HCC prognosis, we performed transcriptome analysis of the non-tumoral murine liver tissue by micro-array and executed GSEA with gene sets from HCC patients with low or high risk of HCC recurrence(18). Non-tumoral liver tissue from AKT-CAT+DDC mice showed enrichment of genes with high risk of late recurrence, and vice versa, the genes with low risk of late recurrence were enriched in AKT-CAT non-tumoral liver tissue (Fig. 4E). Therefore, the worse outcome of tumor bearing mice under DDC treatment was not only deducible from tumoral transcriptome, but also from the non-tumoral transcriptome, similar to HCC patients. Interestingly, liver tissue from tumor-free mice treated only with DDC, revealed an even further enrichment of genes related to worse prognosis (Fig. 4F). Therefore, AKT-CAT tumors provoked changes in the non-tumoral liver tissue, which improved prognosis. In contrast, there was no predictive value of the non-tumoral liver tissue from CCl4 treated mice using these gene sets at a FDR < 0.25.
Impact of DDC treatment on AKT-NRASG12V-driven hepatocarcinogenesis
Furthermore, we asked the question whether a tumor driven by a different combination of oncogenes would be similarly affected by chronic liver inflammation. To address this issue, we generated liver tumors by hydrodynamic injection of AKT and mutated NRASG12V, and placed the mice either on DDC diet (AKT-NRASG12V+DDC) or normal chow (AKT-NRASG12V). AKT-NRASG12V tumors were more aggressive than AKT-CAT tumors, and AKT-NRASG12V mice had to be sacrificed 10 weeks after hydrodynamic injection (vs 17.9 weeks for AKT-CAT model). AKT-NRASG12V+DDC mice had to be sacrificed slightly earlier, at 8.4 weeks after hydrodynamic injection, mainly due to ascites formation. Most of the liver tissue was occupied by tumor nodules in both groups at the time of sacrifice (Fig. 5A). DDC treatment did neither significantly influence the number of AKT-NRASG12V tumor nodules (Fig. 5B), nor the proliferation rate as measured by immunohistochemistry for Ki-67 (Fig. 5C). Oncogene expression was similar in both tumor groups, as measured by the expression of ERK, a downstream target of RAS activation and pAKT (Fig. 5D). Histologically, the majority of AKT-NRASG12V tumors were classified as hepatocellular carcinomas(30). As shown before(30), we also found cholangiocarcinomas (CCC) or mixed hepato-cholangiocellular tumors (HCC-CCC) (Supplementary Fig. 8). DDC diet did not change the relative proportion of HCC, CCC and mixed HCC-CCC, which varied between 80–82%, 10–12% and 6–10% in the two groups (Fig. 5E). However, analogous to AKT-CAT tumors, DDC treatment caused a reduction in lipid accumulation in (Fig. 5F) and average percentage of steatotic HCCs decreased from 56.1% in AKT-NRASG12V HCCs to 13.5% in AKT-NRASG12V +DDC tumors (data not shown). No metastasis was found in any of the tumor groups.
Figure 5.
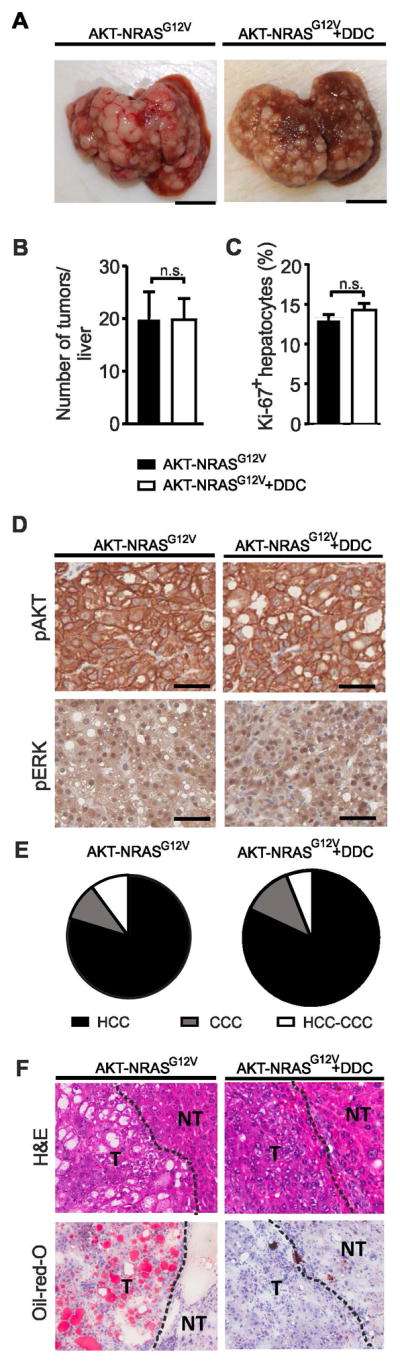
A) Macroscopic liver pictures with AKT-NRASG12V or AKT-NRASG12V+DDC tumors. Bar=1cm. B) Number of liver tumor nodules > 2mm in diameter visible from outside in AKT-NRASG12V or AKT-NRASG12V+DDC mice at the time of sacrifice. Mean and SEM from 3 – 4 mice/group. C) Percentage of Ki-67 positive hepatocytes within total hepatocytes, measured by immunohistochemistry. Mean and SEM of 6 – 9 tumor samples/group. D) Immunohistochemistry for pAKT and pERK in AKT-NRASG12V and AKT-NRASG12V+DDC tumors. E) Distribution of HCC, CCC, and mixed HCC-CCC in AKT-NRASG12V and AKT-NRASG12V+DDC tumors from 3 – 4 mice/group. F) H&E and Oil-red-O of AKT-NRASG12V and AKT-NRASG12V+DDC tumors.
Transcriptome was analyzed of histologically confirmed HCC’s with similar size from AKT-NRASG12V and AKT-NRASG12V+DDC mice. Unsupervised hierarchical clustering of all detected genes (n=9037) clearly separated tumors into two clusters determined by DDC treatment (Supplementary Fig. 9). A total of 1629 genes were differently expressed in AKT-NRASG12V tumors and 1913 genes in AKT-NRASG12V+DDC tumors in comparison to normal untreated liver tissue. IPA analysis of the differentially expressed genes showed that pathways affected were mostly shared in both experimental groups (Table 2). However, p-values were always higher in AKT- NRASG12V+DDC tumors, indicating that DDC mainly enhanced the differences of the changed pathways. Yet, cross-species comparison and GSEA with our previously published human gene sets(17) further demonstrated an enrichment of poor prognosis gene sets in AKT-NRASG12V+DDC tumors and of good prognosis gene sets in AKT-NRASG12V tumors (Supplementary Fig. 9) further supporting that biology of AKT-NRASG12V+DDC tumors reflected human HCC.
Table 2.
Most significant diseases and function affected in AKT-NRASG12V and AKT-NRASG12V+DDC tumors
| Tumor group | p-value |
|---|---|
| Shared pathways | |
| AKT-NRASG12V | |
| Cellular Growth and Proliferation | 4.73E-22 - 4.11E-04 |
| Cell Death and Survival | 1.51E-16 - 6.42E04 |
| Cardiovascular System Development and Function | 2.17E-15 - 6.42E-04 |
| Cancer | 3.19E-14 - 6.16E04 |
| AKT-NRASG12V+DDC | |
| Cellular Growth and Proliferation | 4.17E-30 - 4.02E-05 |
| Cell Death and Survival | 8.54E-29 - 5.3E-05 |
| Cancer | 4.66E-21 - 5.14E-05 |
| Cardiovascular System Development and Function | 1.44E-18 - 4.21E-05 |
| Unique pathways | |
| AKT-NRASG12V | |
| Organismal Survival | 5.95E-17 - 1.83E-04 |
| AKT-NRASG12V+DDC | |
| Organismal Injury and Abnormalities | 4.66E-21 - 5.2E-05 |
Finally, we wanted to compare effects exerted by DDC on AKT-CAT tumors with the DDC effects on AKT-NRASG12V tumors. A bioequivalence test(19) of similarities at a fold change > 1.5 and p < 0.05 revealed that 90.1% of the genes were similarly expressed between AKT-CAT and AKT-CAT+DDC tumors and 94.9% between AKT-NRAS and AKT-NRASG12V+DDC tumors. Therefore, DDC had a more pronounced effect on AKT-CAT tumors than on AKT-NRASG12V tumors. For direct comparison of DDC effects we normalized AKT-CAT+DDC to AKT-CAT and AKT-NRASG12V+DDC to AKT-NRASG12V and compared both groups. We identified a total of 393 genes significantly changed between normalized AKT-CAT+DDC and AKT-NRASG12V+DDC data sets. IPA analysis showed that the most significantly changed pathway by DDC in AKT-CAT tumors in comparison to AKT-NRASG12V tumors was “cellular growth and proliferation” (Supplementary Table 6), followed by “cellular assembly and organization”, “cardiovascular system development and function”, “organismal survival” and “cancer”. Therefore, DDC had a different effect on AKT-CAT tumors than on AKT-NRASG12V tumors.
DISCUSSION
Several studies have revealed the importance of the inflammatory liver microenvironment in HCC development. For example, it has been shown that prognosis of HCC patients can be predicted by the gene signature of non-tumoral liver tissue(18, 20). Furthermore, HCC patients with an increase of Th2 cytokines in relation to Th1 cytokines in non-tumoral liver tissue revealed increased venous metastasis and poor prognosis(21). However, many of the mechanisms linking inflammation to tumor development remain unclear and little is known to what extent chronic liver inflammation contributes to HCC phenotype. In this study, we developed an experimental mouse model, in which murine liver tumors were driven by specific oncogenes and developed in different inflammatory conditions. Chronic inflammation promoted tumor growth and aggressiveness, but had a stronger effect on AKT-CAT tumors than on AKT-NRASG12V tumors. Therefore, liver tumor phenotype is dependent on the interplay between oncogenic driver genes and the microenvironment.
Our study goes along with earlier murine studies, which have also described a tumor promoting effect by DDC or CCl4 (22, 23). We noted, that both DDC and CCl4 affected especially “cell growth and proliferation” in AKT-CAT tumors and Galectin-3, Nedd9 and Cxcl16 were among several genes specifically upregulated. These three genes have been associated additionally with worse prognosis in human HCC (11–13). Galectin-3 has been shown to promote tumor progression and metastasis formation in HCC(24). Interestingly, Galectin-3 has also been reported to be upregulated in injured liver(25) and may therefore link chronic liver damage and tumor development. Similarly, Cxcl16 and its receptor CXCR16, as well as Nedd9 have been shown to be involved in HCC progression and metastasis formation (26, 27). AKT-CAT+DDC and AKT-CAT+CCl4 tumors also showed a higher proportion of hepatocellular carcinomas and GSEA confirmed that changes in tumoral, but also non-tumoral tissue reflected human HCC biology. Interestingly, DDC treatment induced loss of lipid droplets with a reduction in cholesteryl content in AKT-CAT tumors. Accordingly, several genes involved in fatty acid and cholesterol metabolism were reduced in AKT-CAT+DDC and AKT-CAT+CCl4 tumors in comparison to AKT-CAT tumors.
Several effects appreciated in AKT-CAT tumors under DDC treatment, such as lipid loss and a decreased expression of genes associated with good survival by GSEA were also observed in AKT-NRASG12V+DDC tumors. However, in line with the bioequivalence test, the impact of DDC treatment on AKT-NRASG12V tumors was less pronounced and was primarily an enhancement of changes already procured by AKT-NRASG12V. For example, the effect on pathways involved in cell growth and proliferation was negligible. Direct comparison between AKT-CAT and AKT-NRASG12V tumors also revealed that DDC had a different effect on AKT-CAT tumors than on AKT-NRASG12V tumors. As expected, the effect on “cell growth and proliferation” was the most significant difference.
The differences in the response to inflammatory stimuli between AKT-CAT and AKT-NRASG12V tumors may be explained by two reasons. First, untreated AKT-NRASG12V tumors were more proliferative, grew significantly faster and had a more aggressive phenotype than untreated AKT-CAT tumors. This suggests that fast growing malignant tumors are less susceptible to the inflammatory microenvironment and are more likely to survive under adverse conditions. Second, there may be oncogene-specific differences in the response to cytokines or chemokines produced by tumor microenvironment. Thus, it has been recently shown that β-catenin has an intrinsic proinflammatory transcriptional program (28). Therefore, AKT-CAT tumors may be more susceptible to inflammatory stimuli than AKT-NRASG12V tumors.
Although we demonstrated that chronic inflammation plays an important role in tumor phenotype, our results do not allow differentiating whether the phenotype is defined by the best-fit tumor cells capable to survive in the background inflammation, or by the plasticity of tumor cells with transformation into a more aggressive phenotype under the pressure of chronic inflammation. DDC-treated mice showed a reduction in the number of AKT-CAT tumor nodules suggesting that only selective tumor cells had the ability to survive in the background of chronic inflammation driven by DDC and that some tumor cells may have been eliminated by chronic inflammation. This notion is supported by the fact that chronic inflammation can either promote or inhibit tumor growth(2). In contrast, the number of AKT-CAT tumors was similar in untreated and CCl4-treated mice, indicating that inflammation caused by CCl4 promoted a transformation into a more aggressive phenotype. Therefore, the appreciated change in phenotype of AKT-CAT tumors was most likely a combination of both, selection and transformation of tumor cells(29).
In conclusion, our study provides evidence that the inflammatory milieu changes the behavior and phenotype of HCC in a manner dependent on the driving oncogenes. Furthermore, tumors with the same mutations and driving oncogenes may have substantially different transcriptome depending on the type of inflammation. As a consequence, response to systemic cancer treatment may also depend on the tumor microenvironment.
MATERIALS AND METHODS
Hydrodynamic injection, vector constructs
For tumor generation, oncogenic plasmids and sleeping beauty transposase (ratio of 10:1) were diluted in 2mL saline (0.9% NaCl), and injected into the tail vein of 6 – 8 week-old FVB/n female mice (NCI-Frederick, MD) in 5 – 7 seconds(30). For AKT-CAT tumors, plasmids encoding for activated AKT1 (myristoilated-AKT1) and β-catenin (truncated Δ90N-β-catenin) were used(7). For AKT-NRASG12V tumors, AKT1 and N-RasG12V plasmids were used(30). For chronic liver inflammation, mice received a diet containing 0.1% DDC (Bio-Serv, Flemington, NJ) or were treated intraperitoneally twice a week with carbon tetrachloride (CCl4; Sigma) diluted 1:10 in mineral oil (Sigma) at 5μl/g body weight. Mice were kept in accordance with the animal regulations at the NCI/NIH (Bethesda, MD).
Statistics
Data were analyzed using Student t test. P values < 0.05 were considered as significant.
Microarray data analysis
Microarray analysis was performed from 4 mice/tumoral group and 3 mice/non-tumoral and control group. RNA was isolated from fresh frozen tissue using RNAeasy kit from Qiagen (Valencia, CA) and pooled from 3–4 histologically confirmed hepatocellular tumors per mouse and 1–2 locations of non-tumoral tissue and control liver tissue of age- and sex-matched mice on normal chow. RNA was hybridized on Sentrix Mouse Ref-8v2.0 expression BeadChips (Illumina, San Diego) and scanned on an iSCAN (Illumina). Data preprocessing and quantile normalization with background subtraction was performed with GenomeStudio2010 (Illumina). Signal intensity with a detection p > 0.05 was treated as missing value, and only genes represented in at least 50% of all samples were included. Data analysis was performed with Qlucore (Lund, Sweden). Functional analyses were performed by GSEA and Ingenuity Pathway Analysis (IPA8.7; Ingenuity Systems, Redwood City CA). All microarray data was submitted to GEO (GSE 77503). If not stated otherwise, significantly different expressed genes between two groups were identified using a p-value of 0.001 and fold change difference of 1.5.
See the Supporting Materials and Methods for additional information.
Supplementary Material
Acknowledgments
Financial support: Intramural Research Program of the NIH/NCI/CRC. M.S.M. by “Schweizerische Stiftung für Medizinisch-Biologische Stipendien” (PASMP-3_14007) and “Forschungsfond” of the University of Basel/Lichtenstein Stiftung” (DMS2287). Oncosuisse (M.S.M. and C.Q. by KFS-3302-08-2013 and A.W. by KLS project 2773-02-2011). J.U.M. was supported by grants from the German Cancer Aid (DKH 110989) and the Volkswagen Foundation (Lichtenberg program).
We would like to thank Xin Chen (UCSF, CA) for providing plasmids and helpful instructions.
Abbreviations
- HCC
- ASH
- NASH
- AKT
- CAT
- DDC
- CCl4
- HCA
- HB
- IPA
- GSEA
- CCC
Footnotes
Conflicts of interest
The authors disclose no conflicts.
Contributor Information
Matthias S. Matter, Email: matthias.matter@nihg.gov.
Jens U. Marquardt, Email: marquarj@uni-mainz.de.
Jesper B. Andersen, Email: jesper.andersen@bric.ku.dk.
Cristina Quintavalle, Email: cristina.quintavalle@usb.ch.
Nikolay Korokhov, Email: nkorokhov@hotmail.com.
Jim K. Stauffer, Email: stauffej@mail.nih.gov.
Kosuke Kaji, Email: kosukekaji@gmail.com.
Thomas Decaens, Email: tdecaens@chu-grenoble.fr.
Luca Quagliata, Email: luca.quagliata@usb.ch.
Fathi Elloumi, Email: elloumif@mail.nih.gov.
Tanya Hoang, Email: hoangt@dc37a.nci.nih.gov.
Alfredo Molinolo, Email: amolinolo@ucsd.edu.
Elizabeth A. Conner, Email: connerl@dc37a.nci.nih.gov.
Achim Weber, Email: achim.weber@usz.ch.
Mathias Heikenwalder, Email: heikenwaelder@helmholtz-muenchen.de.
Valentina M. Factor, Email: factorv@dc37a.nci.nih.gov.
Snorri S. Thorgeirsson, Email: thorgeis@dc37a.nci.nih.gov.
References
- 1.Zucman-Rossi J, Villanueva A, Nault JC, Llovet JM. Genetic Landscape and Biomarkers of Hepatocellular Carcinoma. Gastroenterology. 2015;149:1226–1239. e1224. doi: 10.1053/j.gastro.2015.05.061. [DOI] [PubMed] [Google Scholar]
- 2.Grivennikov SI, Greten FR, Karin M. Immunity, inflammation, and cancer. Cell. 2010;140:883–899. doi: 10.1016/j.cell.2010.01.025. [DOI] [PMC free article] [PubMed] [Google Scholar]
- 3.El-Serag HB. Hepatocellular carcinoma. N Engl J Med. 2011;365:1118–1127. doi: 10.1056/NEJMra1001683. [DOI] [PubMed] [Google Scholar]
- 4.Ogino S, Galon J, Fuchs CS, Dranoff G. Cancer immunology--analysis of host and tumor factors for personalized medicine. Nat Rev Clin Oncol. 2011;8:711–719. doi: 10.1038/nrclinonc.2011.122. [DOI] [PMC free article] [PubMed] [Google Scholar]
- 5.Preisegger KH, Factor VM, Fuchsbichler A, Stumptner C, Denk H, Thorgeirsson SS. Atypical ductular proliferation and its inhibition by transforming growth factor beta1 in the 3,5-diethoxycarbonyl-1,4-dihydrocollidine mouse model for chronic alcoholic liver disease. Lab Invest. 1999;79:103–109. [PubMed] [Google Scholar]
- 6.Recknagel RO, Glende EA, Jr, Dolak JA, Waller RL. Mechanisms of carbon tetrachloride toxicity. Pharmacol Ther. 1989;43:139–154. doi: 10.1016/0163-7258(89)90050-8. [DOI] [PubMed] [Google Scholar]
- 7.Stauffer JK, Scarzello AJ, Andersen JB, De Kluyver RL, Back TC, Weiss JM, et al. Coactivation of AKT and beta-catenin in mice rapidly induces formation of lipogenic liver tumors. Cancer Res. 2011;71:2718–2727. doi: 10.1158/0008-5472.CAN-10-2705. [DOI] [PMC free article] [PubMed] [Google Scholar]
- 8.Fan B, Malato Y, Calvisi DF, Naqvi S, Razumilava N, Ribback S, et al. Cholangiocarcinomas can originate from hepatocytes in mice. J Clin Invest. 2012;122:2911–2915. doi: 10.1172/JCI63212. [DOI] [PMC free article] [PubMed] [Google Scholar]
- 9.Thoolen B, Maronpot RR, Harada T, Nyska A, Rousseaux C, Nolte T, et al. Proliferative and nonproliferative lesions of the rat and mouse hepatobiliary system. Toxicol Pathol. 2010;38:5S–81S. doi: 10.1177/0192623310386499. [DOI] [PubMed] [Google Scholar]
- 10.Ward JM. Morphology of hepatocellular neoplasms in B6C3F1 mice. Cancer Lett. 1980;9:319–325. doi: 10.1016/0304-3835(80)90024-5. [DOI] [PubMed] [Google Scholar]
- 11.Gao Q, Zhao YJ, Wang XY, Qiu SJ, Shi YH, Sun J, et al. CXCR6 upregulation contributes to a proinflammatory tumor microenvironment that drives metastasis and poor patient outcomes in hepatocellular carcinoma. Cancer Res. 2012;72:3546–3556. doi: 10.1158/0008-5472.CAN-11-4032. [DOI] [PubMed] [Google Scholar]
- 12.Matsuda Y, Yamagiwa Y, Fukushima K, Ueno Y, Shimosegawa T. Expression of galectin-3 involved in prognosis of patients with hepatocellular carcinoma. Hepatol Res. 2008;38:1098–1111. doi: 10.1111/j.1872-034X.2008.00387.x. [DOI] [PubMed] [Google Scholar]
- 13.Lu P, Wang ZP, Dang Z, Zheng ZG, Li X, Zhou L, et al. Expression of NEDD9 in hepatocellular carcinoma and its clinical significance. Oncol Rep. 2015;33:2375–2383. doi: 10.3892/or.2015.3863. [DOI] [PubMed] [Google Scholar]
- 14.Greenberg AS, Coleman RA, Kraemer FB, McManaman JL, Obin MS, Puri V, et al. The role of lipid droplets in metabolic disease in rodents and humans. J Clin Invest. 2011;121:2102–2110. doi: 10.1172/JCI46069. [DOI] [PMC free article] [PubMed] [Google Scholar]
- 15.Gabitova L, Gorin A, Astsaturov I. Molecular pathways: sterols and receptor signaling in cancer. Clin Cancer Res. 2014;20:28–34. doi: 10.1158/1078-0432.CCR-13-0122. [DOI] [PMC free article] [PubMed] [Google Scholar]
- 16.Subramanian A, Tamayo P, Mootha VK, Mukherjee S, Ebert BL, Gillette MA, et al. Gene set enrichment analysis: a knowledge-based approach for interpreting genome-wide expression profiles. Proc Natl Acad Sci U S A. 2005;102:15545–15550. doi: 10.1073/pnas.0506580102. [DOI] [PMC free article] [PubMed] [Google Scholar]
- 17.Lee JS, Chu IS, Heo J, Calvisi DF, Sun Z, Roskams T, et al. Classification and prediction of survival in hepatocellular carcinoma by gene expression profiling. Hepatology. 2004;40:667–676. doi: 10.1002/hep.20375. [DOI] [PubMed] [Google Scholar]
- 18.Hoshida Y, Villanueva A, Kobayashi M, Peix J, Chiang DY, Camargo A, et al. Gene expression in fixed tissues and outcome in hepatocellular carcinoma. N Engl J Med. 2008;359:1995–2004. doi: 10.1056/NEJMoa0804525. [DOI] [PMC free article] [PubMed] [Google Scholar]
- 19.Wellek S. Testing stastistical hypothesis of equivalence. Chapman & Hall/CRC Press; Boca Raton, FL: 2003. [Google Scholar]
- 20.Tsuchiya M, Parker JS, Kono H, Matsuda M, Fujii H, Rusyn I. Gene expression in nontumoral liver tissue and recurrence-free survival in hepatitis C virus-positive hepatocellular carcinoma. Mol Cancer. 2010;9:74. doi: 10.1186/1476-4598-9-74. [DOI] [PMC free article] [PubMed] [Google Scholar]
- 21.Budhu A, Forgues M, Ye QH, Jia HL, He P, Zanetti KA, et al. Prediction of venous metastases, recurrence, and prognosis in hepatocellular carcinoma based on a unique immune response signature of the liver microenvironment. Cancer Cell. 2006;10:99–111. doi: 10.1016/j.ccr.2006.06.016. [DOI] [PubMed] [Google Scholar]
- 22.Uehara T, Ainslie GR, Kutanzi K, Pogribny IP, Muskhelishvili L, Izawa T, et al. Molecular mechanisms of fibrosis-associated promotion of liver carcinogenesis. Toxicol Sci. 2013;132:53–63. doi: 10.1093/toxsci/kfs342. [DOI] [PMC free article] [PubMed] [Google Scholar]
- 23.Beer S, Komatsubara K, Bellovin DI, Kurobe M, Sylvester K, Felsher DW. Hepatotoxin-induced changes in the adult murine liver promote MYC-induced tumorigenesis. PLoS One. 2008;3:e2493. doi: 10.1371/journal.pone.0002493. [DOI] [PMC free article] [PubMed] [Google Scholar]
- 24.Serizawa N, Tian J, Fukada H, Baghy K, Scott F, Chen X, et al. Galectin 3 regulates HCC cell invasion by RhoA and MLCK activation. Lab Invest. 2015;95:1145–1156. doi: 10.1038/labinvest.2015.77. [DOI] [PMC free article] [PubMed] [Google Scholar]
- 25.Henderson NC, Mackinnon AC, Farnworth SL, Poirier F, Russo FP, Iredale JP, et al. Galectin-3 regulates myofibroblast activation and hepatic fibrosis. Proc Natl Acad Sci U S A. 2006;103:5060–5065. doi: 10.1073/pnas.0511167103. [DOI] [PMC free article] [PubMed] [Google Scholar]
- 26.Vansaun MN, Mendonsa AM, Lee Gorden D. Hepatocellular proliferation correlates with inflammatory cell and cytokine changes in a murine model of nonalchoholic fatty liver disease. PLoS One. 2013;8:e73054. doi: 10.1371/journal.pone.0073054. [DOI] [PMC free article] [PubMed] [Google Scholar]
- 27.Xia L, Huang W, Tian D, Zhu H, Qi X, Chen Z, et al. Overexpression of forkhead box C1 promotes tumor metastasis and indicates poor prognosis in hepatocellular carcinoma. Hepatology. 2013;57:610–624. doi: 10.1002/hep.26029. [DOI] [PubMed] [Google Scholar]
- 28.Anson M, Crain-Denoyelle AM, Baud V, Chereau F, Gougelet A, Terris B, et al. Oncogenic beta-catenin triggers an inflammatory response that determines the aggressiveness of hepatocellular carcinoma in mice. J Clin Invest. 2012;122:586–599. doi: 10.1172/JCI43937. [DOI] [PMC free article] [PubMed] [Google Scholar]
- 29.Schreiber RD, Old LJ, Smyth MJ. Cancer immunoediting: integrating immunity’s roles in cancer suppression and promotion. Science. 2011;331:1565–1570. doi: 10.1126/science.1203486. [DOI] [PubMed] [Google Scholar]
- 30.Ho C, Wang C, Mattu S, Destefanis G, Ladu S, Delogu S, et al. AKT (v-akt murine thymoma viral oncogene homolog 1) and N-Ras (neuroblastoma ras viral oncogene homolog) coactivation in the mouse liver promotes rapid carcinogenesis by way of mTOR (mammalian target of rapamycin complex 1), FOXM1 (forkhead box M1)/SKP2, and c-Myc pathways. Hepatology. 2012;55:833–845. doi: 10.1002/hep.24736. [DOI] [PMC free article] [PubMed] [Google Scholar]
Associated Data
This section collects any data citations, data availability statements, or supplementary materials included in this article.