Abstract
To compare QRISKII, an electronic health data based risk score, to the Framingham Risk Score (FRS) and atherosclerotic cardiovascular disease (ASCVD) score. Risk estimates were calculated for a cohort of 8783 patients and patients were followed from November 29, 2012 through June 1, 2015, for a CVD event. During follow-up, 246 men and 247 women had a CVD event. The Cohen's Kappa statistic for the comparison of QRISKII and FRS was 0.22 for men and 0.23 for women, with QRISKII classifying more patients in the higher risk groups. QRISKII and ASCVD were more similar, with Kappa statistics of 0.49 for men and 0.51 for women. QRISKII shows increased discrimination with AUC statistics of 0.65 and 0.71, respectively, compared to the FRS (0.59 and 0.66) and ASCVD (0.63 and 0.69). These results demonstrate that incorporating additional data from the EHR may improve CVD risk stratification.
Keywords: Cardiovascular, QRISK, Framingham risk score, ASCVD, Biobank
Introduction
Cardiovascular disease (CVD) is the leading cause of death for both men and women in every major ethnic group in the United States (US), accounting for 32% of all deaths in 2010, and on average, claiming more than 2150 lives each day [1]. In 2010, an estimated 83.6 million adults in the US had CVD at a cost of $315.4 billion [1]. CVD risk scores are used in routine clinical practice to identify patients who would most benefit from intervention. Three common risk scores, the Framingham Risk Score (FRS) [2-4] and Atherosclerotic Cardiovascular Disease (ASCVD) [5] in the US, and the QRISK [6, 7] in the United Kingdom (UK), aid in identifying individuals at the highest level of risk. Misclassification of risk remains a serious concern given the effective preventive strategies available [8].
The FRS was originally developed in 1998 from the exclusively white Framingham Heart Study population [2]. The algorithm used in the FRS has since been updated with the inclusion of additional risk factors and is widely used in the US to determine risk based on age, sex, total cholesterol, high density lipoprotein (HDL), blood pressure/antihypertensive treatment, diabetes status, and smoking status [2-4]. However, concerns about the high rates of misclassification, the overestimation of risk in contemporary populations with less CVD, underestimation in high risk subgroups (e.g., low socioeconomic status), performance in ethnically diverse populations, and usefulness in the face of missing data prompted the creation of the QRISK Score [7]. QRISK was developed in the UK using electronic health data from the QRESEARCH® database for risk factor information on ethnicity, family history of early coronary heart disease (CHD), chronic kidney disease (CKD), atrial fibrillation (AF), rheumatoid arthritis (RA), deprivation, and body mass index (BMI), in addition to the FRS risk factors [9]. In 2008, QRISK was updated to QRISKII, which incorporated more relevant conditions into the algorithm, and was based on more recent population data [9].
In 2013, the ACC/AHA Task Force on Practice Guidelines developed a new score to assess the 10-year risk of atherosclerotic cardiovascular disease (ASCVD) to address deficiencies in existing scores using data from several geographically diverse research cohorts comprised of blacks and whites [5]. The data from these population-based cohorts were used to create race- and sex-specific risk scores, which incorporate the same risk factors as the FRS [5]. The new risk score calculates 10-year and lifetime risk for ASCVD, which is defined by coronary death or nonfatal myocardial infarction (MI), or fatal or nonfatal stroke.
Comparisons of the performance of US-developed risk scores and QRISK/QRISKII have previously been limited to populations in Europe in part due to the lack of population based electronic health data in the US. However, electronic health record (EHR) systems are becoming ubiquitous due to the Meaningful Use Standards implemented as part of the Health Information Technology for Economic and Clinical Health (HITECH) Act [10]. Secondary use of EHR data has shown to be a robust and cost-effective strategy for epidemiologic, genomic, and translational research [11-15]. Specifically, leveraging EHR data for disease risk scores, allows for additional risk factors to be incorporated and the range of outcomes increased [16].
High CVD morbidity, mortality, and associated health care costs justify the continued effort to improve risk prediction so preventative interventions can be implemented. The impact of incorporating EHR data beyond the limited set of risk factors used in FRS and ASCVD to improve risk prediction in the US is unknown. Therefore, we carried out a study to compare the performance of the research cohort based scores, ASCVD and FRS, to the electronic health data-based QRISKII by applying all three risk scores as they are used in clinical practice in a US population.
Methods
Participants
A cohort of 13,188 participants enrolled in the Mayo Clinic Biobank, recruited from the Mayo Clinic Primary Care Internal Medicine practice on the index date of November 29, 2012, and 30-75 years of age, was initially selected for the study. Details and history of the Mayo Clinic Biobank have been described by Olson et al. [17]. We excluded 3546 patients who had prevalent CVD and 392 patients missing the data elements needed to calculate the risk scores. We further excluded 467 patients who were either non-white or of unknown race/ethnicity because the FRS was developed in an exclusively white population. A final sample size of 8783 patients was included in the study.
Measurements
Demographic data, including date of birth and sex, were collected from the EHR. Likewise, EHR laboratory test data for total cholesterol (mg/dL) and HDL cholesterol (mg/dL) measured between January 1, 2005 and December 31, 2012, were extracted and values closest to the index date of November 29, 2012, were used in the risk score calculations. EHR-derived measures of systolic blood pressure (mmHg) and hypertension treatment (yes/no) measured within 2010-2012 were considered, and values closest to the index date were used. An incidence of one ICD9 code was used to identify persons with a history of CKD (ICD9 codes 403-404), RA (ICD9 code 714), and AF (ICD9 code 427.3). Diabetes mellitus was identified by an EHR-based algorithm.[18] BMI was calculated as weight (kg)/height2 (m2) for all patients.
The Biobank Questionnaire was used to obtain risk factor information for smoking status (yes/no) and family history of heart attack in a first-degree relative (yes/no). The Rochester Epidemiology Project (REP) housing data (HOUSES index) [19] was used as a surrogate for Townsend Scores of deprivation in the QRISKII calculation. Since the HOUSES index is negatively correlated with the Townsend scores, values were multiplied by a value of - 1.00 to make the data congruent. The HOUSES index is a measure of socioeconomic status with a high HOUSES index score indicating affluence and a low score indicating deprivation [19].
CVD Risk Scores and Events
Risk scores were applied in the same way they are used in clinical practice. Specifically, 10-year CVD risk was calculated on the index date using the QRISKII-2008, as described by Hippisley-Cox et al. [9], 2008 FRS, described by D'Agostino et al. [4], and 2013 ASCVD, described by Goff et al. [5]. As described above, QRISKII was calculated using the HOUSES index as a surrogate for Townsend Score when available in the subset analyses or by assigning the average risk for deprivation in the full cohort analyses. Risk scores were categorized as low risk (≤ 5%), intermediate-low risk (> 5% and ≤ 10%), intermediate-high risk (> 10% and ≤ 20%), or high risk (> 20%) [4, 5]. Patients were followed for the primary outcome of first recorded diagnosis of a CVD event from November 29, 2012 through June 1, 2015. Our definition of CVD events included angina pectoris, acute MI, CHD (ICD9 410-414), chronic ischemic cerebral infarction, stroke, and transient ischemic attack (TIA) (ICD9 430-435) as these outcomes were used for two of the three risk scores (FRS and QRISKII). One or more ICD-9 codes for a patient indicated a diagnosis of a CVD event.
Statistics
Patient characteristics were summarized using mean (SD), median, and range for continuous variables and frequency (percent) for categorical variables. FRS, QRISKII, and ASCVD risk scores were stratified into risk categories according to published guidelines [4, 5]. The Cohen's Kappa statistic was used to assess the agreement between score categories.[20] Discrimination of each risk score was assessed using the area under the receiver operating characteristic (ROC) curve.
Results
A total of 8783 patients (35% men, 65% women) age 30-75 were included in the study. Table 1 summarizes the baseline characteristics of the cohort by sex for cardiovascular risk factors used in the risk scores. A high prevalence was observed for several risk factors. For example, 82% of men and 63% of women were overweight or obese (BMI > 25), 14% of men and 9% of women had type 2 diabetes, and approximately a third of all patients were treated for hypertension. In contrast, the prevalence of current smoking, RA, AF, and CKD was low for both sexes. During three years of follow-up, 246 men and 247 women experienced a CVD event.
Table 1.
| Characteristics | Men | Women |
|---|---|---|
| n | 3093 | 5690 |
| Age | 59 ± 10 | 56 ± 11 |
| BMI, kg/m2 | 29 ± 4.9 | 28 ± 6.4 |
| Underweight <18.5 | 15 (0.5) | 80 (1) |
| Normal 18.5-24.9 | 560 (18) | 2039 (36) |
| Overweight 25.0-29.9 | 1417 (46) | 1707 (30) |
| Obese ≥30.0 | 1101 (36) | 1864 (33) |
| Systolic BP, mmHg | 122 ± 14 | 120 ± 16 |
| Normal <120 | 1372 (44) | 2817 (50) |
| Prehypertension 120-139 | 1425 (46) | 2321 (41) |
| Stage 1 hypertension 140-159 | 262 (8) | 465 (8) |
| Stage 2 hypertension ≥160 | 34 (1) | 87 (2) |
| Total cholesterol, mg/dL | 181 ± 32 | 196 ± 34 |
| HDL cholesterol, mg/dL | 51 ± 15 | 65 ± 18 |
| Total cholesterol/HDL ratio | 3.7 ± 1.1 | 3.2 ± 1.0 |
| Smoking status | ||
| Never | 1797 (58) | 3705 (65) |
| Former | 1166 (38) | 1704 (30) |
| 1-10 cigarettes per day | 38 (1) | 139 (2) |
| 10-19 cigarettes per day | 59 (2) | 108 (2) |
| ≥20 cigarettes per day | 33 (1) | 34 (1) |
| Family history of CHDc | 208 (7) | 416 (7) |
| Blood pressure treatment | 1021 (33) | 1482 (26) |
| Diabetes insipidus (Type 1) | 32 (1) | 45 (1) |
| Diabetes mellitus (Type 2) | 425 (14) | 533 (9) |
| Rheumatoid arthritis | 90 (3) | 209 (4) |
| Atrial fibrillation | 113 (4) | 102 (2) |
| Chronic kidney disease | 89 (3) | 123 (2) |
| Socioeconomic status (HOUSES, n=3999) | 0.86 ± 3.23 | 0.39 ± 3.31 |
| CVD events during follow-up | 246 (8) | 247 (4) |
BMI body mass index, BP blood pressure, CHD coronary heart disease, CVD cardiovascular disease, HDL high density lipoprotein
Values are n(%) unless indicated by mean ± SD
In first degree relative under 60
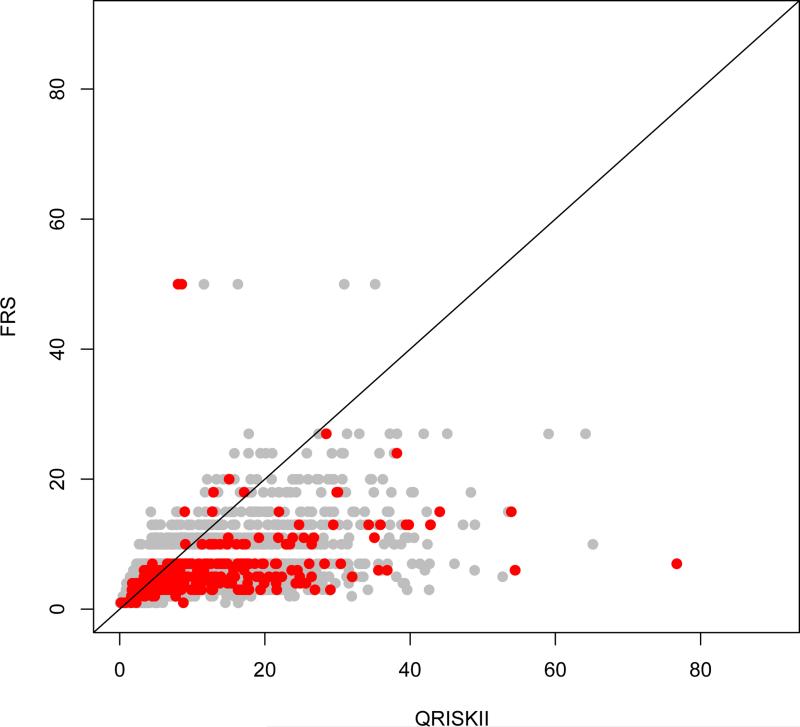
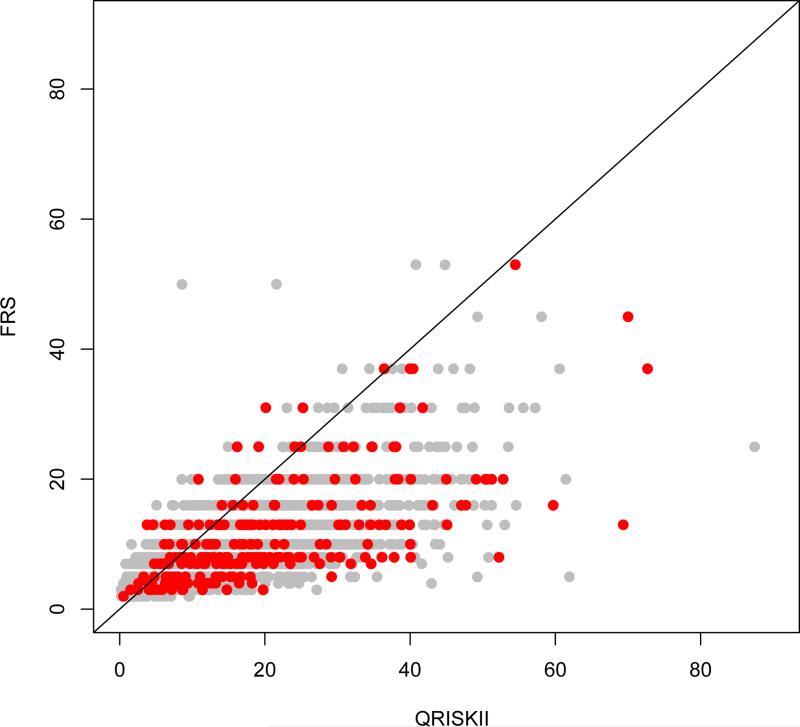
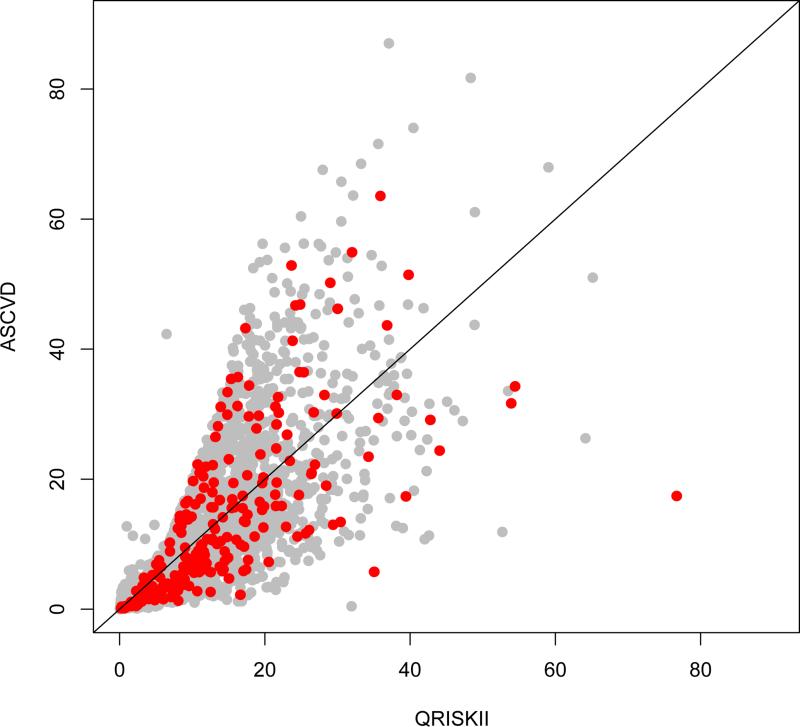
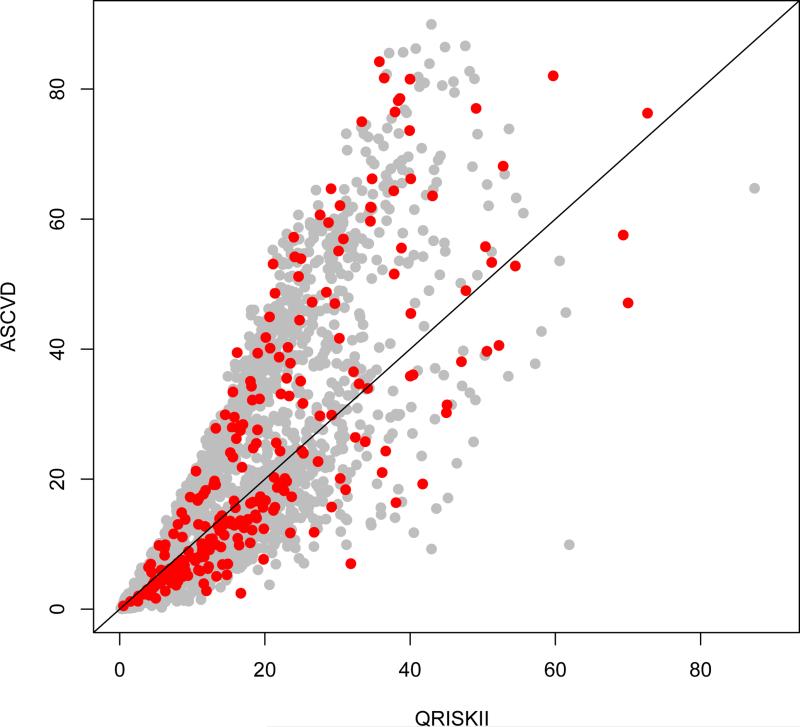
Table 2 summarizes the comparison between QRISKII and FRS by sex. The concordance between QRISKII and FRS was 41% in men and 56% in women. However, the reclassification to higher risk based on QRISKII was evident. For example, QRISKII classified 24% of men as high risk whereas only 3% were high risk according to FRS. The Kappa statistic was 0.22 (95% CI: 0.20-0.24) for men and 0.23 (95% CI: 0.21-0.25) for women. Figures 1a and 1b compare the CVD risk score estimates for the QRISKII versus the FRS; subjects with observed events are indicated with bold symbols. QRISKII classified persons with events as higher risk compared to FRS. Both the FRS and QRISKII performed suboptimal in men and women, categorizing patients with events into low-risk groups. Similar results were observed when using the Houses Index as a surrogate for the Townsend score in the calculation of the QRISKII (Supplementary Table 1).
Table 2.
Comparison of the Framingham Risk Score and QRISKII in A) Women and B) Men
| A) Women | Framingham Risk Score | ||||
|---|---|---|---|---|---|
| Risk Categorya | Low Risk | Intermediate Low Risk | Intermediate High Risk | High Risk | |
| Low risk | 2665 (47) | 171 (3) | 7 (< 1) | 0 (0) | |
| QRISKII | Intermediate low risk | 856 (15) | 362 (6) | 40 (1) | 2 (< 1) |
| Intermediate high risk | 618 (11) | 446 (8) | 131 (2) | 6 (< 1) | |
| High risk | 97 (2) | 143 (3) | 125 (2) | 21 (< 1) | |
| B) Men | Framingham Risk Score | ||||
|---|---|---|---|---|---|
| Risk Categorya | Low Risk | Intermediate Low Risk | Intermediate High Risk | High Risk | |
| Low risk | 512 (17) | 79 (3) | 4 (< 1) | 0 (0) | |
| QRISKII | Intermediate low risk | 310 (10) | 399 (13) | 29 (1) | 1 (< 1) |
| Intermediate high risk | 163 (5) | 581 (19) | 260 (8) | 3 (< 1) | |
| High risk | 28 (1) | 231 (7) | 397 (13) | 96 (3) | |
Values are n (%)
Low risk ≤ 5%; Intermediate Low Risk 5% -≤ 10%; Intermediate High Risk 10% -≤ 20%; High Risk >20%
Fig. 1.
Comparison of QRISKII and Framingham Risk Score (FRS) estimates in a) women (n=5690) and b) men (n=3093). Red/bold points indicate observed events; 246 in men and 247 in women.
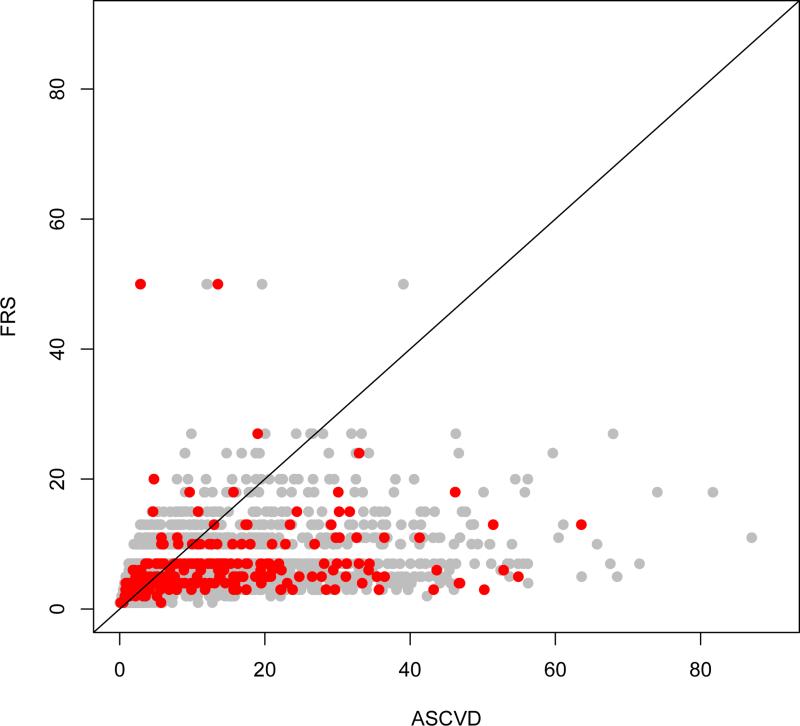
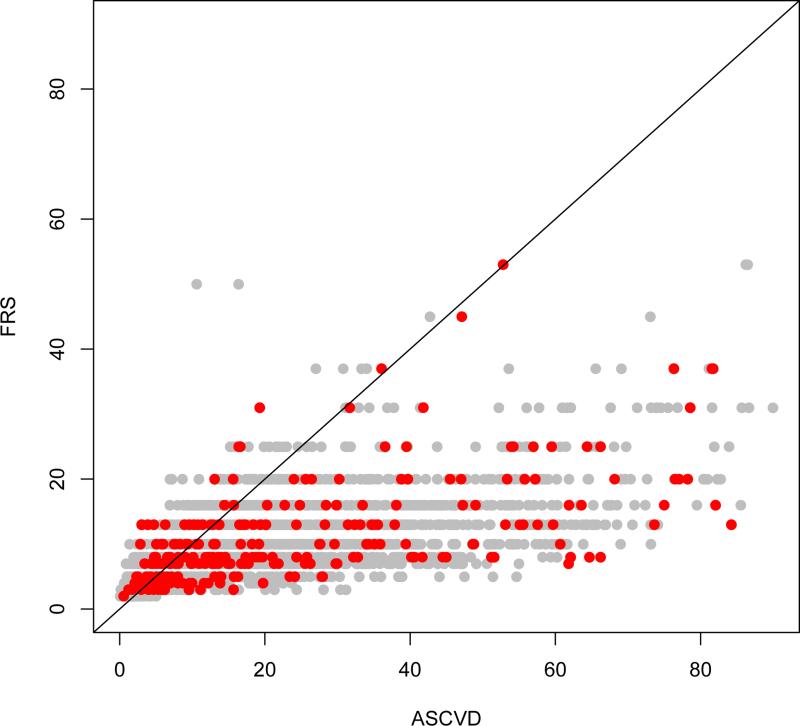
Table 3 summarizes the comparison of the ASCVD and FRS risk categories by sex. The FRS and ASCVD classified 44% of men and 62% of women in the same risk categories. The ASCVD classified more men and women in the higher risk groups. The ASCVD also identified more women as intermediate high and high risk than the FRS. For men, 12% were classified according to the FRS as intermediate-low risk while these same men were classified according the ASCVD as high risk (Table 3b). The Kappa statistic was 0.26 (95% CI: 0.24-0.28) for men and 0.25 (95% CI: 0.23-0.27) for women. In Figures 2a and 2b, CVD risk score predicted estimates are shown between the ASCVD and FRS.
Table 3.
| A) Women | Framingham Risk Score | ||||
|---|---|---|---|---|---|
| Risk Categoryc | Low Risk | Intermediate Low Risk | Intermediate High Risk | High Risk | |
| Low risk | 3085 (54) | 336 (6) | 23 (<1) | 1 (< 1) | |
| ASCVD | Intermediate low risk | 530 (9) | 312 (5) | 65 (1) | 3 (< 1) |
| Intermediate high risk | 418 (7) | 299 (5) | 103 (2) | 9 (< 1) | |
| High risk | 203 (4) | 175 (3) | 112 (2) | 16 (< 1) | |
| B) Men | Framingham Risk Score | ||||
|---|---|---|---|---|---|
| Risk Categoryc | Low Risk | Intermediate Low Risk | Intermediate High Risk | High Risk | |
| Low risk | 667 (22) | 181 (6) | 4 (< 1) | 0 (0) | |
| ASCVD | Intermediate low risk | 207 (7) | 375 (12) | 51 (2) | 0 (0) |
| Intermediate high risk | 89 (3) | 361 (12) | 216 (7) | 10 (< 1) | |
| High risk | 50 (2) | 373 (12) | 419 (14) | 90 (3) | |
ASCVD atherosclerotic cardiovascular disease
Values are n (%)
Low risk ≤ 5%; Intermediate Low Risk 5% - ≤ 10%; Intermediate High Risk 10% - ≤ 20%; High Risk > 20%
Fig. 2.
Comparison of Framingham Risk Score (FRS) and atherosclerotic cardiovascular disease (ASCVD) risk estimates in a) women (n=5690) and b) men (n=3093). Red/bold points indicate observed events; 246 in men and 247 in women.
Table 4 summarizes the comparison of QRISKII and ASCVD by sex. The concordance was highest for these two risk scores (62% in men and 69% in women). In general, QRISKII classified more men and women in intermediate risk groups than the ASCVD. The Kappa statistic was 0.49 (95% CI: 0.47-0.52) for men and 0.51 (95% CI: 0.49-0.53) for women. Figures 3a and 3b show that QRISKII and the ASCVD have similar predicted CVD risk score estimates. Similar results were observed when using the HOUSES Index as a surrogate for the Townsend score in the calculation of the QRISKII (Supplementary Table 2).
Table 4.
| A) Women | ASCVD | ||||
|---|---|---|---|---|---|
| Risk Categoryc | Low Risk | Intermediate Low Risk | Intermediate High Risk | High Risk | |
| Low risk | 2765 (49) | 74 (1) | 4 (< 1) | 0 (0) | |
| QRISKII | Intermediate low risk | 603 (11) | 461 (8) | 195 (3) | 1 (< 1) |
| Intermediate high risk | 70 (1) | 355 (6) | 498 (9) | 278 (5) | |
| High risk | 7 (<1) | 20 (< 1) | 132 (2) | 227 (4) | |
| B) Men | ASCVD | ||||
|---|---|---|---|---|---|
| Risk Categoryc | Low Risk | Intermediate Low Risk | Intermediate High Risk | High Risk | |
| Low risk | 559 (18) | 36 (1) | 0 (0) | 0 (0) | |
| QRISKII | Intermediate low risk | 275 (9) | 342 (11) | 122 (4) | 0 (0) |
| Intermediate high risk | 17 (< 1) | 243 (8) | 414 (13) | 333 (11) | |
| High risk | 1 (< 1) | 12 (< 1) | 140 (5) | 599 (19) | |
ASCVD atherosclerotic cardiovascular disease
Values are n (%)
Low risk ≤ 5%; Intermediate Low Risk 5% - ≤ 10%; Intermediate High Risk 10% - ≤ 20%; High Risk > 20%
Fig. 3.
Comparison of QRISKII and atherosclerotic cardiovascular disease (ASCVD) risk estimates in a) women (n=5690) and b) men (n=3093). Red/bold points indicate observed events; 246 in men and 247 in women.
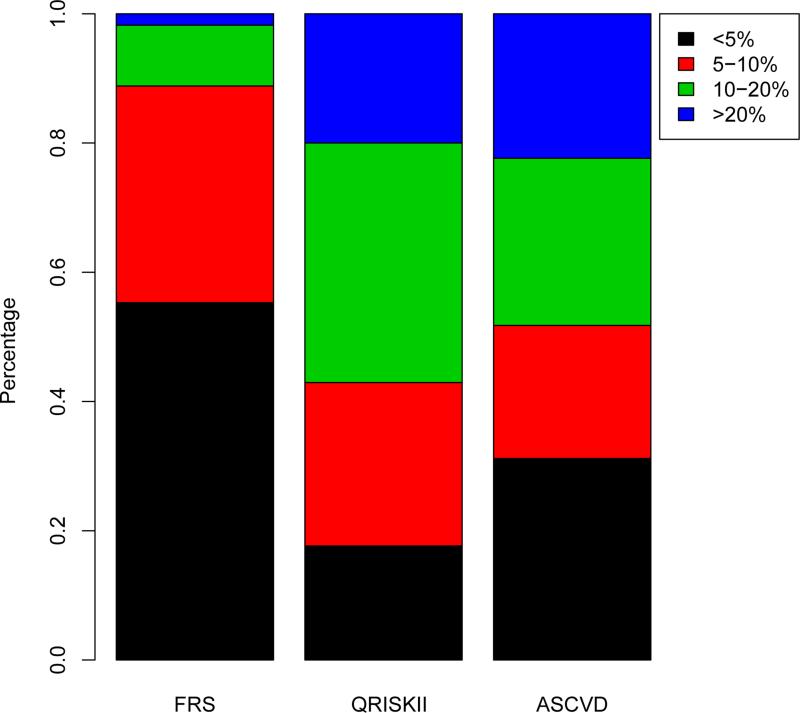
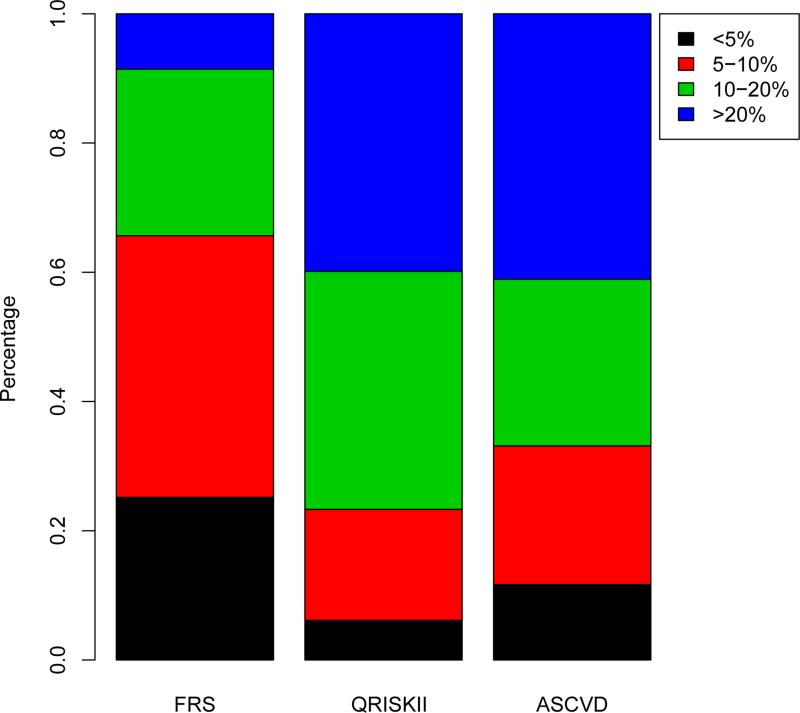
Figures 4a and 4b show the distribution of risk categories for the ASCVD, FRS, and QRISKII by sex for those who had a CVD event. In women who experienced a CVD event during follow-up, 19% were classified as high risk by QRISKII and 22% by the ASCVD. However, only 2% of women who had an event were classified as high risk by the FRS. Furthermore, 56% of women with an event were considered low risk by the FRS as compared to 21% for QRISKII and 33% for ASCVD. For men who experienced a CVD event, the ASCVD and QRISKII classified 41% and 39% as high risk, respectively, whereas only 8% were considered high risk by FRS. Similar patterns were observed when using the HOUSES index in the calculation of the QRISKII (Supplementary Figures 1 and 2).
Fig. 4.
Distribution of risk in a) women and b) men who had a cardiovascular disease event during follow-up. Framingham Risk Score (FRS), QRISKII, and atherosclerotic cardiovascular disease (ASCVD) risk estimates were stratified into risk categories.
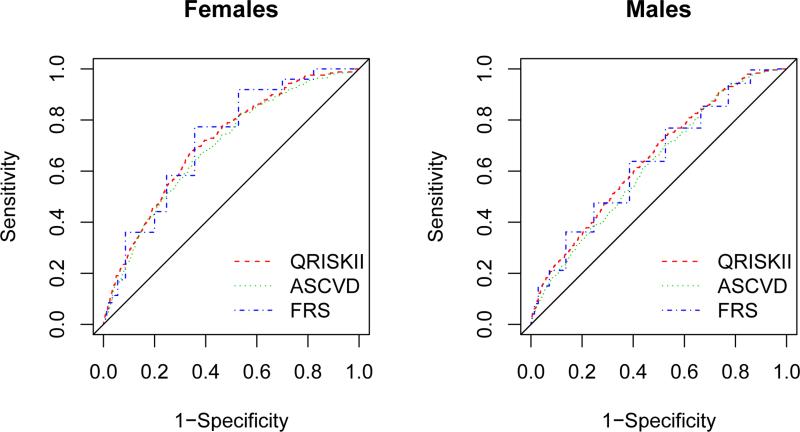
The discrimination of QRISKII, FRS, and ASCVD is shown in Figure 5. QRISKII shows higher area under the ROC curve (AUC) statistics than FRS and ASCVD in both men and women with an AUC of 0.65 (95% Confidence Interval (CI), 0.61-0.68) and 0.71 (95% CI, 0.68-0.74), respectively. The AUC for the ASCVD were 0.63 (95% CI, 0.59-0.66) for men and 0.69 (95% CI, 0.66-0.72) for women. The FRS has the lowest AUC of 0.59 (95% CI, 0.55-0.62) for men and 0.66 (95% CI, 0.63-0.70) for women.
Fig. 5.
Receiver-operator characteristic (ROC) curves for the discrimination of QRISKII, atherosclerotic cardiovascular disease (ASCVD), and the Framingham Risk Score (FRS) in women (left) and men (right).
Discussion
The electronic health data based QRISKII classified individuals who experienced adverse CVD events into higher risk groups more often than FRS or ASCVD. Although, all three risk scores placed those with CVD events in higher risk categories more often for men than in women, FRS, in particular, misclassified risk in women with CVD. These results demonstrate that improvements in risk prediction are needed and provide evidence that incorporating additional health data beyond the limited set of variables included in FRS and ASCVD may improve CVD risk stratification.
QRISKII was derived from electronic health data in the national UK database, QRESEARCH®, which was comprised of 531 practices in England and Wales [9]. QRISK includes more risk factors, accounts for missing data by assigning an average value, and is representative of the underlying population thus allowing a risk score to be calculated, even when data is missing. In contrast, the FRS was derived from the Framingham Heart Study cohort and has subsequently been widely applied in the clinical setting to predict risk of CVD and CHD. The FRS was derived from a middle-class white population and used risk factor data measured during a research study exam and thus does not account for missing data. The FRS has good predictive value for people who fit into the original Framingham population, but does not predict well for women and different ethnic groups [7]. Despite these issues, FRS has been widely applied in clinical practices across the US.
QRISKII and FRS were previously compared in different UK populations. One of the first studies compared the performance of QRISKII and the modified FRS equation recommended by NICE [21] in the national QRESEARCH® database [9]. Another validation comparing FRS [21] and QRISKII was carried out using the THIN database in the UK [22]. Both comparisons found that QRISKII performed better than FRS. QRISKII had improved discrimination and calibration, and was more accurate in identifying high risk populations [9, 22]. Results reported herein, supports the superior predictive value of QRISKII over the FRS. Furthermore, we demonstrate that QRISKII accurately predicts outcomes of patients in higher risk categories while misclassification was most extensive in FRS.
Similar to the FRS, the ASCVD was developed using data from research cohorts in the US. The ASCVD classified more patients as higher risk and was better at predicting outcomes than the FRS. The ASCVD was designed to include more cardiovascular outcomes and was developed in a more representative population. For these reasons, the ASCVD is replacing the FRS in clinical practice today. For the classification of patients, the ASCVD performed similarly to QRISKII; however, ASCVD is not able to account for missing data, and is specific to non-Hispanic African Americans and non-Hispanic whites [5].
Comparisons of QRISKII, the ASCVD, and FRS by sex have noted differences in classification and predictive value. One of the original FRS studies found that the FRS was a good predictor of CHD, but misclassified risk more often in women than in men [2]. This was validated in a second study done by D'Agostino et al., where the FRS performed better with sex-specific CVD functions, but under performed in women [4]. QRISK studies have also shown better performance in predicting risk in men than in women [7, 9, 22, 23]. Studies of the FRS and QRISKII have shown the overestimation of low risk categories in women and decreased calibration and discrimination [2, 4, 7, 9, 22, 23]. In a recent validation, the ASCVD was found to overestimate risk in women [24]. The Reynold's Risk Score for Women, another research-based risk score, is recommended for improved risk stratification in women [25]. The results of the current study support sex-differences in risk prediction as all three risk scores performed better in men compared to women. Therefore, the use of EHR data would open new opportunities to add sex-specific information such as pregnancy, reproductive history, and other sex-specific factors to improve risk prediction in women.
Strengths of our study include the population, the availability of Biobank questionnaire data, and the use of a surrogate for socioeconomic status to calculate QRISKII. Data came from a single community in which EHR data was available for all participants and the risk scores were applied as in clinical practice. The Biobank data also provided a link to family history, which is a component of QRISKII and not widely available in clinical practice. The HOUSES index provided socioeconomic status information to use as a surrogate for the Townsend deprivation scores in QRISKII. The correlation between these two measures of socioeconomic status and how well HOUSES works as a surrogate is unknown, which is a limitation to the study. Differences exist by score in regards to target age ranges, race/ethnicity, exclusion criteria, and event type and definition. Therefore, suboptimal use of a risk score could result in spurious claims regarding accuracy; however, since we applied the risk scores as is done in clinical practice our results reflect the performance in the real world and represents a unique comparison of common risk scores used in the US (FRS and ASCVD) and an electronic health data-based risk score (QRISKII). Furthermore, QRISKII, FRS, and ASCVD are based on ten-year predictions of CVD events and because of the decreased follow-up time, not all CVD events could have been included. Although we found that QRISKII has a higher AUC score, the confidence intervals for the AUC scores overlapped, which could be due to the small amount of events. Finally, the potential volunteer bias within the Biobank, the inability to obtain data about the age at the time of a heart attack in first degree relatives, the exclusively white population, and the use of only ICD-9 codes to define events may limit our study. However, diagnosis codes have been shown to be specific for stroke and myocardial infarction [26, 27].
The study showed that QRISKII, an electronic health record-based risk score, tended to classify persons who experienced an incident CVD event into higher risk groups as compared to the FRS. Furthermore, comparison of all three risk scores demonstrates that risk stratification of women is worse than in men. Leveraging EHR data for the use of additional clinical risk factors to develop and implement improved sex-specific risk scores would enhance our ability to target truly high risk groups for preventative measures.
Supplementary Material
Acknowledgments
Funding This study was made possible using the resources of the Rochester Epidemiology Project, which is supported by the National Institute on Aging of the National Institutes of Health under Award Number R01AG034676. The content is solely the responsibility of the authors and does not necessarily represent the official views of the National Institutes of Health. The Mayo Clinic Biobank is supported by the Mayo Clinic Center for Individualized Medicine.
Abbreviations
- AF
Atrial fibrillation
- ASCVD
Atherosclerotic cardiovascular disease
- BMI
Body mass index
- CVD
Cardiovascular disease
- CHD
Coronary heart disease
- CKD
Chronic kidney disease
- EHR
Electronic health record
- HITECH
Health Information Technology for Economic and Clinical Health
- HOUSES
Housing data
- FRS
Framingham Risk Score
- HDL
High density lipoprotein
- MI
Myocardial infarction
- RA
Rheumatoid arthritis
- REP
Rochester Epidemiology Project
- UK
United Kingdom
- US
United States
Footnotes
The online version contains supplementary material which is available to authorized users.
Conflict of Interest All authors have reported that they have no relationships to disclose.
Human subjects/informed consent statement All procedures followed were in accordance with the ethical standards of the responsible committee on human experimentation (institutional and national) and with the Helsinki Declaration of 1975, as revised in 2000. All research procedures were approved by the Institutional Review Committee of the Mayo Clinic and the participants provided written and informed consent for general research.
No animal studies were carried out by the authors for this article.
References
- 1.Go AS, Mozaffarian D, Roger VL, Benjamin EJ, Berry JD, Blaha MJ, Dai S, Ford ES, Fox CS, Franco S, Fullerton HJ, Gillespie C, Hailpern SM, Heit JA, Howard VJ, et al. Heart disease and stroke statistics--2014 update: a report from the American Heart Association. Circulation. 2014;129(3):e28–e292. doi: 10.1161/01.cir.0000441139.02102.80. [DOI] [PMC free article] [PubMed] [Google Scholar]
- 2.Wilson PW, D'Agostino RB, Levy D, Belanger AM, Silbershatz H, Kannel WB. Prediction of coronary heart disease using risk factor categories. Circulation. 1998;97(18):1837–1847. doi: 10.1161/01.cir.97.18.1837. [DOI] [PubMed] [Google Scholar]
- 3.D'Agostino RB, Sr., Grundy S, Sullivan LM, Wilson P. Validation of the Framingham coronary heart disease prediction scores: results of a multiple ethnic groups investigation. JAMA. 2001;286(2):180–187. doi: 10.1001/jama.286.2.180. [DOI] [PubMed] [Google Scholar]
- 4.D'Agostino RB, Sr., Vasan RS, Pencina MJ, Wolf PA, Cobain M, Massaro JM, Kannel WB. General cardiovascular risk profile for use in primary care: the Framingham Heart Study. Circulation. 2008;117(6):743–753. doi: 10.1161/CIRCULATIONAHA.107.699579. [DOI] [PubMed] [Google Scholar]
- 5.Goff DC, Jr., Lloyd-Jones DM, Bennett G, Coady S, D'Agostino RB, Gibbons R, Greenland P, Lackland DT, Levy D, O'Donnell CJ, Robinson JG, Schwartz JS, Shero ST, Smith SC, Jr., Sorlie P, et al. 2013 ACC/AHA guideline on the assessment of cardiovascular risk: a report of the American College of Cardiology/American Heart Association Task Force on Practice Guidelines. Circulation. 2014;129(25 Suppl 2):S49–73. doi: 10.1161/01.cir.0000437741.48606.98. [DOI] [PubMed] [Google Scholar]
- 6.Hippisley-Cox J, Coupland C, Robson J, Brindle P. Derivation, validation, and evaluation of a new QRISK model to estimate lifetime risk of cardiovascular disease: cohort study using QResearch database. BMJ. 2010;341:c6624. doi: 10.1136/bmj.c6624. [DOI] [PMC free article] [PubMed] [Google Scholar]
- 7.Hippisley-Cox J, Coupland C, Vinogradova Y, Robson J, May M, Brindle P. Derivation and validation of QRISK, a new cardiovascular disease risk score for the United Kingdom: prospective open cohort study. BMJ. 2007;335(7611):136. doi: 10.1136/bmj.39261.471806.55. [DOI] [PMC free article] [PubMed] [Google Scholar]
- 8.Zhao D, Liu J, Xie W, Qi Y. Cardiovascular risk assessment: a global perspective. Nature reviews Cardiology. 2015;12(5):301–311. doi: 10.1038/nrcardio.2015.28. [DOI] [PubMed] [Google Scholar]
- 9.Hippisley-Cox J, Coupland C, Vinogradova Y, Robson J, Minhas R, Sheikh A, Brindle P. Predicting cardiovascular risk in England and Wales: prospective derivation and validation of QRISK2. BMJ. 2008;336(7659):1475–1482. doi: 10.1136/bmj.39609.449676.25. [DOI] [PMC free article] [PubMed] [Google Scholar]
- 10.Blumenthal D, Tavenner M. The “meaningful use” regulation for electronic health records. New England Journal of Medicine. 2010;363(6):501–504. doi: 10.1056/NEJMp1006114. [DOI] [PubMed] [Google Scholar]
- 11.Bielinski SJ, Pathak J, Carrell DS, Takahashi PY, Olson JE, Larson NB, Liu H, Sohn S, Wells QS, Denny JC, Rasmussen-Torvik LJ, Pacheco JA, Jackson KL, Lesnick TG, Gullerud RE, et al. A robust e-Epidemiology tool in phenotyping heart failure with differentiation for preserved and reduced ejection fraction: the electronic Medical Records and Genomics (eMERGE) Network. Journal of cardiovascular translational research. 2015;8(8):475–483. doi: 10.1007/s12265-015-9644-2. [DOI] [PMC free article] [PubMed] [Google Scholar]
- 12.Krishnamoorthy P, Gupta D, Chatterjee S, Huston J, Ryan JJ. A review of the role of electronic health record in genomic research. Journal of cardiovascular translational research. 2014;7(8):692–700. doi: 10.1007/s12265-014-9586-0. [DOI] [PubMed] [Google Scholar]
- 13.Rasmussen LV. The electronic health record for translational research. Journal of cardiovascular translational research. 2014;7(6):607–614. doi: 10.1007/s12265-014-9579-z. [DOI] [PMC free article] [PubMed] [Google Scholar]
- 14.Kho AN, Pacheco JA, Peissig PL, Rasmussen L, Newton KM, Weston N, Crane PK, Pathak J, Chute CG, Bielinski SJ, Kullo IJ, Li R, Manolio TA, Chisholm RL, Denny JC. Electronic medical records for genetic research: results of the eMERGE consortium. Science Translational Medicine. 2011;3(79):79re71. doi: 10.1126/scitranslmed.3001807. [DOI] [PMC free article] [PubMed] [Google Scholar]
- 15.Newton KM, Peissig PL, Kho AN, Bielinski SJ, Berg RL, Choudhary V, Basford M, Chute CG, Kullo IJ, Li R, Pacheco JA, Rasmussen LV, Spangler L, Denny JC. Validation of electronic medical record-based phenotyping algorithms: results and lessons learned from the eMERGE network. Journal of the American Medical Informatics Association. 2013;20(e1):e147–154. doi: 10.1136/amiajnl-2012-000896. [DOI] [PMC free article] [PubMed] [Google Scholar]
- 16.Roger VL. Of the Importance of Motherhood and Apple Pie: What Big Data Can Learn From Small Data. Circulation Cardiovascular quality and outcomes. 2015;8(4):329–331. doi: 10.1161/CIRCOUTCOMES.115.002115. [DOI] [PubMed] [Google Scholar]
- 17.Olson JE, Ryu E, Johnson KJ, Koenig BA, Maschke KJ, Morrisette JA, Liebow M, Takahashi PY, Fredericksen ZS, Sharma RG, Anderson KS, Hathcock MA, Carnahan JA, Pathak J, Lindor NM, et al. The Mayo Clinic Biobank: a building block for individualized medicine. Mayo Clinic Proceedings. 2013;88(9):952–962. doi: 10.1016/j.mayocp.2013.06.006. [DOI] [PMC free article] [PubMed] [Google Scholar]
- 18.Kho AN, Hayes MG, Rasmussen-Torvik L, Pacheco JA, Thompson WK, Armstrong LL, Denny JC, Peissig PL, Miller AW, Wei WQ, Bielinski SJ, Chute CG, Leibson CL, Jarvik GP, Crosslin DR, et al. Use of diverse electronic medical record systems to identify genetic risk for type 2 diabetes within a genome-wide association study. Journal of the American Medical Informatics Association. 2012;19(2):212–218. doi: 10.1136/amiajnl-2011-000439. [DOI] [PMC free article] [PubMed] [Google Scholar]
- 19.Juhn YJ, Beebe TJ, Finnie DM, Sloan J, Wheeler PH, Yawn B, Williams AR. Development and initial testing of a new socioeconomic status measure based on housing data. Journal of Urban Health. 2011;88(5):933–944. doi: 10.1007/s11524-011-9572-7. [DOI] [PMC free article] [PubMed] [Google Scholar]
- 20.Carletta J. Assessing agreement on classification tasks: the kappa statistic. Computational Linguistics. 1996;22(2):249–254. [Google Scholar]
- 21.National Institute for Health and Care Excellence Cardiovascular disease: risk assessment and reduction, including lipid modification. [November 13, 2015];NICE Guidelines [CG181] Published 18 July 2014. http://www.nice.org.uk/guidance/cg181.
- 22.Collins GS, Altman DG. An independent and external validation of QRISK2 cardiovascular disease risk score: a prospective open cohort study. BMJ. 2010;340:c2442. doi: 10.1136/bmj.c2442. [DOI] [PMC free article] [PubMed] [Google Scholar]
- 23.Hippisley-Cox J, Coupland C, Vinogradova Y, Robson J, Brindle P. Performance of the QRISK cardiovascular risk prediction algorithm in an independent UK sample of patients from general practice: a validation study. Heart. 2008;94(1):34–39. doi: 10.1136/hrt.2007.134890. [DOI] [PubMed] [Google Scholar]
- 24.Muntner P, Colantonio LD, Cushman M, Goff DC, Jr., Howard G, Howard VJ, Kissela B, Levitan EB, Lloyd-Jones DM, Safford MM. Validation of the atherosclerotic cardiovascular disease Pooled Cohort risk equations. JAMA. 2014;311(14):1406–1415. doi: 10.1001/jama.2014.2630. [DOI] [PMC free article] [PubMed] [Google Scholar]
- 25.Mosca L, Benjamin EJ, Berra K, Bezanson JL, Dolor RJ, Lloyd-Jones DM, Newby LK, Pina IL, Roger VL, Shaw LJ, Zhao D, Beckie TM, Bushnell C, D'Armiento J, Kris-Etherton PM, et al. Effectiveness-based guidelines for the prevention of cardiovascular disease in women--2011 update: a guideline from the American Heart Association. Journal of the American College of Cardiology. 2011;57(12):1404–1423. doi: 10.1016/j.jacc.2011.02.005. [DOI] [PMC free article] [PubMed] [Google Scholar]
- 26.McCormick N, Lacaille D, Bhole V, Avina-Zubieta JA. Validity of myocardial infarction diagnoses in administrative databases: a systematic review. PLoS ONE. 2014;9(3):e92286. doi: 10.1371/journal.pone.0092286. [DOI] [PMC free article] [PubMed] [Google Scholar]
- 27.McCormick N, Bhole V, Lacaille D, Avina-Zubieta JA. Validity of Diagnostic Codes for Acute Stroke in Administrative Databases: A Systematic Review. PLoS ONE. 2015;10(8):e0135834. doi: 10.1371/journal.pone.0135834. [DOI] [PMC free article] [PubMed] [Google Scholar]
Associated Data
This section collects any data citations, data availability statements, or supplementary materials included in this article.


