

Abstract
Impulsive choice is typically measured by presenting smaller-sooner (SS) versus larger-later (LL) rewards, with biases towards the SS indicating impulsivity. The current study tested rats on different impulsive choice procedures with LL delay manipulations to assess same-form and alternate-form test-retest reliability. In the systematic-GE procedure (Green & Estle, 2003), the LL delay increased after several sessions of training; in the systematic-ER procedure (Evenden & Ryan, 1996), the delay increased within each session; and in the adjusting-M procedure (Mazur, 1987), the delay changed after each block of trials within a session based on each rat’s choices in the previous block. In addition to measuring choice behavior, we also assessed temporal tracking of the LL delays using the median times of responding during LL trials. The two systematic procedures yielded similar results in both choice and temporal tracking measures following extensive training, whereas the adjusting procedure resulted in relatively more impulsive choices and poorer temporal tracking. Overall, the three procedures produced acceptable same form test-retest reliability over time, but the adjusting procedure did not show significant alternate form test-retest reliability with the other two procedures. The results suggest that systematic procedures may supply better measurements of impulsive choice in rats.
Keywords: impulsive choice, delay discounting, individual differences, temporal tracking, rats
Cognitive impulsivity is a factor that influences maladaptive behaviors such as gambling (Alessi & Petry, 2003; Petry & Casarella, 1999), smoking (Mitchell, 1999), Attention Deficit Hyperactivity Disorder (ADHD; Neef et al., 2005), obesity (Boomhower, Rasmussen, & Doherty, 2013; Weller, Cook, Avsar, & Cox, 2008), and drug abuse (Bickel & Marsch, 2001). Impulsive choice, one key aspect of cognitive impulsivity, is typically measured by presenting a choice between a smaller-sooner (SS) and a larger-later (LL) reward (Mazur, 2007). In this case, the individual must decide which reward is preferable by assessing the value of one reward in comparison to the other, trading off different amounts versus different delays. If an individual chooses the immediate reward more than the delayed, particularly in cases where the delayed reward is objectively more valuable, then the individual is characterized as impulsive because they prefer relatively more immediate rewards (Ainslie, 1974).
The most well accepted process that is thought to underlie impulsive choice behaviors is delay discounting, which presumes that rewards that are more distant in time are less valuable (Kinloch & White, 2013; Mazur, 1987). Several models of delay discounting have been posited including the standard discounted utility model, the hyperbolic model, and the exponential model (Mazur, 1987; Samuelson, 1937). However, the hyperbolic discounting model provides a better fit on a group and individual level than the exponential model (Myerson & Green, 1995; Rachlin, Raineri, & Cross, 1991). Therefore, delay discounting is posited to take a hyperbolic form according to the following equation: V = A/(1 + kD). In this discounting model (Mazur, 2001), V indicates the subjective value of the reward, A the amount of the reward, and D the delay to reward. The discounting rate, a purported individual difference variable (Odum, 2011a, 2011b; Odum & Baumann, 2010), is modeled by the free parameter k.
Procedures used to study impulsive choice/delay discounting manipulate the SS or LL delay and/or magnitude in different ways. The most commonly used real-time measures of impulsive choice can be separated into two main classes of procedures – systematic procedures and adjusting procedures. Systematic procedures deliver a determined set of parameters (Evenden & Ryan, 1996; Green & Estle, 2003) akin to the method of constant stimuli used in psychophysics research, while adjusting procedures are dependent on the subject’s choices (Mazur, 1987) akin to the staircase method in psychophysics. In addition, within each class of procedures there are variations in the number of trials delivered with a particular set of parameters before changing the delays or magnitudes, varying from only a few trials to many sessions.
While each procedure differs in some respects, it is widely assumed that all of the procedures assess the same construct (e.g., Torres et al., 2011). There are a few studies that have obtained similar measurements with variations in procedures. For example, adjusting amount and adjusting delay procedures yield comparable measures of impulsive choice in both humans (Holt, Green, & Myerson, 2012) and pigeons (Green, Myerson, Shah, Estle, & Holt, 2007), which suggests that similar processes may be invoked in both procedures. In addition, procedures that manipulate the SS amount versus the LL amount produce similarities in impulsive choice behavior in humans (Rodzon, Berry, & Odum, 2011). On the other hand, when comparing two different adjusting procedures, although similar overall estimates of delay discounting were obtained, gradual (steady state) adjustments were more sensitive in detecting differences among Lewis and Fischer 344 rat strains compared to rapid adjustments (Stein, Pinkston, Brewer, Francisco, & Madden, 2012). This suggests that procedural differences may produce varying results in some instances.
More recently, Craig, Maxfield, Stein, Renda, and Madden (2014) compared adjusting and systematic procedures with manipulations of delay, the first study to examine this issue, and concluded that both procedures measured a similar underlying process. However, they suggested that the systematic procedure was the most appropriate measure of impulsive choice because their adaptation of the systematic procedure allowed for the examination of choice at a 0-s delay and the adjusting procedure only allowed for a single delay to be examined. On the other hand, the previous studies comparing measures of delay discounting have not recommended an optimal method of evaluation. Epstein et al. (2003) professed that there is “no ‘gold standard’ for measuring the value of k, it is not possible to determine which measure is the most accurate measure of discounting” (p. 137).
While there is some previous precedent for examining procedural variations in choice behavior, one issue that has not been addressed is test-retest reliability in rats. In humans, same-form test-retest reliability for impulsive choice measures, which assesses stability in individual differences over time (i.e., the most impulsive individuals within a sample remain the most impulsive), has been generally observed in the .6–.7 range over periods ranging from 1 week to 1 year, comparable to other trait variables (Baker, Johnson, & Bickel, 2003; Jimura et al., 2011; Johnson, Bickel, & Baker, 2007; Kirby, 2009; Matusiewicz, Carter, Landes, & Yi, 2013; Ohmura, Takahashi, Kitamura, & Wehr, 2006; Peters & Büchel, 2009). There has been some recent indication of trait-level impulsive choice in rats in that individual differences in choices showed stability across different choice parameters within a procedure (Galtress, Garcia, & Kirkpatrick, 2012; Garcia & Kirkpatrick, 2013; Marshall, Smith, & Kirkpatrick, 2014). However, direct evidence of same-form test-retest reliability remains to be determined for rats. A related issue is the assessment of alternate-form test-retest reliability, which assesses stability of individual differences in impulsive choice across procedures (i.e., the most impulsive individuals within a sample tested on procedure 1 should also be the most impulsive when tested on procedure 2). Alternate-form test-retest reliability is critical for determining whether different procedures may measure the same construct, an issue that has been largely overlooked in rats.
To address the current gaps in the literature, the present experiment tested rats on two systematic procedures and one adjusting procedure, all of which manipulated the delay to the LL reward to measure impulsive choice behavior. In each of the procedures, the rats were trained to choose between a one-pellet food reward that was available after 5 s (the SS) and a two-pellet reward available after a longer delay (the LL). The systematic-GE (SYS-GE) procedure was adapted from Green and Estle (2003) and involved increases in the LL delay across phases of several sessions each. The systematic-ER (SYS-ER) procedure was adapted from Evenden and Ryan (1996) where the LL delay was increased within each session, and the order of the delays was always the same across sessions. Finally, the adjusting-M (ADJ-M) procedure was adapted from Mazur (1987) and adjusted the LL delay based on the rat’s choices within a block of trials, with the LL delay increasing, decreasing or remaining the same for the next block. Thus, the three procedures were delivered in an identical fashion except for the nature of the LL delay changes.
We assessed internal reliability across testing of different delays in the two systematic procedures, mirroring recent work from our laboratory examining stability of choice behavior across parameters within the same procedure (Marshall et al., 2014). In addition, we assessed same-form test-retest reliability within each procedure over delays of approximately 1 and 5 months to determine whether each procedure resulted in stable estimates of individual differences in impulsive choice. Finally, we assessed alternate-form test-retest reliability for each pair of procedures to determine whether the procedures yielded comparable measures of impulsive choice. The combination of the different reliability assessments provided a comprehensive picture of the measurement of individual differences in choice behavior both within and between the distinct choice procedures.
In addition to measuring choice behavior, we also examined temporal tracking of the changes in LL delay. A growing body of research has suggested a key role for timing processes in impulsive choice behavior (Baumann & Odum, 2012; Galtress et al., 2012; Marshall et al., 2014; McClure, Podos, & Richardson, 2014; McGuire & Kable, 2013; Smith, Marshall, & Kirkpatrick, in press; Wittmann & Paulus, 2008), suggesting that learning of the delays to reward may be critical for determining impulsive choice. With regard to the three procedures tested here, we hypothesized that the SYS-GE procedure would promote learning of the specific delays due to the long exposure period with each pair of delays and that this might promote more stable choice behavior (Marshall et al., 2014; Smith et al., in press). We also expected that the SYS-ER procedure would allow for learning of the series of deliveries within a session, as rats have been shown to track predictable changes in delays to reward (Church & Lacourse, 1998; Crystal, Church, & Broadbent, 1997; Ludvig & Staddon, 2004). Additionally, we expected to observe poorer temporal tracking of the delays in the ADJ-M procedure. Adjusting procedures have been criticized because the results may not be indicative of a response to delay but rather a result of random behavior because the rats do not have sufficient exposure to the choices to learn about them (Cardinal, Daw, Robbins, & Everitt, 2002). In addition, a pilot study from our laboratory (Hill, Peterson, & Kirkpatrick, 2013, March), comparing the SYS-ER and ADJ-M procedures, suggested that temporal tracking of the delays was better for the systematic than the adjusting procedure. Given that timing has been emerging as an important cognitive process in impulsive choice behavior, the present results provided an opportunity to gain a better understand the role of timing processes in the different procedures.
Method
Animals
Forty eight male Sprague-Dawley rats (Charles River, Portage, MI) were used for this experiment. The rats were pair-housed in a colony room that was maintained on a 12:12 hr reversed light:dark cycle with lights off at 8 a.m. They were tested during the dark phase of the cycle. The rats had ad libitum access to water at all times, in both the home cages and experimental chambers. They were maintained at approximately 85% of their free feeding weights, based on growth curves obtained from the supplier, through the delivery of 45-mg pellets (BioServ, Flemington, NJ) in the experiment coupled with supplementary feedings of lab chow (LabDiet, Brentwood, MO) in their home cages.
Apparatus
The choice procedures were conducted in a set of 24 identical operant chambers (Med Associates, St. Albans, Vermont). Each chamber measured 25 x 30 x 30 cm and was housed inside of a ventilated, noise attenuating box measuring 74 x 38 x 60 cm. The chambers were located in two separate rooms, with 12 chambers in each room. Each chamber was equipped with two nose pokes, a houselight, two nose keys with cue lights, a food cup, and a water bottle. The houselight was positioned in the top-center of the back wall. Two levers (ENV-122CM) were situated on either side of the food cup at approximately one third of the total height of the chamber, with lever presses recorded by a microswitch. The nose poke keys with cue lights (ENV-119M-1) were located directly above each lever; nose key presses were recorded by a microswitch. A magazine pellet dispenser (ENV-203) delivered 45-mg food pellets (BioServ) into the food cup. Each head entry into the food cup was transduced by an LED-photocell. The water bottle was mounted outside the chamber; water was available through a metal tube that protruded through a hole in the lower-center of the back wall. Med-PC IV controlled experimental events and recorded the time of events with a 2-ms resolution.
Procedure
Initial training
Rats received one day of magazine training where food pellets were delivered on a random-time 60-s schedule. Approximately 120 pellets were delivered during a 2-hr session. Rats then received two lever press training sessions. Each session began with a fixed ratio 1 (FR1) schedule until 20 reinforcers were delivered on each of the two levers. Next, a random ratio 3 (RR3) schedule was used until the next 20 pellets were earned and the last 20 pellets were delivered on a RR5 schedule.
Impulsive Choice Training
The testing order and assignment of rats to the different procedures in Phases 1–4 is shown in Figure 1. In Phase 1, the rats were randomly assigned to receive one of three choice procedures (n = 16): a systematic procedure (SYS-GE) adapted from Green and Estle (2003), a systematic procedure (SYS-ER) adapted from Evenden and Ryan (1996), or an adjusting procedure (ADJ-M) adapted from Mazur (1987). In Phase 2, half of the rats from each Phase 1 group were randomly assigned to receive one of the other two procedures to assess alternate-form test-retest reliability. In Phase 3, rats repeated Phase 2 for same-form test-retest reliability comparisons following a 37-day rest period, a duration which matched the time between the onset of Phases 1 and 2. Finally, in Phase 4, rats returned to Phase 1 procedures for additional alternate-form (Phase 3 versus Phase 4) and same-form (Phase 1 versus Phase 4) test-retest reliability comparisons.
Figure 1.
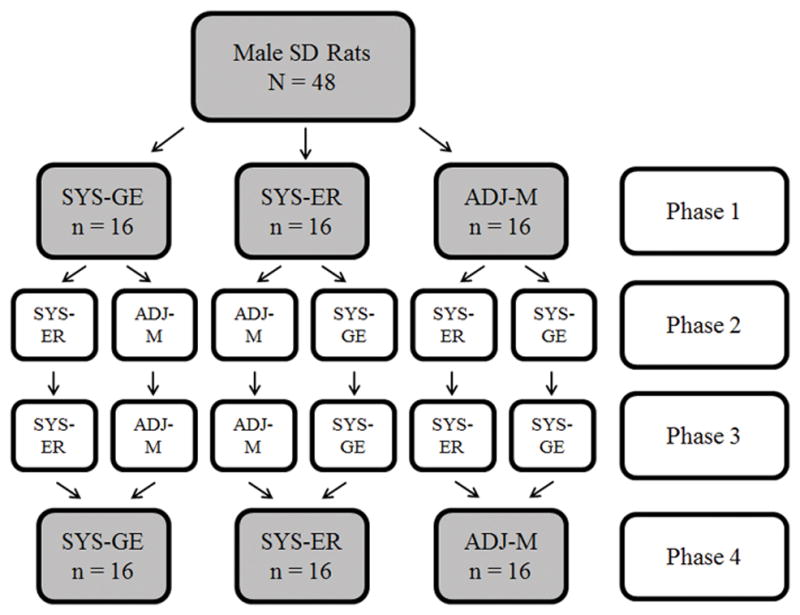
Experimental design for the different testing orders received by sub-groups of rats in Phases 1–4. There was a break in testing, lasting for approximately 1 month between Phases 2 and 3. SYS-GE = systematic procedure modeled after Green and Estle (2003); SYS-ER = systematic procedure modeled after Evenden and Ryan (1996); ADJ-M = adjusting procedure modeled after Mazur (1987).
Each session consisted of 20, 4-trial blocks, for a total of 80 trials. Each block contained 2 forced choice trials (1 SS and 1 LL) intermixed with 2 free choice trials (1 SS and 1 LL). The assignment of SS and LL outcomes to left and right levers was counterbalanced across rats. During forced choice trials, only one lever was inserted. A response on the lever resulted in the onset of the cue light above the chosen lever, which remained in the chamber for the trial duration. After the target delay elapsed, the next response on the lever resulted in cue light offset, lever withdrawal, and food delivery; thus, a response-initiated fixed-interval schedule was arranged. During free choice trials, both levers were inserted. A response on one of the levers resulted in the onset of the cue light above the chosen lever and the withdrawal of the alternate lever. The trial then progressed as with the forced choice trials. There was a 60-s fixed ITI that intervened between reinforcer delivery and the onset of the next trial. A fixed ITI was used because it more closely resembles real-life situations in that it allows for reward maximization (Odum, 2011a). In all cases, the SS delay was 5 s, but the procedures differed in the way that the LL delay was manipulated. The reward amounts were always fixed at 1 and 2 pellets for the SS and LL, respectively, in all phases of all procedures. The baseline testing consisted of 10 days in Phase 1 and five days in each subsequent phase.
SYS-GE procedure
During the first 10 sessions of baseline training, a choice on the SS lever delivered 1 pellet after a 5-s delay, and a choice on the LL lever delivered 2 pellets after a 5-s delay. Twenty sessions followed in which the LL delay increased in a series: 5, 15, 30, and 60 s. Each LL delay was delivered for 5 sessions.
SYS-ER
During the first 10 sessions of baseline training, a choice on the LL lever resulted in 2 pellets after a 5-s delay. The rats were then tested for 20 sessions with LL delays that increased every fifth block (i.e., after five 4-trial blocks = 20 trials) within the session: 5, 15, 30, and 60 s. Each rat experienced each delay during a single session and the series was always the same.
ADJ-M procedure
The adjusting delay (ADJ-M) procedure delivered the same trial types as the systematic procedures, but involved frequent adjustments of the LL delay based on choice behavior. As with the other procedures the LL delay began at 5 s for the first 10 sessions of baseline training. For the remaining 20 sessions, the LL delay changed based on the rat’s behavior on the free choice trials. Each 4-trial block involved two forced choice trials (1 SS and 1 LL, randomly ordered) and 2 free choice trials. The LL delay for the next block increased by 1 s if there were 2 LL choices in the previous block, decreased by 1 s if there were 2 SS choices, and remained the same if there was 1 SS and 1 LL choice in the previous block. There was no limit on the maximum LL delay, but the lower bound was 5 s. For the first session of adjusting delay, the LL began at 5 s and for subsequent sessions, the initial LL delay was the same as the last LL delay of the previous session.
Data Analysis
Impulsive Choice
A measure of impulsive choice that is common across tasks is the Point of Subjective Equality (PSE), or indifference point, which is the point at which the rat made an equal number of SS and LL choices, which is assumed to reflect the delay at which the rat considered the two options to be equal (Mazur, 1987). PSEs have previously been used to compare results from systematic procedures to the indifference points obtained from adjusting procedures (Craig et al., 2014). We calculated the PSE for each rat in each procedure. The PSE for the systematic procedures was determined using a linear regression fit to the impulsive choice curves for each individual rat. The linear regression fits were generally good, with R2 = .85 (SD = .09) for SYS-GE and R2 = .86 (SD = .11) for SYS-ER. The LL delay at which the regression line crossed 50% was recorded as the PSE. Rats with PSE values obtained from the two systematic procedures that were outside of the range of LL delays delivered (5–60 s) were excluded from this analysis, one rat was excluded in Phase 1 and four rats were excluded in Phases 2 through 4. For the ADJ-M procedure, the PSE was equal to the mean LL delay. To ensure comparable data, the last 2 days from each of the four delays in SYS-GE procedure was used and the final 8 days of data from SYS-ER and ADJ-M were included in the analyses. The PSEs were subjected to an analysis of variance (ANOVA) to compare the choice behavior across tasks within a phase. We also performed repeated measures ANOVAs on the PSEs to assess changes in individuals across phases.
In addition, we calculated the percentage of LL choices for the different LL delays and used repeated measures ANOVAs to compare the percentage of LL choices in the two systematic procedures.
Effect size measurements were included for all significant effects, using a partial eta-squared (ηp2) measurement. Typically, ηp2 < .1 are considered as small effect sizes, ηp2 between .1 and .2 as medium effect sizes, and ηp2 > .2 as large effect sizes, but the interpretation of the effect sizes varies somewhat depending on the number and type of factors used in the analyses (see Bakeman, 2005; Olejnik & Algina, 2003 for more details).
Reliability measures
We used Cronbach’s Alpha α for the systematic procedures to determine the reliability of the percentage of LL choices across delays in the two systematic procedures as a measure of internal reliability of individual differences. The Cronbach’s alpha is a cross-correlation metric that ranges from 0 to 1 with values of .7 or greater indicating acceptable to excellent reliability, values in the .5–.7 range indicating borderline acceptability, and values less than .5 indicating unacceptable reliability (see George & Mallery, 2003 for more details). This test was not conducted on the ADJ-M procedure due to the adjusting nature of the delay. Because the delay in subsequent blocks (or indeed in subsequent sessions) was dependent on previous delays, this induced a correlation in performance over time, making the internal reliability test inappropriate to use in this case.
In addition, we conducted a same form test-retest reliability determination by assessing Pearson’s correlations of the individual rat’s PSEs in Phase 2 versus Phase 3 and Phase 1 versus Phase 4. We also computed alternate form test-retest reliability measurements by assessing Pearson’s correlations of the PSEs in Phase 1 versus Phase 2 and Phase 3 versus Phase 4.
Temporal tracking
To assess temporal tracking of the LL delays in each procedure, we analyzed the timing of responses during LL forced choice trials (i.e., responding during the response-initiated fixed-interval schedule). We determined the time of the median response in each trial, which is a measure of the middle point of responding during a fixed interval duration (Guilhardi & Church, 2004). ANOVAs were used to compare the overall median response time in the three procedures in each phase, and also to compare the median response time in the two systematic procedures as a function of LL delay. Finally, the median response time on each trial was correlated (using Pearson’s r) with the LL delay on the corresponding trial. The correlations were subjected to an ANOVA comparing the three procedures.
Statistical Analyses
All statistical analyses were conducted in SPSS. A target threshold of p < .05 was set for reporting of significant results. The data were evaluated using the Shapiro-Wilk test for normality and Levene’s test for homogeneity of variance for each ANOVA. Greenhouse-Geisser corrections were used in cases of sphericity violations in the repeated measures ANOVAs. Games-Howell corrections were used in cases of unequal variance for t-tests.
Results
Point of Subjective Equality
The mean (±SEM) PSE measures for the three procedures are shown in Figure 2 for each of the four phases of testing. ANOVAs with the between-subjects variable of procedure conducted on each phase indicated significant effects of procedure in all four phases: F(2,44) = 4.0, p = .026, ηp2= .15, F(2,41) = 3.4, p = .044, ηp2= .14, F(2,41) = 14.5, p < .001, ηp2= .42, and F(2,41) = 4.7, p < .015, ηp2= .19. Tukey post-hoc tests revealed that ADJ-M produced lower PSE measures compared to the SYS-GE (Phases 1, 3 and 4) and SYS-ER (Phase 3) procedures. The SYS-GE and SYS-ER procedures did not significantly differ in any of the phases. In Phase 2, post hoc analyses did not indicate a significant difference between any of the groups, although the trends were in the same direction as the other phases.
Figure 2.
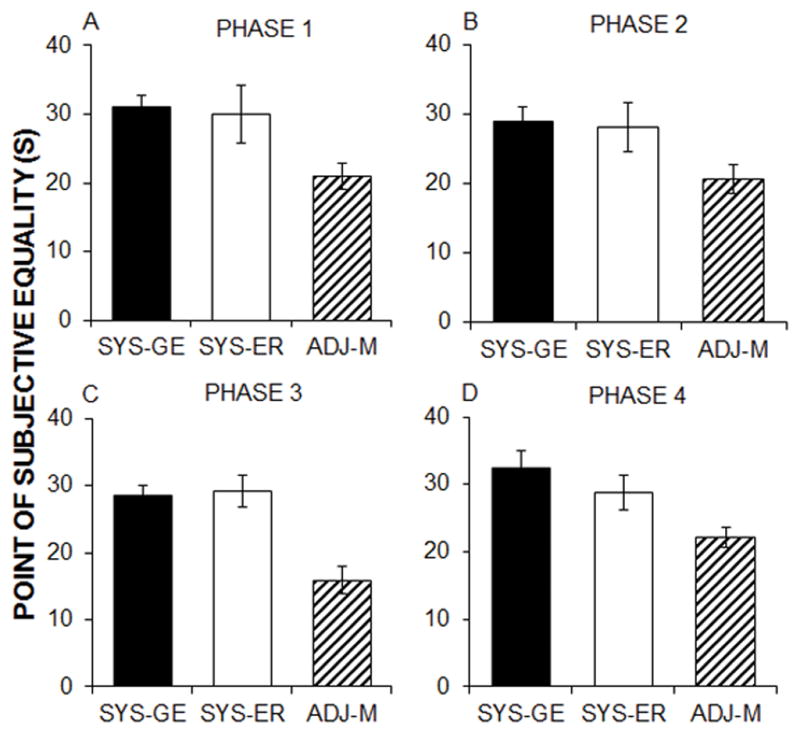
Mean ± standard error of the mean (SEM) of the point of subjective equality (PSE) for each procedure in Phase 1 (A), Phase 2 (B), Phase 3 (C), and Phase 4 (D).
Test-Retest Reliability
Correlations were used to examine test-retest reliability in same-form and alternate-form tests using the PSE measure for individual rats.
Same-Form Test-Retest
Same-form test-retest reliability was examined by correlating the PSE measurements for individual rats from Phase 1 versus Phase 4 and Phase 2 versus Phase 3. As seen in Figure 3A and 3B, the individual rats were reasonably consistent in their performance on the procedures when tested at different time points. Accordingly, Phases 1 and 4 were positively correlated for the ADJ-M and the SYS-GE procedures, r = .75, p = .002 and r = .82, p < .001, respectively. However, the SYS-ER procedure was not significantly related between these two phases (r = .34, p = .222; Figure 3A). Phase 2 and Phase 3 PSE measures were positively correlated for the ADJ-M procedure, r = .75, p = .001, the SYS-GE procedure, r = .67, p = .006, and the SYS-ER procedure, r = .76, p = .003 (Figure 3B).
Figure 3.

Panels A and B: Same-form test-retest comparing the point of subjective (PSE) measurements for each of the three procedures in Phase 1 versus Phase 4 (A) and Phase 2 versus Phase 3 (B). The same-form comparisons are the correlations of the PSEs obtained from individual rats when tested on the same procedure in two different phases. Panels C and D: Alternate-form test-retest comparing the PSEs across pairs of procedures in Phase 1 versus Phase 2 (C) and Phase 3 versus Phase 4 (D). The alternate form comparisons are the correlations of the PSEs for the same rats when tested on different procedures in successive phases. PH = Phase and PROC = Procedure.
Alternate-Form Test-Retest
The alternate form test-retest results are shown in the bottom row of Figure 3. A correlation of the PSEs obtained from individual rats tested on pairs of procedures delivered in Phases 1 and 2 revealed a positive correlation between the two systematic procedures, r = .61, p = .019 and between the ADJ-M and SYS-GE procedures, r = .50, p = .049 (Figure 3C). There was no correlation between the PSE measures in the ADJ-M and SYS-ER procedures, r = .21, p = .465. A correlational analysis between the procedures delivered in Phases 3 and 4 revealed a strong positive relationship between the two systematic procedures, r = .90, p < .001 (Figure 3D). There was no correlation between the ADJ-M and the either of the systematic procedures (ADJ-M and SYS-ER, r = .08, p = .78 and ADJ-M and SYS-GE, r = .42, p = .106.
Percentage of LL Choices
The percentage of LL choices made by each group of rats in the systematic procedures at each delay was compared using a repeated-measures ANOVA for each of the four phases; these data are shown in Figure 4. In Phase 1, there was a significant within subjects-effect of LL delay, F(1.7, 51.1) = 207.4, p <.001, ηp2 = .87. There was a significant interaction of Delay × Procedure F(1.7, 51.1) = 9.7, p = .001, ηp2 = .25 (Figure 4A). But, there was no main effect of procedure. Follow-up t-tests on the interaction revealed that the rats in the SYS-ER made significantly fewer LL choices at 5 and 15-s delays, t(15.9) = 3.8, p = .002 and t(30) = 3.5, p = .001, respectively. At the 60-s delay, the SYS-ER trained rats made significantly more LL choices than the rats in the SYS-GE procedure, t(18.9) = 3.1, p = .005. In Phase 2, 3 and 4, there was a significant difference in number of LL choices across delays F(2.2, 66.4) = 237.3, p < .001, ηp2 = .89, F(1.8, 53.5) = 358.4, p < .001, ηp2 = .92 and F(2, 59.1) = 252.0, p < .001, ηp2 = .89, respectively. There were no significant differences between the procedures in percentage of LL choice at any delay (Figure 4B–4D).
Figure 4.

Mean ± SEM percent LL choices as a function of LL delay for the SYS-ER and SYS-G procedures in Phases 1–4 (A–D). ADJ-M data are not shown because each rat experienced their own unique set of delays in each session.
Cronbach’s α was used to examine consistency of percent LL choice across delays in each phase for the two systematic procedures The SYS-ER procedure resulted in higher α in each phase than the SYS-GE procedure. SYS-ER results were α = .88, .87, .81, and .77 in phases 1 – 4, respectively. SYS-GE yielded α = .53, .67, .60, and .75, respectively.
Temporal Tracking
The overall time of the median response during the LL forced choice trials was calculated for each procedure in each phase (Figure 5). Separate ANOVAs conducted on each phase revealed a significant effect of procedure in Phase 1, F(2, 45) = 20.0, p < .001, ηp2 = .47, Phase 2, F(2, 45) = 5.3, p = .009, ηp2 = .19, Phase 3, F(2, 45) = 19.5, p < .001, ηp2 = .47, and Phase 4, F(2, 45) = 20.4, p < .001, ηp2 = .48. Tukey post-hoc analyses indicated that the ADJ-M procedure resulted in earlier median response times in comparison to the two systematic procedures in all phases (p < .05).
Figure 5.
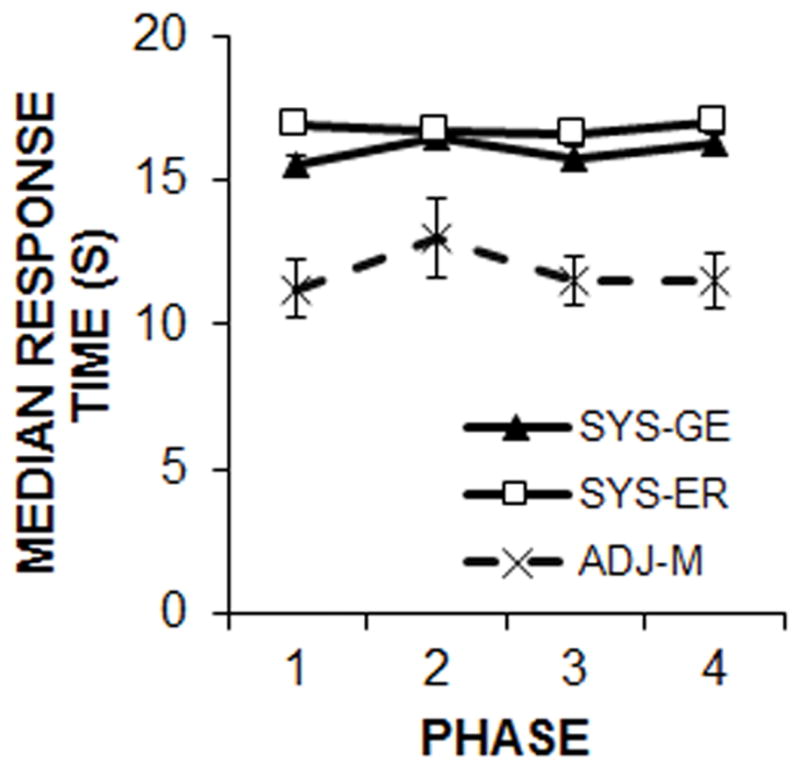
Mean ± SEM of the median response times during LL forced choice trials in the three procedures as a function of phase of training.
To further compare the median response times in the two systematic procedures, where a common set of LL delays were delivered, Figure 6 shows the median response time as a function of LL delay. The two systematic procedures both produced strong temporal tracking, with median response times increasing as a function of LL delay, and there were no differences between the procedures at any of the delays.
Figure 6.
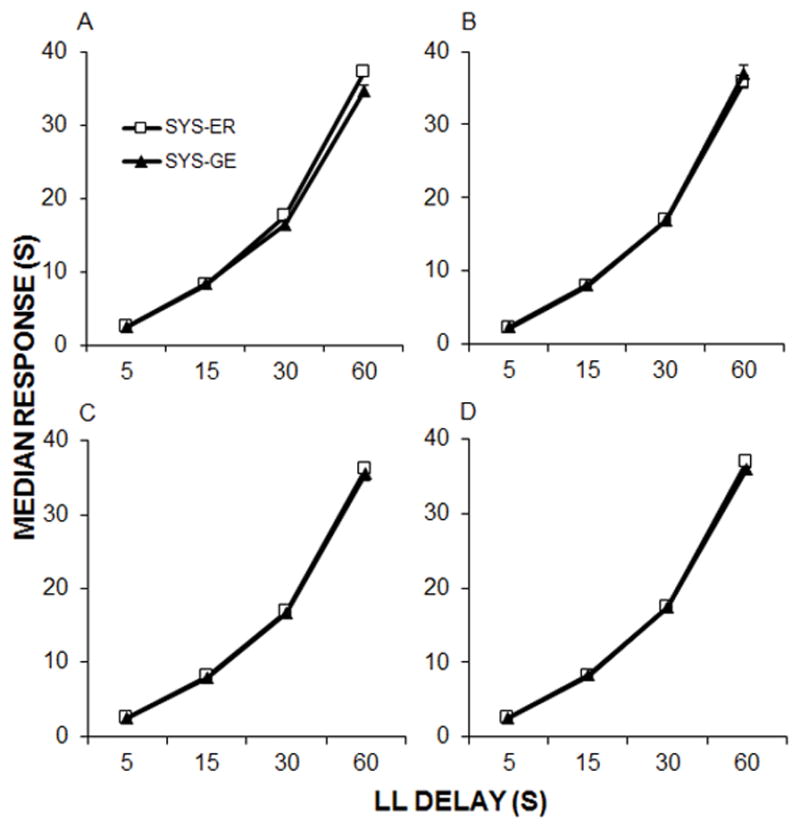
Mean ± SEM response times during LL forced choice trials as a function of delay in the two systematic procedures for each phase of training (A–D). ADJ-M data are not shown because each rat experienced their own unique set of delays in each session.
The correlation of the median response times on each LL forced choice trial with the LL delay is shown in Figure 7 as a further measure of temporal tracking of the LL delays in all three procedures in each phase. An ANOVA conducted on the correlations in each phase with the variable of procedure (between-subjects) indicated a significant main effect of procedure in Phase 1, F(2, 45) = 43.7, p < .001, ηp2 = .66, Phase 2, F(2, 45) = 51.2, p < .001, ηp2 = .70, Phase 3, F(2, 45) = 19.4, p < .001, ηp2 = .46, and Phase 4, F(2, 45) = 33.9, p < .001, ηp2 = .60. Tukey post-hoc analyses indicated that the ADJ-M procedure resulted in significantly lower correlations in all four phases compared to the two systematic procedures (p < .001), which did not differ.
Figure 7.
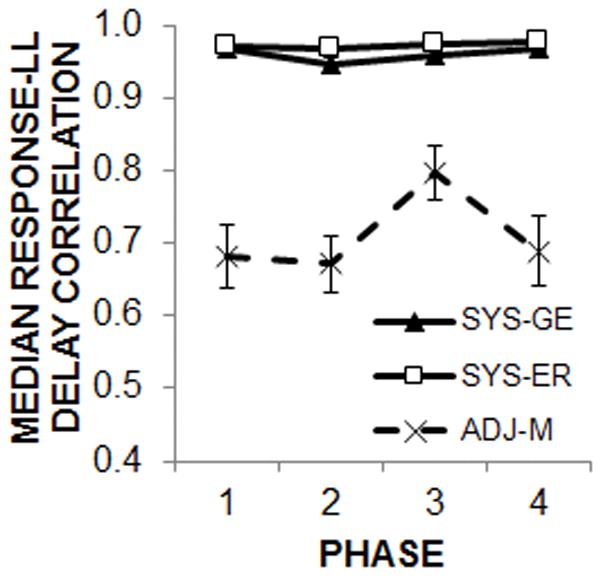
The mean correlation between the median response time and LL delay on individual LL forced choice trials for each of the procedures as a function of phase of training.
Discussion
The current study revealed some similarities, and also some differences, in performance across the three procedures. In comparing the two systematic procedures, the PSEs were generally similar (Figure 2), with both at around 30 s. For the SYS-ER, the internal reliability was higher than SYS-GE, which may have been due to the within-session manipulation of delay in SYS-ER. Both procedures showed significant same-form test-retest reliability when tested in adjacent phases (Phase 2 versus Phase 3, Figure 3B). However, when tested with an intervening period of approximately 5 months (Phase 1 versus Phase 4, Figure 3A), the SYS-GE showed significant same-form test-retest reliability, but the SYS-ER did not. These two procedures also were correlated in the alternate-form test-retest reliability measurements, and the strength of the correlation increased with further training (Phase 3 versus Phase 4, Figure 3D), indicating that the two procedures yielded similar measurements of impulsive choice. However, the SYS-ER procedure showed poorer discrimination of the LL delays, particularly in Phase 1 where their choice functions were flatter (Figure 4A). Over time, the SYS-ER procedure resulted in improved performance, showing results that were essentially indistinguishable from the SYS-GE in Phases 3 and 4 (Figures 4C and 4D). This suggests that the SYS-ER may require more training to achieve high quality discrimination performance. This may be the reason for the lack of significant same-form test-retest reliability in SYS-ER when comparing Phases 1 and 4, because the rats had not yet stabilized in their performance in Phase 1.
The SYS-ER may require more training because of its dynamic nature. In this procedure, the LL delay increased during each session, with the same order of delays delivered across sessions. It is possible that carry-over effects may have occurred because the rat became accustomed to the increase in delay at the end of the session and responded accordingly at the beginning of the next session, a criticism that has been previously leveled for this procedure (Fox, Hand, & Reilly, 2008; Madden, Smith, Brewer, Pinkston, & Johnson, 2008). On the other hand, the SYS-GE procedure only changed the LL delay after a set of several sessions, which may have allowed the rats to more quickly learn the choice options to a high standard.
In comparison to the two systematic procedures, the ADJ-M procedure resulted in systematically lower PSEs (Figure 2) in the 20–22 s range. Given that there is no objectively “correct” PSE, it is difficult to know whether this is a problem with the ADJ-M procedure. However, it is worth noting the differences in results because one should expect to overestimate impulsive choice behavior when using this procedure, in comparison to the estimates from the other two procedures. The ADJ-M did show good same-form test-retest reliability indicating that the measurements were consistent over time. However, in the alternate-form test-retest reliability assessment, the ADJ-M was only correlated with SYS-GE in Phases 1 and 2, suggesting that the ADJ-M may produce somewhat different measurements in comparison to the two systematic procedures. This may be due to the nature of the procedure, in which the LL delay changes frequently. It is possible that a slower rate of adjustment of the delay would yield results with better alternate-form test-retest reliability. In relation to this idea, Stein et al. (2012) found that slower rates of adjustment resulted in better sensitivity to detect strain differences between Lewis and Fischer 344 rats.
The positive same-form test-retest reliability lends further support that impulsive choice behavior is a stable trait in rats, consistent with other recent research (Galtress et al., 2012; Garcia & Kirkpatrick, 2013; Marshall et al., 2014). The present work expands on these previous findings by showing that same-form test-retest that was present up to 5 months for SYS-GE and ADJ-M, and for approximately 1 month in all three procedures. This indicates stability in measurements over spans of time that encompass a significant portion of the lifespan of the rat. The results lend further support to the use of the rat model for studying stable individual differences in impulsive choice behavior.
Temporal tracking of the LL delays was also examined to determine whether there were any differences in procedures in promoting the ability to learn the delays to reward. The rats did show evidence of temporal tracking in all three procedures, but they were substantially better at temporal tracking in the two systematic procedures (Figures 6 and 7). The two systematic procedures resulted in later overall median response times than the ADJ-M procedure (Figure 5), most likely due to the ADJ-M group experiencing shorter delays on average compared to the other two groups (see PSE measure in Figure 2).
The poor temporal tracking in the ADJ-M procedure suggests that the rats may be affected by other factors in their decision making rather than learning the specific LL delays (at least learning them to a high standard). For example, the rats could use local reward rates or recent choice outcomes to guide their choices. This could potentially explain the differences in PSEs in the ADJ-M compared to the other two procedures, and poorer alternate-form test-retest reliability, because the rats may be basing their decisions on different information, using temporal tracking in the systematic procedures, but using reward rates (or recent outcomes) in the adjusting procedure. In addition, another possibility was suggested by Cardinal et al (2002) in their analysis of the adjusting delay procedure. Using a series of different models of the choice behavior of the rats, they concluded that the rats’ behavior could be explained by random choice patterns. If this is the case, then that would explain the poor temporal tracking and differences in choice behavior in this procedure. However, purely random choice behavior should not produce significant same-form test-retest reliability as the rats should perform differently each time they are tested on the procedure. Thus, it seems that the rats may be engaging in at least some degree of non-random choice behavior based on other information available in the task such as local reward rates, or recent choice outcomes (a conclusion supported also by the Craig et al., 2014 findings). Further research will be needed to determine the factors that affect choice behavior in this procedure.
Temporal processes have been receiving increasing interest as a potential contributor to impulsive choice behavior. In general, more precise timing appears to relate to self-control in rats (Marshall et al., 2014; McClure et al., 2014; Smith et al., in press), and timing accuracy may additionally contribute to self-control in humans (Baumann & Odum, 2012; Wittmann & Paulus, 2008). This suggests that the ability to learn delays may be critical for self-control, and additionally suggests that procedures that allow for such learning (and measurement thereof) should be favored over procedures that do not. Thus, this argues in favor of the use of systematic procedures over adjusting (Craig et al., 2014). The SYS-GE may be slightly preferred due to the more rapid development of high quality and stable performance, in comparison to SYS-ER, which required twice as long to develop. But, both procedures resulted in very strong temporal tracking and similar choice performance after more extensive training, so there is no overwhelmingly strong basis for preferring SYS-GE to SYS-ER based on the present data.
Due to the potential involvement of impulsive choice in a number of maladaptive behaviors and disorders, accurately screening individuals for impulsive tendencies is a critical enterprise. Screening could identify “at-risk” individuals in the early stages of development and aid applications such as promoting treatment success for drug abuse to mitigate relapse issues. In addition, robust measurements of impulsive choice are paramount to developing intervention strategies to promote self-control and flexible decision making. There are multiple factors that may affect the results of choice procedures. The method used to measure impulsive choice is critical to parsing out the effects of such manipulations and interpreting possible interaction effects. The examination of different facets of choice procedures used for rats, a popular animal model for disordered impulsive choice, has generally been overlooked. The current study is a beginning towards rectifying this oversight, but more research is needed to determine what procedural factors may affect impulsive choice measurements, and, most importantly, to determine what exactly is being learned in these different procedures. This later concern will aid in understanding the underlying cognitive mechanisms of impulsive choice, which could further promote the ability to develop effective behavioral intervention strategies.
Acknowledgments
The data presented in this paper was presented at the spring meeting of the Comparative Cognition Society in March, 2014. The research was supported by NIMH grant R01-MH085739 awarded to Kimberly Kirkpatrick and Kansas State University. The authors would like to thank Andrew Marshall for his help with data analysis.
References
- Ainslie GW. Impulse control in pigeons. Journal of the Experimental Analysis of Behavior. 1974;21(3):485–489. doi: 10.1901/jeab.1974.21-485. [DOI] [PMC free article] [PubMed] [Google Scholar]
- Alessi SM, Petry NM. Pathological gambling severity is associated with impulsivity in a delay discounting procedure. Behavioral Processes. 2003;64:345–354. doi: 10.1016/s0376-6357(03)00150-5. [DOI] [PubMed] [Google Scholar]
- Bakeman R. Recommended effect size statistics for repeated measures designs. Behavior Research Methods. 2005;37(3):379–384. doi: 10.3758/bf03192707. [DOI] [PubMed] [Google Scholar]
- Baker F, Johnson MW, Bickel WK. Delay discounting in current and never-before cigarette smokers: Similarities and differences across commodity, sign, and magnitude. Journal of Abnormal Psychology. 2003;112(3):382–392. doi: 10.1037/0021-843x.112.3.382. [DOI] [PubMed] [Google Scholar]
- Baumann AA, Odum AL. Impulsivity, risk taking and timing. Behavioural Processes. 2012;90:408–414. doi: 10.1016/j.beproc.2012.04.005. [DOI] [PMC free article] [PubMed] [Google Scholar]
- Bickel WK, Marsch LA. Toward a behavioral economic understanding of drug dependence: delay discounting processes. Addiction. 2001;96(1):73–86. doi: 10.1046/j.1360-0443.2001.961736.x. [DOI] [PubMed] [Google Scholar]
- Boomhower SR, Rasmussen EB, Doherty TS. Impulsive-choice patterns for food in genetically lean and obese Zucker rats. Behavioral Brain Research. 2013;241:214–221. doi: 10.1016/j.bbr.2012.12.013. [DOI] [PMC free article] [PubMed] [Google Scholar]
- Cardinal RN, Daw N, Robbins TW, Everitt BJ. Local analysis of behaviour in the adjusting-delay task for assessing choice of delayed reinforcement. Neural Networks. 2002;15:617–634. doi: 10.1016/s0893-6080(02)00053-9. [DOI] [PubMed] [Google Scholar]
- Church RM, Lacourse DM. Serial pattern learning of temporal intervals. Animal Learning and Behavior. 1998;26(3):272–289. [Google Scholar]
- Craig AR, Maxfield AD, Stein JS, Renda CR, Madden GJ. Do the adjusting-delay and increasing-delay tasks measure the same construct: delay discounting? Behavioural Pharmacology. 2014 doi: 10.1097/FBP.0000000000000055. [DOI] [PMC free article] [PubMed] [Google Scholar]
- Crystal JD, Church RM, Broadbent HA. Systematic nonlinearities in the memory representation of time. Journal of Experimental Psychology: Animal Behavior Processes. 1997;23(3):267–282. doi: 10.1037//0097-7403.23.3.267. [DOI] [PubMed] [Google Scholar]
- Epstein LH, Richards JB, Saad FG, Paluch RA, Roemmich JN, Lerman C. Comparison between two measures of delay discounting in smokers. Experimental and Clinical Psychopharmacology. 2003;11(2):131–138. doi: 10.1037/1064-1297.11.2.131. [DOI] [PubMed] [Google Scholar]
- Evenden JL, Ryan CN. The pharmacology of impulsive behavior in rats: the effects of drugs on response choice with varying delays to reinforcement. Psychopharmacology (Berlin) 1996;128:161–170. doi: 10.1007/s002130050121. [DOI] [PubMed] [Google Scholar]
- Fox AT, Hand DJ, Reilly MP. Impulsive choice in a rodent model of attention-deficit/hyperactivity disorder. Behavioural Brain Research. 2008;187(1):146–152. doi: 10.1016/j.bbr.2007.09.008. [DOI] [PubMed] [Google Scholar]
- Galtress T, Garcia A, Kirkpatrick K. Individual differences in impulsive choice and timing in rats. Journal of the Experimental Analysis of Behavior. 2012;98(1):65–87. doi: 10.1901/jeab.2012.98-65. [DOI] [PMC free article] [PubMed] [Google Scholar]
- Garcia A, Kirkpatrick K. Impulsive choice behavior in four strains of rats: Evaluation of possible models of Attention-Deficit/Hyperactivity Disorder. Behavioural Brain Research. 2013;238:10–22. doi: 10.1016/j.bbr.2012.10.017. [DOI] [PMC free article] [PubMed] [Google Scholar]
- George D, Mallery P. SPSS for Windows Step by Step: A Simple Guide and Reference. 4. Boston, MA: Allyn and Bacon; 2003. [Google Scholar]
- Green L, Estle SJ. Preference reversals with food and water reinforcers in rats. Journal of the Experimental Analysis of Behavior. 2003;79(2):233–242. doi: 10.1901/jeab.2003.79-233. [DOI] [PMC free article] [PubMed] [Google Scholar]
- Green L, Myerson J, Shah AK, Estle SJ, Holt DD. Do adjusting-amount and adjusting-delay procedures produce equivalent estimates of subjective value in pigeons. Journal of the Experimental Analysis of Behavior. 2007;87(3):337–347. doi: 10.1901/jeab.2007.37-06. [DOI] [PMC free article] [PubMed] [Google Scholar]
- Guilhardi P, Church RM. Measures of temporal discrimination in fixed-interval performance: A case study in archiving data. Behavior Research Methods, Instruments & Computers. 2004;36(4):661–669. doi: 10.3758/bf03206548. [DOI] [PubMed] [Google Scholar]
- Hill CC, Peterson JR, Kirkpatrick K. Measurement of impulsive choice in rats: Preliminary assessment. Paper presented at the Conference on Comparative Cognition; Melbourne, FL. 2013. Mar, [Google Scholar]
- Holt DD, Green L, Myerson J. Estimating the subjective value of future rewards: Comparison of adjusting-amount and adjusting-delay procedures. Behavioural Processes. 2012;90:302–310. doi: 10.1016/j.beproc.2012.03.003. [DOI] [PMC free article] [PubMed] [Google Scholar]
- Jimura K, Myerson J, Hilgard J, Keighley J, Braver TS, Green L. Domain independence and stability in young and older adults’ discounting of delayed rewards. Behavioural Processes. 2011;87(3):253–259. doi: 10.1016/j.beproc.2011.04.006. [DOI] [PMC free article] [PubMed] [Google Scholar]
- Johnson MW, Bickel WK, Baker F. Moderate drug use and delay discounting: A comparison of heavy, light, and never smokers. Experimental and Clinical Psychopharmacology. 2007;15(2):187–194. doi: 10.1037/1064-1297.15.2.187. [DOI] [PubMed] [Google Scholar]
- Kinloch JM, White KG. A concurrent-choice analysis of amount-dependent temporal discounting. Behavioural Processes. 2013 doi: 10.1016/j.beproc.2013.03.007. [DOI] [PubMed] [Google Scholar]
- Kirby KN. One-year temporal stability of delay-discount rates. Psychonomic Bulletin & Review. 2009;16(3):457–462. doi: 10.3758/PBR.16.3.457. [DOI] [PubMed] [Google Scholar]
- Ludvig EA, Staddon JER. The conditions for temporal tracking under interval schedules of reinforcement. Journal of Experimental Psychology: Animal Behavior Processes. 2004;30(4):299–316. doi: 10.1037/0097-7403.30.4.299. [DOI] [PMC free article] [PubMed] [Google Scholar]
- Madden GJ, Smith NG, Brewer AT, Pinkston JW, Johnson PS. Steady-state assessment of impulsive choice in Lewis and Fischer 344 rats: Between-condition delay manipulations. Journal of the Experimental Analysis of Behavior. 2008;90(3):333–344. doi: 10.1901/jeab.2008.90-333. [DOI] [PMC free article] [PubMed] [Google Scholar]
- Marshall AT, Smith AP, Kirkpatrick K. Mechanisms of impulsive choice: I. Individual differences in interval timing and reward processing. Journal of the Experimental Analysis of Behavior. 2014;102(1):86–101. doi: 10.1002/jeab.88. [DOI] [PMC free article] [PubMed] [Google Scholar]
- Matusiewicz AK, Carter AE, Landes RD, Yi R. Statistical equivalence and test-retest reliability of delay and probability discounting using real and hypothetical rewards. Behavioural Processes. 2013 doi: 10.1016/j.beproc.2013.07.019. [DOI] [PMC free article] [PubMed] [Google Scholar]
- Mazur JE. An adjusting procedure for studying delayed reinforcement. In: Commons ML, Mazur JE, Nevin JA, Rachlin H, editors. Quantitative analyses of behavior. Vol. 5. The effect of delay and of intervening events on reinforcer value. Hillsdale, NJ: Erlbaum; 1987. pp. 55–73. [Google Scholar]
- Mazur JE. Hyperbolic value addition and general models of animal choice. Psychological Review. 2001;108(1):96–112. doi: 10.1037/0033-295x.108.1.96. [DOI] [PubMed] [Google Scholar]
- Mazur JE. Rats’ choices between one and two delayed reinforcers. Learning & Behavior. 2007;35(3):169–176. doi: 10.3758/bf03193052. [DOI] [PMC free article] [PubMed] [Google Scholar]
- McClure J, Podos J, Richardson HN. Isolating the delay component of impulsive choice in adolescent rats. Frontiers in Integrative Neuroscience. 2014;8(3) doi: 10.3389/fnint.2014.00003. [DOI] [PMC free article] [PubMed] [Google Scholar]
- McGuire JT, Kable JW. Rational temporal predictions can underlie apparent failures to delay gratification. Psychological Review. 2013;120(2):395–430. doi: 10.1037/a0031910. [DOI] [PMC free article] [PubMed] [Google Scholar]
- Mitchell SH. Measures of impulsivity in cigarette smokers and non-smokers. Psychopharmacology (Berlin) 1999;146(4):455–464. doi: 10.1007/pl00005491. [DOI] [PubMed] [Google Scholar]
- Myerson J, Green L. Discounting of delayed rewards: Models of individual choice. Journal of the Experimental Analysis of Behavior. 1995;64:263–276. doi: 10.1901/jeab.1995.64-263. [DOI] [PMC free article] [PubMed] [Google Scholar]
- Neef NA, Marckel J, Ferreri SJ, Bicard DF, Endo S, Aman MG, … Armstrong N. Behavioral assessment of impulsivity: A comparison of children with and without attention deficit hyperactivity disorder. Journal of Applied Behavior Analysis. 2005;38(1):23–37. doi: 10.1901/jaba.2005.146-02. [DOI] [PMC free article] [PubMed] [Google Scholar]
- Odum AL. Delay discounting: I’m a k, you’re a k. Journal of the Experimental Analysis of Behavior. 2011a;96(3):427–439. doi: 10.1901/jeab.2011.96-423. [DOI] [PMC free article] [PubMed] [Google Scholar]
- Odum AL. Delay discounting: Trait variable? Behavioural Processes. 2011b;87(1):1–9. doi: 10.1016/j.beproc.2011.02.007. [DOI] [PMC free article] [PubMed] [Google Scholar]
- Odum AL, Baumann AAL. Delay discounting: state and trait variable. In: Madden GJ, Bickel WK, editors. Impulsivity: The behavioral and neurological science of discounting. Washington,DC: APA Books; 2010. pp. 39–65. [Google Scholar]
- Ohmura Y, Takahashi T, Kitamura N, Wehr P. Three-month stability of delay and probability discounting measures. Experimental and Clinical Psychopharmacology. 2006;14:318–328. doi: 10.1037/1064-1297.14.3.318. [DOI] [PubMed] [Google Scholar]
- Olejnik S, Algina J. Generalized eta and omega squared statistics: Measures of effect size for some common research designs. Psychological Methods. 2003;8(4):434–447. doi: 10.1037/1082-989X.8.4.434. [DOI] [PubMed] [Google Scholar]
- Peters J, Büchel C. Overlapping and distinct neural systems code for subjective value during intertemporal and risky decision making. The Journal of Neuroscience. 2009;29:15727–15734. doi: 10.1523/JNEUROSCI.3489-09.2009. [DOI] [PMC free article] [PubMed] [Google Scholar]
- Petry NM, Casarella T. Excessive discounting of delayed rewards in substance abusers with gambling problems. Drug and Alcohol Dependence. 1999;56:25–32. doi: 10.1016/s0376-8716(99)00010-1. [DOI] [PubMed] [Google Scholar]
- Rachlin H, Raineri A, Cross D. Subjective probability and delay. Journal of the Experimental Analysis of Behavior. 1991;55(2):233–244. doi: 10.1901/jeab.1991.55-233. [DOI] [PMC free article] [PubMed] [Google Scholar]
- Rodzon K, Berry MS, Odum AL. Within-subject comparison of degree of delay discounting using titrating and fixed sequence procedures. Behavioural Processes. 2011;86:164–167. doi: 10.1016/j.beproc.2010.09.007. [DOI] [PMC free article] [PubMed] [Google Scholar]
- Samuelson PA. A note on measurement of utility. The Review of Economic Studies. 1937;4(5):155–161. [Google Scholar]
- Smith AP, Marshall AT, Kirkpatrick K. Mechanisms of Impulsive Choice: II. Sensitivity to Time as a Potential Mechanism to Increase Self-Control. Behavioural Processes in press. [Google Scholar]
- Stein JS, Pinkston JW, Brewer AT, Francisco MT, Madden GJ. Delay discounting in Lewis and Fischer 344 rats: Steady-state and rapid-determination adjusting-amount procedures. Journal of the Experimental Analysis of Behavior. 2012;97(3):305–321. doi: 10.1901/jeab.2012.97-305. [DOI] [PMC free article] [PubMed] [Google Scholar]
- Torres LV, Da Costa Araújo S, Olarte Sanchez CM, Body S, Bradshaw CM, Szabadi E. Transitional and Steady-State Choice Behavior under an Adjusting-Delay Schedule. Journal of the Experimental Analysis of Behavior. 2011;95(1):57–74. doi: 10.1901/jeab.2011.95-57. [DOI] [PMC free article] [PubMed] [Google Scholar]
- Weller RE, Cook EW, Avsar KB, Cox JE. Obese women show greater delay discounting than healthy-weight women. Appetite. 2008;51:563–568. doi: 10.1016/j.appet.2008.04.010. [DOI] [PubMed] [Google Scholar]
- Wittmann M, Paulus MP. Decision making, impulsivity and time perception. Trends in Cognitive Sciences. 2008;12(1):7–12. doi: 10.1016/j.tics.2007.10.004. [DOI] [PubMed] [Google Scholar]