Abstract
Sulforaphane (SFN), a dietary phase-2 enzyme inducer that mitigates cellular oxidative stress through nuclear factor erythroid 2-related factor 2 (Nrf2) activation, is known to exhibit beneficial effects in the vessel wall. For instance, it inhibits vascular smooth muscle cell (VSMC) proliferation, a major event in atherosclerosis and restenosis after angioplasty. In particular, SFN attenuates the mitogenic and pro-inflammatory actions of platelet-derived growth factor (PDGF) and tumor necrosis factor-α (TNFα), respectively, in VSMCs. Nevertheless, the vasoprotective role of SFN has not been examined in the setting of obesity characterized by hyperleptinemia and insulin resistance. Using the mouse model of western diet-induced obesity, the present study demonstrates for the first time that subcutaneous delivery of SFN (0.5 mg/Kg/day) for ~3 weeks significantly attenuates neointima formation in the injured femoral artery [↓ (decrease) neointima/media ratio by ~60%; n = 5–8]. This was associated with significant improvements in metabolic parameters, including ↓ weight gain by ~52%, ↓ plasma leptin by ~42%, ↓ plasma insulin by ~63%, insulin resistance [↓ homeostasis model assessment of insulin resistance (HOMA-IR) index by ~73%], glucose tolerance (↓ AUCGTT by ~24%), and plasma lipid profile (e.g., ↓ triglycerides). Under in vitro conditions, SFN significantly decreased leptin-induced VSMC proliferation by ~23% (n = 5) with associated diminutions in leptin-induced cyclin D1 expression and the phosphorylation of p70S6kinase and ribosomal S6 protein (n = 3–4). The present findings reveal that, in addition to improving systemic metabolic parameters, SFN inhibits leptin-induced VSMC proliferative signaling that may contribute in part to the suppression of injury-induced neointima formation in diet-induced obesity.
Keywords: sulforaphane, diet-induced obesity, arterial injury, vascular smooth muscle cells, leptin, p70S6K
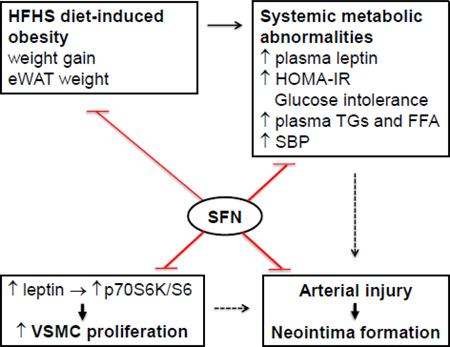
Graphical Abstract
Effects of SFN on dysregulated metabolic parameters and injury-induced neointima formation in western diet (HFHS)-fed obese C57BL/6J mice. SFN treatment attenuates weight gain and eWAT weight and improves systemic metabolic abnormalities (e.g., ↓ plasma leptin and insulin, improves HOMA-IR and glucose tolerance, and lowers plasma triglycerides/FFA and systolic blood pressure). In addition, SFN suppresses injury-induced intimal hyperplasia in the femoral artery and inhibits leptininduced VSMC proliferation by targeting p70S6K/S6 signaling. The use of SFN as a dietary supplement may provide a rational prophylactic approach to target restenosis after angioplasty in diet-induced obesity.
1. Introduction
Epidemiological studies predict a rise in obese population with an increased risk of coronary heart disease due to westernized diet and lifestyle in developed and developing countries [1]. Lifestyle modification (e.g., physical activity and balanced diet) is a recommended approach to maintain energy balance and reduce the burden of obesity-associated metabolic risk factors such as hyperleptinemia, insulin resistance, and dyslipidemia [1, 2]. Studies suggest that the nutrients/key ingredients in fruits and vegetables may prevent or delay the progression of vascular complications [3]. For instance, resveratrol (a polyphenol from grapes) and sulforaphane (SFN, an isothiocyanate from cruciferous vegetables such as broccoli and cabbage) have been shown to lower blood pressure and attenuate neointima formation in animal models of hypertension and arterial injury, respectively [4–8]. Recent studies highlight the therapeutic potential of nutrient-derived compounds (e.g., resveratrol and curcumin) toward improving vascular complications in the setting of obesity [9–12]. However, the likely beneficial effects of SFN in the vessel wall remain unclear especially in diet-induced obesity. The present study is therefore aimed at examining whether SFN prevents exaggerated vascular smooth muscle cell (VSMC) proliferation after arterial injury in western diet-fed obese mouse model.
SFN has been shown to decrease weight gain and visceral adiposity in high fat diet-fed mice [13]. In this study, SFN was also found to diminish leptin expression in adipose tissue and lower circulating leptin levels. However, it remains unknown as to how SFN regulates leptin-induced proliferative signaling in VSMCs or neointima formation after arterial injury under metabolically compromised conditions. Hyperleptinemia is a characteristic feature of obesity, and it promotes vascular remodeling such as atherosclerosis and enhanced neointima formation after arterial injury [14, 15]. From a mechanistic standpoint, leptin promotes neointima formation through activation of VSMC-specific leptin receptor [15] and its key downstream signaling components including mammalian target of rapamycin (mTOR) and phosphoinositide 3-kinase (PI 3-kinase) [16]. Thus, it is critically important to examine the likely regulatory effects of SFN on exaggerated VSMC proliferation under hyperleptinemic conditions.
In addition to regulating circulating leptin levels, SFN intervention may have an impact on insulin resistance and dyslipidemia. Although there is no direct evidence for SFN to improve insulin resistance, broccoli sprouts (dietary source for SFN) appear to improve insulin resistance in patients with type 2 diabetes [17, 18]. Recent studies demonstrate that SFN lowers circulating levels of total cholesterol and triglycerides in high fat diet-fed mice [13]. Importantly, insulin resistance and dyslipidemia are associated with enhanced VSMC proliferation in the injured artery [19, 20]. To date, SFN regulation of intimal hyperplasia has not been examined under insulin-resistant and dyslipidemic states.
SFN or its precursor, glucoraphanin, has been shown to reduce oxidative stress in the vascular tissues, thereby contributing to vasoprotective effects [4, 21]. In particular, it induces phase-2 antioxidant enzymes that mitigate cellular oxidative stress through activation of nuclear factor erythroid 2-related factor 2 (Nrf2) [22]. Recent studies demonstrate that SFN exhibits beneficial effects in the vessel wall by targeting mitogenic and pro-inflammatory signaling in VSMCs [5, 6, 23], beyond its role as an antioxidant. The objectives of the present study are to determine the effects of SFN on: i) neointima formation after femoral artery injury in high-fat high-sucrose (HFHS) diet-fed mice; ii) body weight, food intake, caloric intake, epididymal white adipose tissue (eWAT) weight, and systemic metabolic parameters including hyperleptinemia, HOMA-IR (an index of insulin resistance), dyslipidemia, and blood pressure; and iii) leptin-induced key proliferative signaling in VSMCs.
2. Materials and methods
2.1. Chemicals
Sulforaphane (SFN) was purchased from EMD Millipore (cat# 574215; Billerica, MA). Recombinant human leptin was purchased from R&D systems Inc. (cat# 398-LP; Minneapolis, MN). VITROS DT-slides were purchased from Ortho Clinical Diagnostics (Rochester, NY). All surgical tools were purchased from Roboz Surgical Instrument (Gaithersburg, MD). The primary antibody for smooth muscle α-actin was purchased from Abcam (cat# ab5694; Cambridge, MA). The primary antibody for Ki-67 was purchased from Thermo Scientific (cat# RM-9106-S1; Hanover, IL). The primary antibodies for cyclin D1, phospho-Akt (Ser473), phospho-ribosomal protein S6 (Ser235/236) and phospho-p70S6kinase (Thr389) were purchased from Cell Signaling Technology (Danvers, MA). Goat anti-rabbit secondary antibody (A-11037) and prolong gold anti-fade mountant with DAPI (P36931) were purchased from Life Technologies (Grand Island, NY). All other chemicals were from Fisher Scientific (Fair Lawn, NJ) or Sigma-Aldrich (St. Louis, MO).
2.2. Animals
All animal experiments were performed in accordance with the Charlie Norwood Veterans Affairs Medical Center Institutional Animal Care and Use Committee guidelines and were approved by the committee. Male C57BL/6J mice (8 weeks of age, Jackson Laboratories, Bar Harbor, ME) were maintained in a room at a controlled temperature of 23°C with a 12:12-hr dark-light cycle. Control diet (CON; D14022802) and western diet (high-fat high-sucrose diet, HFHS; D12079B) were obtained from Research Diet (New Brunswick, NJ). CON diet consisted of 10% fat-derived calories (only from corn oil) and 72% carbohydrate-derived calories without sucrose. HFHS diet consisted of 40% fat derived-calories (1.9% corn oil and 38.4% butter), 42% carbohydrate-derived calories with sucrose (29.1% sucrose-derived calories), and cholesterol (0.15% w/w). The mice had free access to water and their assigned research diet.
2.3. Experimental protocol for SFN treatment in mice
Mice were divided into 2 groups (22–25 mice per group). One group was fed a HFHS diet and the other group was fed a CON diet for 8 weeks (day 1 through day 57). On day 35, HFHS diet-fed mice were subdivided into two groups to receive SFN or vehicle treatment until day 57. In parallel, CON diet-fed mice were also subdivided into two groups to receive SFN or vehicle treatment. To study the in vivo effects of SFN, previous studies have employed different methods including oral, intravenous, intraperitoneal, and subcutaneous delivery [5, 6, 24–26]. Of note, oral administration and intravenous injection of SFN at lower dosage (0.5 mg/Kg) showed comparable plasma levels of SFN between 6 hr and 24 hr [25]. In a different study, SFN delivery via subcutaneous route (0.5 mg/Kg/day) has been shown to exhibit vasoprotective effects in diabetic mice [24]. Accordingly, in the present study, SFN solution (in 0.12% DMSO vehicle) was injected subcutaneously into HFHS or CON diet-fed mice at a dose of 0.5 mg/Kg/day [24], as illustrated in the experimental protocol (Suppl. Fig. 1).
2.4. Measurement of body weight
Body weight of mice was measured on a weekly basis. Weight gain in each treatment group during the last 3 weeks of experimental protocol was calculated by subtracting weight at the end of week 5 (day 36) from weight at the end of experiment (day 57).
2.5. Measurement of food intake and caloric intake
The weekly food intake was calculated by subtracting the amount of food remaining in the cage from the amount of food served to mice (data were obtained for every 3–4 mice housed in the same cage and divided by 3 or 4). The average daily food intake for each mouse was calculated by dividing weekly food intake by 7. Average daily caloric intake was then calculated by multiplying the average daily food intake (in grams) for each mouse by the number of kilocalories obtained from one gram of its respective diet (1 g of HFHS diet = 4.68 Kcal; 1 g of CON diet = 3.91 Kcal).
2.6. Measurement of systemic metabolic parameters
2.6.1. Measurement of plasma leptin and insulin
Blood samples were drawn from the retro orbital plexus of mice using heparinized microhematocrit tubes (on days 29 and 57) after a 14 hr fast. Plasma leptin and insulin concentrations were measured using ELISA kits from Crystal Chem (cat# 90030; Downers Grove, IL) and Mercodia Inc. (cat# 10-1247-011; Uppsala, Sweden), respectively, according to manufacturer’s instructions.
2.6.2. Intraperitoneal glucose tolerance test (IPGTT)
Previous studies have used different approaches including a 5–6 hr fast or an overnight fast (~12–18 hr) to determine alterations in blood glucose homeostasis and insulin sensitivity [27–30]. Contrary to a 5–6 hr fast, overnight fasting (14–18 hr) leads to a catabolic state including depletion of hepatic glycogen stores, but has the advantage to minimize variability in baseline blood glucose levels [27, 28]. According to previous reports on atherogenic diet-fed mice [29, 30], we performed studies using mice after an overnight fast. On day 23, mice on a 14-hr fast were injected intraperitoneally with freshly prepared glucose solution at a dose of 2 g/Kg body weight [29]. A drop of blood was collected from the tail after making a cut at 1–2 mm from the tail end. Blood glucose was measured at 0 (before glucose injection), 30, 60, 120 and 180 min after glucose injection using Contour glucometer (Bayer Health Care, Mishawaka, IN). On day 56 (22 days after the start of SFN/vehicle treatment), IPGTT was repeated for all 4 groups of mice using same procedures.
2.6.3. Calculation of insulin sensitivity index
Homeostasis model assessment of insulin resistance (HOMA-IR) index was calculated according to the following formula from Matthews et. al. [31]:
2.6.4. Measurement of plasma lipid profile
Plasma free fatty acids (FFA) were measured on days 1, 29 and 57 using NEFA HR2 series (Wako Life Sciences Inc., Richmond, VA). Plasma total cholesterol (TC), triglycerides (TG) and high density lipoprotein cholesterol (HDL-C) were measured by enzymatic colorimetric method using VITROS DT60 II Chemistry System from Ortho-Clinical Diagnostics, Inc. (Rochester, NY). Plasma very low density lipoprotein cholesterol (VLDL-C) was calculated according to the following equation: VLDL-C = TG/5. Plasma low density lipoprotein cholesterol (LDL-C) was calculated according to the equation: LDL-C = TC – [VLDL-C + HDL-C] [32]. Plasma non-HDL-C that represents cholesterol content in all atherogenic lipoproteins was calculated according to the equation: non-HDL-C = TC – HDL-C [33].
2.7. Measurement of blood pressure and heart rate
Systolic blood pressure (SBP), diastolic blood pressure (DBP), mean arterial pressure (MAP), and heart rate were recorded in conscious mice once at the beginning of the experiment (day 1) and once toward the end of experiment (day 55) using tail-cuff method and single/dual blood pressure analysis system (Model SC1000, Hatteras instruments Inc., Cary, NC). The device was set to perform 5 initial preliminary cycles, followed by 10 actual measurement cycles. The average of the actual measurement cycles was calculated and considered the reading for the mouse under test. Platform was prewarmed to 40°C before starting the measurements. In order to get more consistent results and familiarize the mice with the strainer, blood pressure measurement procedures were performed daily for 2–3 days before the day of recording.
2.8. Femoral artery injury in mice
On day 36, left femoral artery injury was performed in all mice according to the method described by Sata and his colleagues [34]. In brief, the left femoral artery was exposed by dissection and the accompanying femoral nerve was separated carefully. A small branch between the rectus femoris and the vastus medialis muscles was isolated, ligated distally and looped proximally. Transverse arterioctomy was performed in the muscular branch after topical application of a drop of 1% lidocaine. An incision was made and then extended slightly using microsurgery forceps to allow the insertion of a straight spring wire (0.38 mm in diameter, No. C-SF-15-15, Cook, Bloomington, IN) into the femoral artery. The wire was left in place for 1 min to denude and dilate the artery and then it was removed. The proximal portion of the muscular branch was secured by suturing to restore the blood flow in the main femoral artery [34]. Right femoral artery was used as sham control. Subsequently, the respective groups of mice were maintained on the assigned diets with SFN/vehicle treatment until day 57.
2.9. Tissue collection
On day 57, mice were anesthetized with 2% isoflurane and then perfused with 0.9% NaCl solution via the left ventricle. eWAT was excised, weighed and kept in 10% neutral buffered formalin. This was followed by perfusion fixation via the left ventricle with 4% paraformaldehyde (PFA) in PBS, pH 7.4. The femoral artery was carefully excised, fixed in 4% paraformaldehyde overnight at 4°C. The samples were kept in 4% paraformaldehyde for 1–2 days before being processed for frozen sections.
2.10. Morphometric analysis of femoral artery
Cross-sections (5 µm) of femoral artery were stained with haematoxylin and eosin (H&E) and elastic van gieson (EVG), and the images were taken by AxioCam high resolution camera (HRc) attached to an Observer Z1 microscope (Carl Zeiss Microimaging, Inc., Thornwood, NY) using 20× magnification power. Cross-sectional arterial microscopic images were analyzed for intima-to-media ratios within the middle portion of each lesion using image analysis software (Axiovision, release 4.8.2 SP3). Lumen, intimal, and medial areas were individually calculated via computer analysis by circumscribing the lumen edge, internal elastic lamina (IEL) and external elastic lamina (EEL), respectively. The intimal area from each section was determined by subtraction of the lumen area from the IEL area (i.e., intimal area = IEL area - lumen area). The medial area was determined by subtraction of the IEL area from the EEL area (i.e., medial area = EEL area - IEL area) [35].
2.11. Immunofluorescence analysis of femoral artery
Immunofluorescence analysis was performed for smooth muscle α-actin (SM α-actin) to confirm that the neointima after arterial injury is composed of vascular smooth muscle cells. The cross sections of injured femoral arteries were placed in a humidified chamber and fixed in 4% PFA, and then blocked by incubation with 5% normal goat serum for 1 hr. Subsequently, these sections were exposed to the primary antibody specific for SM α-actin (1:200 dilution) for 1 hr at room temperature or Ki-67 (1:30 dilution) overnight at 4°C, washed 3 times with PBS, and then incubated with the secondary antibody (goat anti-rabbit IgG conjugated to Alexa fluor 594 with red fluorescence). The cross-sections were mounted using prolong antifade with DAPI and the images were captured using confocal microscope at 20x magnification power.
2.12. Quantitation of adipocyte area
Fixed eWAT tissue sections were stained with H&E and the images were taken by AxioCam high resolution camera (HRc) attached to an Observer Z1 microscope using 20x magnification power. Adiposoft, a software that provides accurate measurement of adipocyte area [36] was used to determine the areas for > 400 cells/individual animal, which were then averaged to obtain average adipocyte area per mouse. Accordingly, adipocyte area was calculated for all groups (4 mice per group).
2.13. VSMCs in culture and treatments
Human aortic VSMCs were purchased from ATCC (Manassas, VA) and maintained in vascular cell basal media with smooth muscle growth supplement (SMGS) and antibiotic-antimycotic solution in a humidified atmosphere of 95% air and 5% CO2, as described previously [37]. After the attainment of confluence (~7–10 days), VSMCs were trypsinized and seeded onto petri dishes (~4×10⁵ cells/60 mm dish). Subconfluent VSMCs were subjected to serum deprivation for 48 hr and treated with vehicle control (DMSO, 0.05%) or SFN (5 µM) [38]. Control and SFN-treated VSMCs were then stimulated with and without recombinant human leptin (6 nM; equivalent to 100 ng/mL) [16] for the indicated time intervals.
2.14. Cell counts
Serum-deprived VSMCs were treated with SFN (5 µM) or vehicle control (DMSO, 0.05%) for 30 min followed by exposure to leptin (6 nM) for 96 hr. At the 48 hr time point, the respective cells were replenished with fresh media with and without SFN or leptin. After 96 hr, VSMCs were trypsinized and the changes in cell number were determined using Countess Counter (Life Technologies), as described [37].
2.15. Immunoblot analysis
VSMC lysates (15 µg protein each) were electrophoresed using precast 4–12% NuPage mini-gels (Life Technologies), and the resolved proteins were transferred to PVDF membranes (EMD Millipore). The membranes were blocked with 5% milk in tris-buffered saline with tween (TBST) and probed with the indicated primary antibodies. After extensive washes, the immunoreactivity was detected using specific horseradish peroxidase-conjugated secondary antibodies followed by enhanced chemiluminescence. The protein bands were quantified using image J software, as described [39].
2.16. Statistical analysis
Data are expressed as means ± SEM. Statistical analysis was performed using unpaired student t-test for blood glucose, insulin, leptin, area under the curve during IPGTT (AUCIPGTT), and HOMA-IR measured before the start of SFN treatment. AUCIPGTT was calculated for each mouse from 0 to 180 min time points and the means of individual AUC values for the treatment groups were used for statistical comparisons. For body weight, food intake, caloric intake and glucose tolerance (IPGTT), the effects of both diet (CON vs. HFHS) and treatment (vehicle vs SFN) were analyzed by repeated measures two-way ANOVA followed by Bonferroni multiple comparisons test. All other measured parameters were compared using regular two-way ANOVA followed by Tukey's multiple comparisons test. Values of p < 0.05 were considered statistically significant. Statistical analyses and AUC calculations were carried out using GraphPad Prism software (GraphPad Software Inc. V6.0f, San Diego, CA, USA).
3. Results
3.1. SFN decreases weight gain in HFHS diet-fed mice
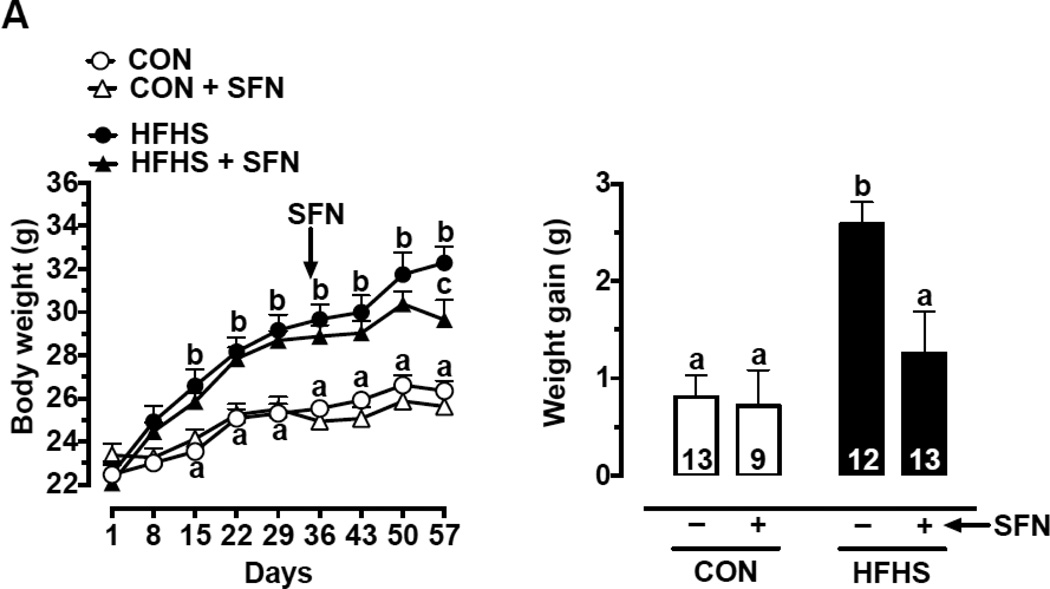
Recently, it has been shown that SFN inhibits high fat diet (HFD)-induced weight gain in C57BL/6J mice [40]. As shown in Fig. 1A (left panel), mice fed a HFHS diet showed a progressive increase in body weight for up to 8 weeks in the present study. The increases in body weight at 2-week (day 15), 5-week (day 36), and 8-week (day 57) time intervals were 12.9%, 16.2%, and 22.6%, respectively (p < 0.05). SFN treatment during the last 3 weeks (day 35 through day 57) significantly decreased body weight (measured on day 57) in HFHS-SFN group compared with HFHS group (p < 0.05) and decreased HFHS diet-induced weight gain by 51.6 % (p < 0.05) (Fig. 1A, right panel).
Fig. 1.
Effects of SFN on body weight, food intake/caloric intake, eWAT weight, adipocyte area, and systemic metabolic parameters in HFHS diet-fed mice.
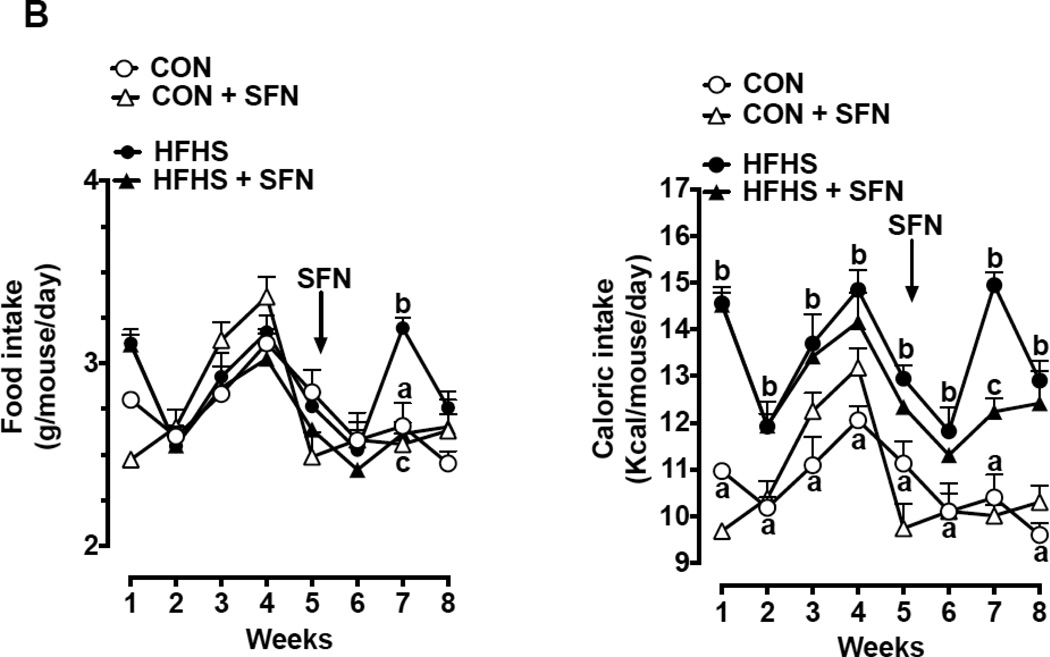
(A) Left Panel: Changes in body weight at the indicated time intervals. Right Panel: Weight gain after SFN treatment for 23 days (n = 9–13). (B) Left Panel: Changes in food intake at the indicated time intervals. Right Panel: Respective changes in caloric intake at the same time intervals (n = 9–13).
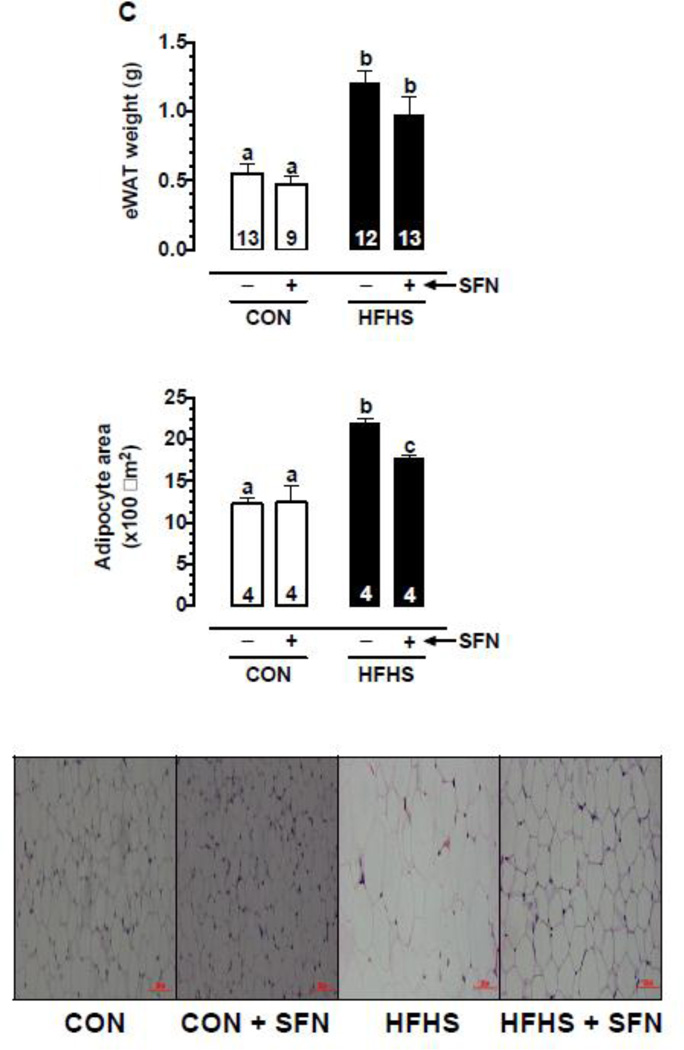
(C) Upper Panel: Changes in eWAT weight on day 57 (n = 9–13). Middle Panel: Changes in adipocyte area (n = 4). Lower Panel: Representative images from H&E stained adipose tissue sections (20× magnification, scale bar = 100 µm).
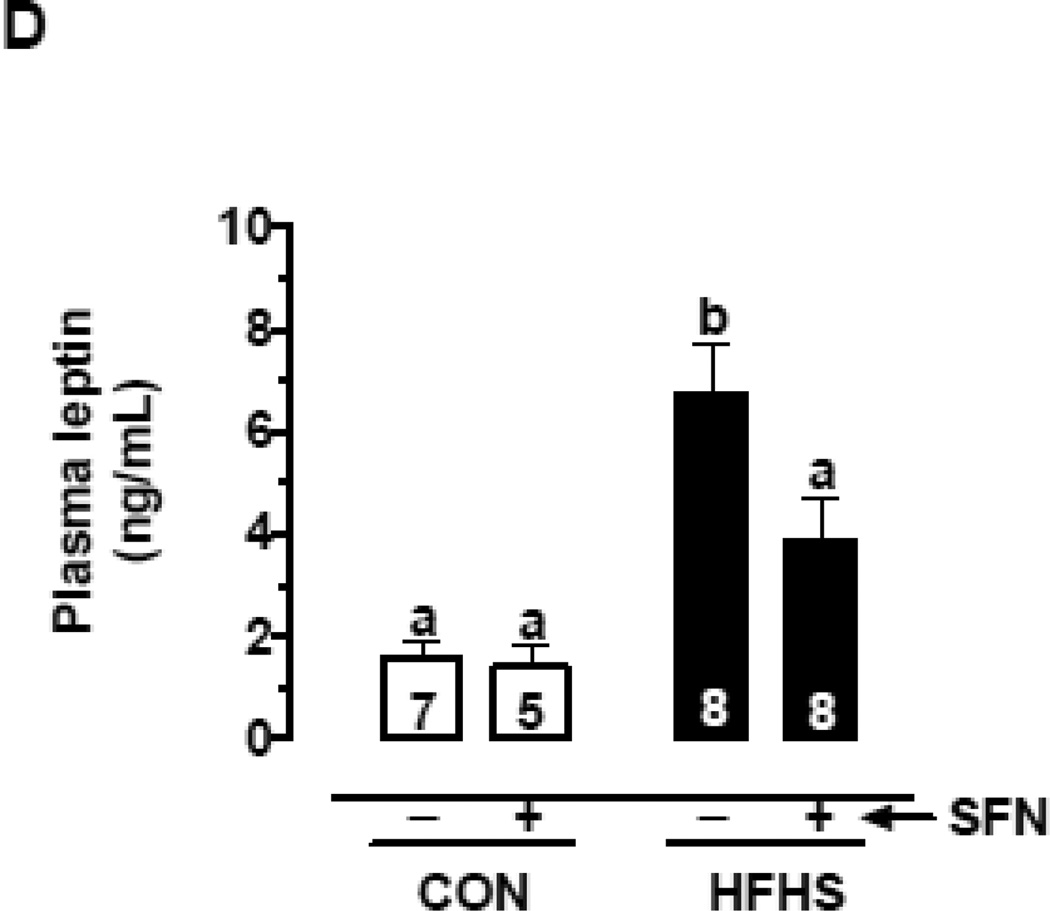
(D) Changes in plasma leptin levels on day 57 with and without SFN treatment (n = 5–8).
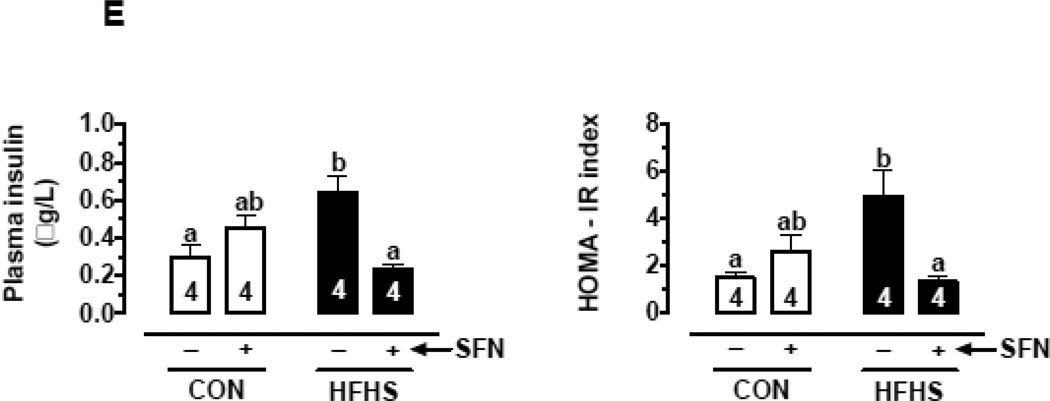
(E) Changes in fasting plasma insulin (left) and HOMA-IR, an index of insulin resistance (right) on day 57 with and without SFN treatment (n = 4).
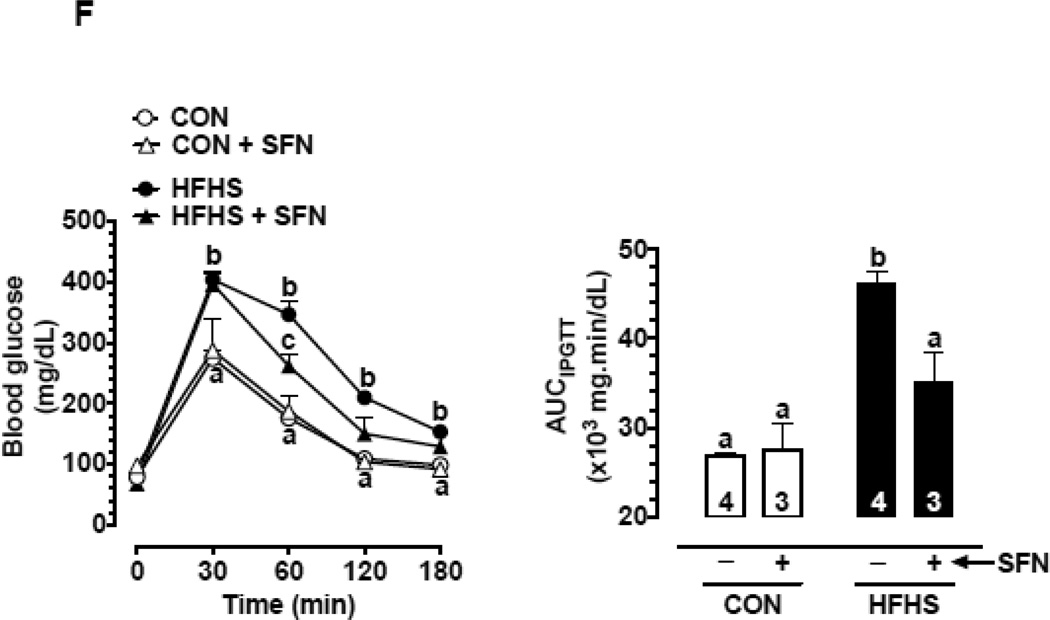
(F) Changes in glucose tolerance as illustrated by changes in blood glucose during intraperitoneal glucose tolerance test (IPGTT; left) and AUCIPGTT (right) on day 56 with and without SFN treatment (n = 3–4).
The data shown are the means ± SEM. Numbers within the bars represent the number of mice in each group. Different letters (a, b and c) indicate statistical significance of p < 0.05, using regular two-way ANOVA (A and F, right panels; C, upper and middle panels; and D and E) followed by Tukey's multiple comparisons test or two-way repeated measures ANOVA (A and F, left panels; and B) followed by Bonferroni multiple comparisons test. Groups sharing a common letter are not statistically significant.
3.2. SFN treatment does not show a consistent change in food and caloric intake in HFHS diet-fed mice
As shown in Fig. 1B (left panel), mice fed a HFHS diet showed no significant difference in food intake compared with control diet-fed group in the whole experimental period except for the 7th week (1.2-fold, p < 0.05). It should be noted that HFHS diet and control diet contain 4.68 Kcal/g and 3.91 Kcal/g, respectively, thus showing higher amount of calories in the HFHS diet. Accordingly, mice on a HFHS diet for 8 weeks showed significant increases in caloric intake by 1.2–1.4-fold (p < 0.05), compared with control group (Fig. 1B, right panel). This may in part contribute to the increase in body weight in HFHS diet-fed mice.
SFN treatment during the last 3 weeks (day 35 through day 57) in HFHS diet-fed mice did not show significant effects in food intake and caloric intake, especially at 1st week and 3rd week of treatment (Fig. 1B). However, there was a decrease in food and caloric intake by ~18% (p < 0.05) at the 2nd week of SFN treatment, compared with HFHS group. Thus, SFN treatment in HFHS diet-fed mice did not show consistent changes in food and caloric intake.
3.3. SFN decreases HFHS diet-induced increase in eWAT weight and adipocyte area in mice
As shown in Fig. 1C, HFHS diet-fed group showed ~2.2 and ~1.8-fold increases in eWAT weight and adipocyte area, respectively, compared with CON group (p < 0.05). In HFHS+SFN group, there was a decrease in eWAT weight by ~19.8% but it was not statistically significant. However, HFHS+SFN group showed a significant decrease in adipocyte area by ~19.3% (p < 0.05), compared with HFHS group. Histological examination of eWAT in HFHS diet-fed mice showed a marked increase in adipocyte size relative to CON group; this increase was attenuated by SFN treatment in HFHS-SFN group compared with HFHS group. It should be noted that the weight of epididymal fat pad is not representative of overall adiposity. Future studies should determine whether SFN diminishes the weight of inguinal, retroperitoneal, and mesenteric fat since they are reflective of classic fat depots [41].
3.4. SFN attenuates HFHS diet-induced increase in plasma leptin level in mice
Recently, SFN has been reported to attenuate obesity and decrease serum leptin level in HFD-fed mice [40]. In the present study, mice fed a HFHS diet for the first 4 weeks (up to 29 days) showed an increase in fasting plasma leptin level by ~2.4-fold (p < 0.05), compared with control group (Suppl. Fig. 2A). In addition, HFHS diet for the following 4 weeks (up to day 57) resulted in a further increase in plasma leptin by ~4.2-fold (p < 0.05). Importantly, SFN treatment during the last 3 weeks of HFHS diet lowered the plasma leptin level by 42.2% (p < 0.05) (Fig. 1D).
3.5. SFN attenuates HFHS diet-induced increase in plasma insulin level and HOMA-IR in mice
The increase in plasma leptin commonly seen in western diet-fed conditions [42–44] is associated with leptin resistance [43, 44]. Leptin resistance at the level of pancreatic β-cells contributes to the development of hyperinsulinemia [45, 46]. In the present study, fasting plasma insulin levels and HOMA-IR (an index of insulin resistance) were determined. In HFHS group (on day 29), fasting plasma insulin levels and HOMA-IR values were higher by 1.5- and 1.9-fold, respectively (but statistically insignificant), compared with CON group (Suppl. Fig. 2B).
In HFHS group (on day 57), fasting plasma insulin level was higher by 2.1-fold, (p < 0.05) compared with CON group. In HFHS-SFN group, there was a significant decrease in plasma insulin by 62.5% (p < 0.05) compared with HFHS group. Similarly, HOMA-IR values were significantly higher in HFHS group by 3.3-fold (p < 0.05) compared with CON group. In HFHS-SFN group, SFN treatment for 3 weeks resulted in a significant decrease in HOMA-IR value by 72.9% (p < 0.05), suggesting its ability to increase insulin sensitivity (Fig. 1E).
Fasting blood glucose level was measured at the start of the experiment (data not shown) and then monitored every 2 weeks. These values were found to be in the normal range (70–110 mg/dL) and were not significantly different among all groups (Suppl. Table 1), suggesting that HFHS diet for 8 weeks does not induce frank hyperglycemia.
3.6. SFN improves HFHS diet-induced glucose intolerance in mice
Next, intraperitoneal glucose tolerance test (IPGTT) was performed as described in ‘Materials and methods’. In HFHS group (on day 23), IPGTT revealed significantly higher blood glucose levels at 30 and 60 min time intervals (p < 0.05) compared with CON group. In addition, AUC was significantly higher by 1.4-fold (p < 0.05), thus indicating the development of glucose intolerance (Suppl. Fig. 2C). Importantly, HFHS group (on day 55) showed a further impairment in glucose tolerance with blood glucose levels significantly higher at 30, 60, 120 and 180 min (p < 0.05) time intervals. In addition, AUC was significantly higher by 1.7-fold (p < 0.05) compared with CON group (Fig. 1F).
Treatment with SFN attenuated the impairment of glucose tolerance. In HFHS-SFN group, AUC was significantly lower by 23.9% (p < 0.05) and the blood glucose level was significantly lower at 60 min time interval (p < 0.05), compared with HFHS group (Fig. 1F).
3.7. SFN improves HFHS diet-induced changes in plasma lipid profile in mice
Insulin resistance is associated with dyslipidemia in diet-induced obesity [42, 47]. In the present study, on days 1 and 29, fasting levels of plasma FFA were not statistically significant among all groups (data not shown). However, mice fed a HFHS diet for 57 days showed significant changes in plasma lipid profile. In particular, there were significant increases (p < 0.05) in fasting plasma TC (by 1.3-fold), TG (by 1.6-fold), VLDL-C (by 1.6-fold), LDL-C (by 2.7-fold), LDL-C/HDL-C ratio (by 3.9-fold), non-HDL-C (by 2.4-fold), and FFA (by 3.2-fold) with an insignificant decrease in HDL-C (16%), compared with CON group (Table 1). While SFN treatment for 23 days did not affect TC levels (1.3-fold increase, p < 0.05 compared with CON group), it significantly decreased TG and VLDL-C levels (by 31.1%, p < 0.05 compared with HFHS group). Moreover, it decreased LDL-C (by 16.3%), LDL-C/HDL-C ratio (by 23.4%), non-HDL-C (by 18.6%) and FFA (by 49.1%) and increased HDL-C (by 1.1-fold). However, these changes were not statistically significant compared with HFHS group (Table 1).
Table 1.
Effects of SFN treatment on plasma lipid profile in HFHS and CON diet-fed mice.
| CON | HFHS | |||
|---|---|---|---|---|
| − SFN | + SFN | − SFN | + SFN | |
| Total cholesterol (mg/dL) |
109.2 ±3.34 a (5) |
112.2 ± 5.83 a (5) |
140.4 ± 4.32 b (5) |
139.3 ± 7.9 b (6) |
| Fasting plasma FFA (mM) |
0.52 ± 0.04 a (7) |
0.51 ± 0.16 a (5) |
1.65 ± 0.47 b (7) |
0.84 ± 0.07 ab (8) |
| Triglycerides (mg/dL) |
52.29 ± 3.1 a (7) |
54.2 ± 5.72 a (5) |
82.7 ± 6.93 b (10) |
57 ± 4.79 a (8) |
| VLDL-C (mg/dL) |
10.46 ± 0.62 a (7) |
10.84 ± 1.14 a (5) |
16.54 ± 1.39 b (10) |
11.4 ± 0.96 a (8) |
| HDL-C (mg/dL) |
76.50 ± 3.83 a (5) |
75.50 ± 3.88 a (6) |
64.25 ± 1.36 a (5) |
70.50 ± 6.29 a (4) |
| LDL-C (mg/dL) |
22.27 ± 3.83 a (5) |
25.7 ± 0.95 ab (6) |
60.2 ± 4.94 c (5) |
50.36 ± 9.64 cb (4) |
| LDL-C/HDL-C ratio |
0.24 ± 0.06 a (5) |
0.38 ± 0.01 ab (6) |
0.94 ± 0.09 cb (5) |
0.72 ± 0.23 ac (4) |
| Non-HDL-C (mg/dL) |
31.4 ± 3.36 a (5) |
36.5 ± 2.13 ab (5) |
76.3 ± 5.17 c (5) |
62.1 ± 10.58 bc (4) |
Note: To determine plasma lipid profile, blood samples were collected from the retro orbital plexus of mice after a 14-hr fast on day 57. VLDL-C and LDL-C values were calculated as described in ‘Materials and methods’. Data are expressed as means ± SEM. Numbers in parentheses indicate the number of mice in each group.
Different letters (a, b and c) indicate statistical significance of p < 0.05, using regular two-way ANOVA followed by Tukey's multiple comparisons test.
3.8. SFN attenuates HFHS diet-induces changes in SBP
On day 1, there were no significant differences in SBP, DBP, MAP or heart rate among all groups (data not shown). At the end of the experiment (day 55), HFHS diet-fed mice showed a trend toward an increase in SBP (by ~8.4%) but without statistical significance, compared with CON group. SFN treatment decreased SBP by ~13.7% in HFHS diet-fed mice (p < 0.05) [Table 2].
Table 2.
Effects of SFN treatment on SBP, DBP, MAP and HR in HFHS and CON diet-induced fed mice.
| CON | HFHS | |||
|---|---|---|---|---|
| − SFN | + SFN | − SFN | + SFN | |
| SBP (mm Hg) |
111.6 ± 3.82 ab (8) |
112 ± 4.31 ab (6) |
121 ± 3.41 b (8) |
104.4 ± 4.43 a (8) |
| DBP (mm Hg) |
50.5 ± 2.7 a (8) |
49.5 ± 4.1 a (6) |
50.13 ± 1.96 a (8) |
45.3 ± 7.33 a (8) |
| MAP (mm Hg) |
70.3 ± 2.83 a (8) |
70 ± 3.52 a (6) |
75.3 ± 1.65 a (8) |
64.6 ± 6.23 a (8) |
| HR (beats/min) |
640.5 ± 14.48 (8) |
677.8 ± 22.9 a (6) |
665.8 ± 19.33 a (9) |
684.1 ± 17.05 a (8) |
Note: Tail cuff method was used to measure blood pressure and heart rate toward the end of the experiment (55 days of respective diets, 21 days of SFN treatments). Data are expressed as means ± SEM. Numbers in parentheses indicate the number of mice in each group.
Different letters (a, b and c) indicate statistical significance of p < 0.05, using regular two-way ANOVA followed by Tukey's multiple comparisons test.
SBP, systolic blood pressure; DBP, diastolic blood pressure; MAP, mean arterial pressure; HR, heart rate.
3.9. SFN attenuates injury-induced neointima formation in HFHS diet-fed mice
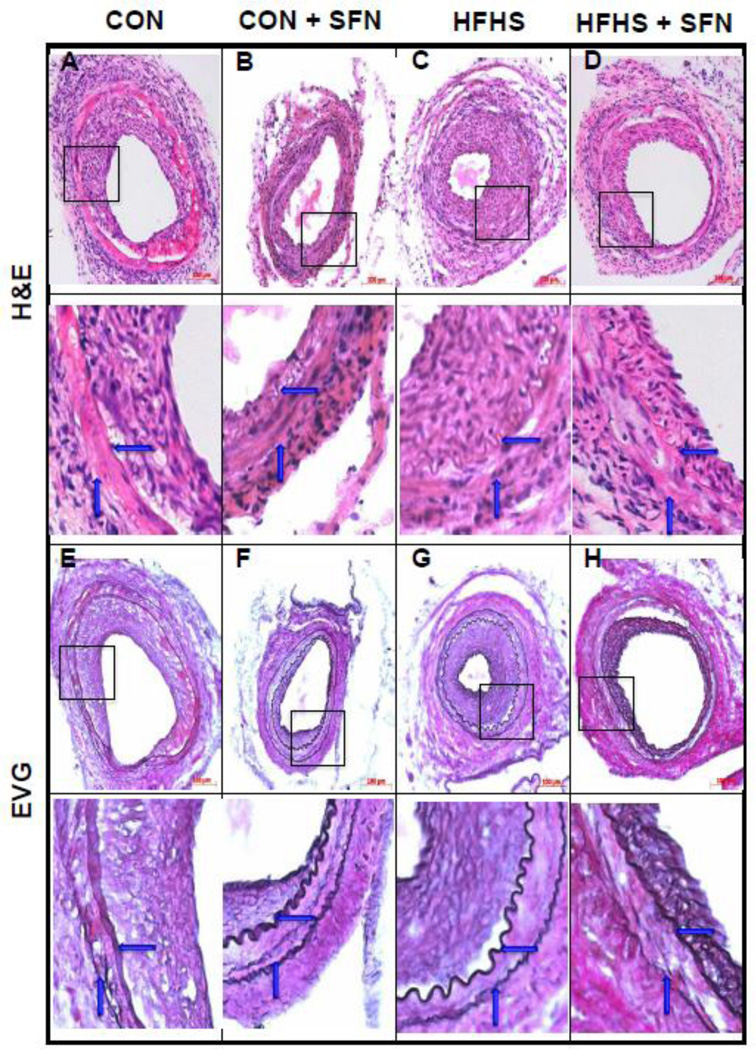
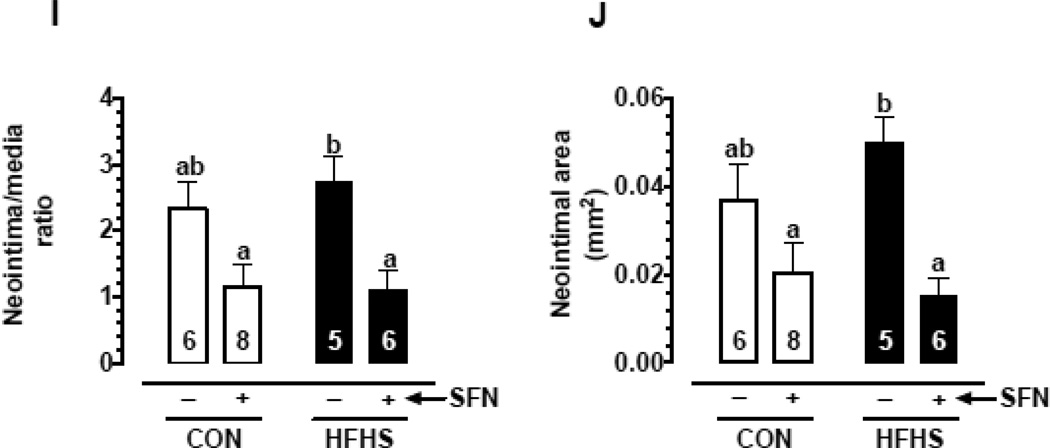
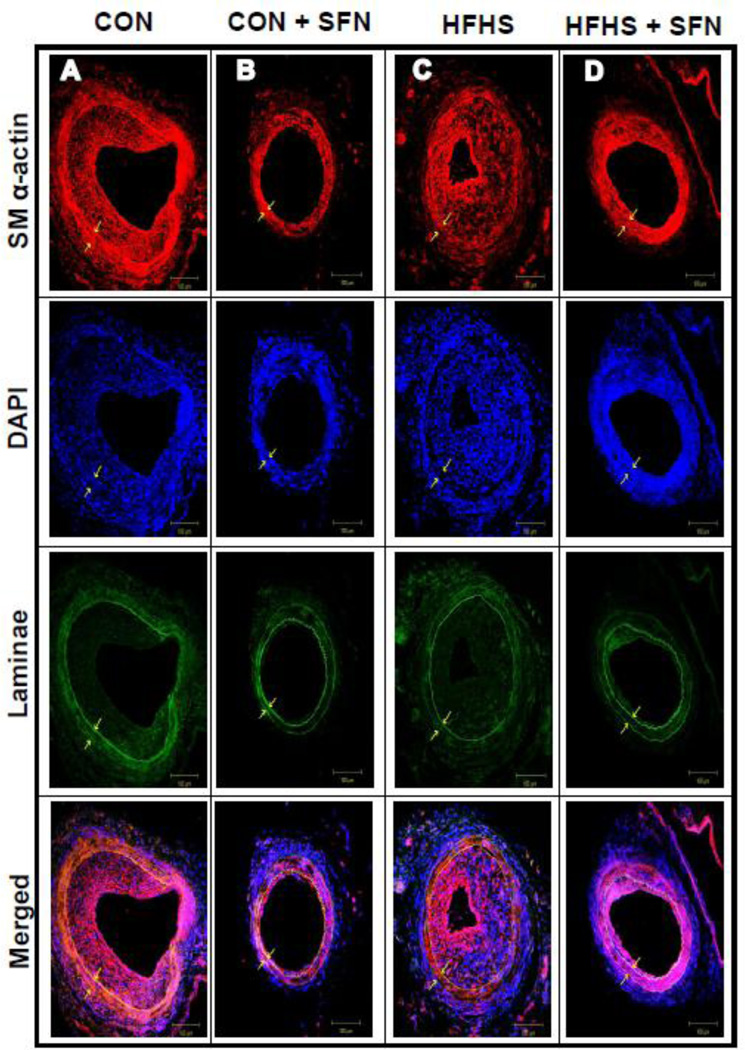
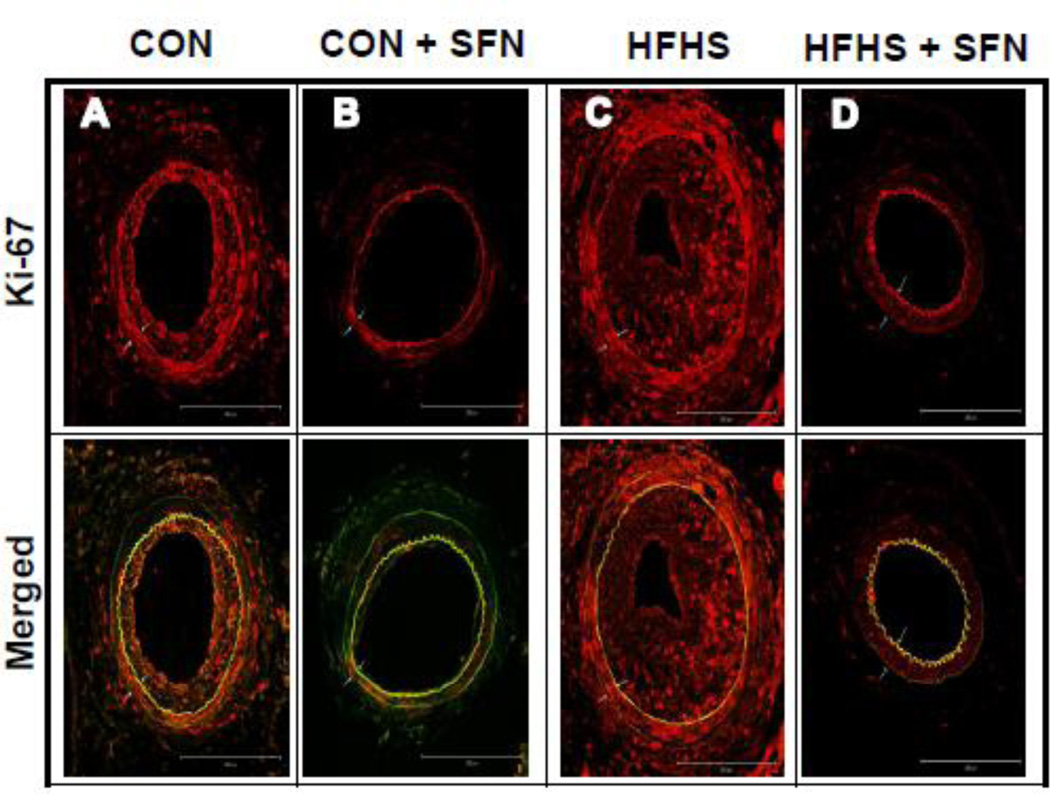
Recent studies have shown that SFN attenuates neointima formation after carotid artery injury in rats with normal metabolic milieu [5, 6, 26]. However, it remains unknown as to whether SFN exhibits vasoprotective effects in the setting of diet-induced obesity. As shown in Fig. 2 (A–J)), femoral artery injury in HFHS diet-fed mice resulted in modest but insignificant increases in neointima/media ratio (1.2-fold) and neointimal area (1.35-fold) with a decrease in lumen area (21.7%, data not shown), compared with CON group. SFN treatment in HFHS-fed mice led to a significant decrease in injury-induced neointima/media ratio by 60.1% (p < 0.05) and neointimal area by 70% (p < 0.05) with a modest increase in the lumen area by 38.9% (data not shown). In parallel, SFN treatment in CON diet-fed mice resulted in decreases in neointima/media ratio by 51.1% (95% CI of the difference = −0.199 to 2.58, p > 0.05) and neointimal area by 46% (95% CI of the difference = −0.01 to 0.043, p > 0.05). Medial layer was not significantly different between all groups (data not shown). Immunofluorescence analysis of injured femoral artery 3 weeks after SFN intervention revealed a marked decrease in smooth muscle cells in the neointimal layer (Fig. 3A–D). In addition, immunofluorescence analysis showed a marked decrease in Ki-67 immunoreactivity (a marker of VSMC proliferation) in the injured femoral arteries from SFN-treated CON and HFHS diet-fed mice (Fig. 4A–D). The femoral artery sections that were incubated without the primary antibody for Ki-67 (negative controls) showed no red fluorescence (data not shown).
Fig. 2.
Effects of SFN on neointima formation after femoral artery injury in HFHS diet-fed mice. SFN was injected subcutaneously (0.5 mg/Kg/day) in HFHS diet-fed mice starting from day 35 (1 day before femoral artery injury) and continued for the next 23 days until sacrifice (day 57). In parallel, CON diet-fed mice were subjected to femoral artery injury with and without SFN treatment. A–D) Hematoxylin and Eosin (H&E) and E–H) Elastic Van Gieson (EVG) staining of injured femoral arteries from CON and HFHS diet-fed mice (−/+ SFN); arrows indicate internal and external elastic laminae; scale bars represent 100 µm. I–J) Morphometric analyses of injured femoral arteries that include neointima/media ratio (I) and neointimal area (J). The data shown are the means ± SEM. Numbers within the bars represent the number of mice in each group. Different letters (a and b) indicate statistical significance of p < 0.05, using using regular two-way ANOVA followed by Tukey's multiple comparisons test. Groups sharing a common letter are not statistically significant.
Fig. 3.
Effects of SFN on smooth muscle α-actin expression in the injured femoral artery from HFHS diet-fed mice. Confocal immunofluorescence analysis of smooth muscle (SM) α-actin (red), nuclei (DAPI, blue), elastin autofluorescence (laminae, green) and merged images in the injured femoral arteries. The representative images from CON (A), CON+SFN (B), HFHS (C) and HFHS+SFN (D) groups are shown; scale bars represent 100 µm.
Fig. 4.
Effects of SFN on Ki-67 immunoreactivity in the injured femoral artery from HFHS diet-fed mice. Confocal immunofluorescence analysis of Ki-67 (red) and the merged [Ki-67 (red) and elastin autofluorescence (green)] images in the injured femoral arteries. The representative images from CON (A), CON+SFN (B), HFHS (C) and HFHS+SFN (D) groups are shown; scale bars represent 200 µm. White arrows indicate internal and external elastic laminae.
3.10. SFN inhibits leptin-induced key proliferative signaling in vascular smooth muscle cells
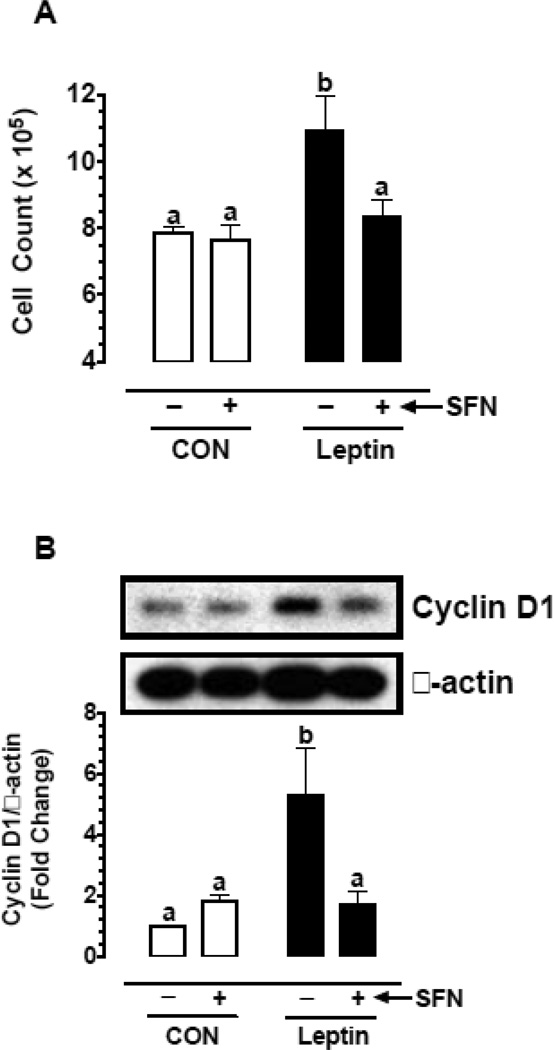
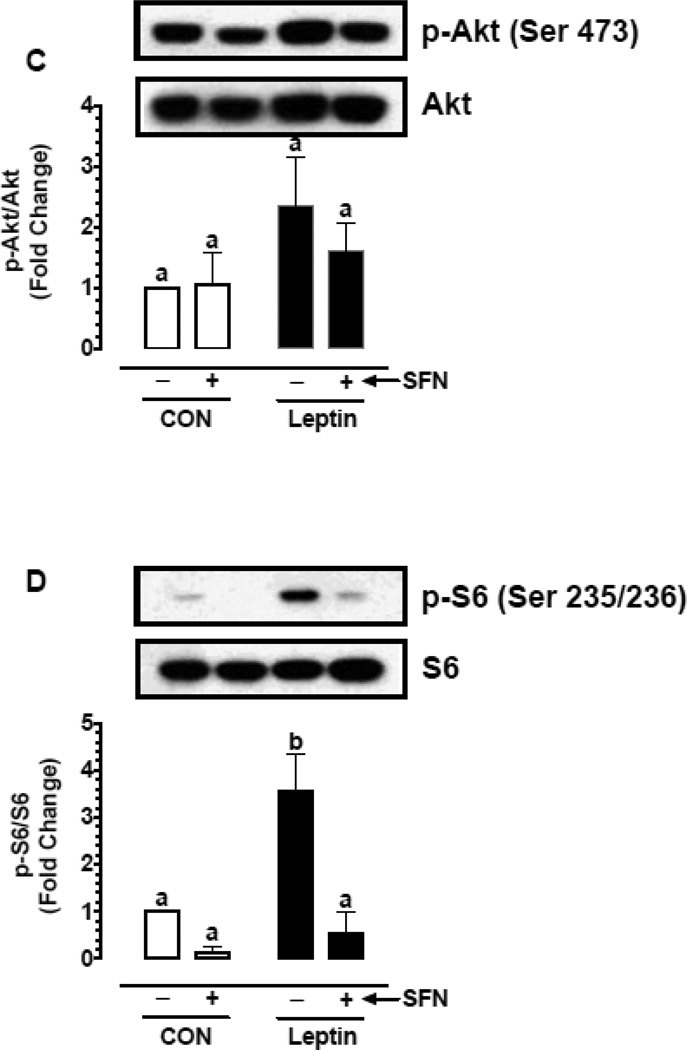
Previous studies have shown that leptin enhances vascular smooth muscle cell (VSMC) proliferation through activation of mTOR/p70S6K signaling [16, 48]. In the present study (Fig. 5A–D), exposure of VSMCs to leptin (6 nM) for 96 hr led to increases in cell proliferation by 1.39-fold (p < 0.05), cyclin D1 expression by 5.3-fold (p < 0.05), and the phosphorylation of Akt and ribosomal S6 protein by 2.3-fold (non-significant) and 3.6-fold (p < 0.05), respectively. Pretreatment with SFN led to significant decreases (p < 0.05) in leptin-induced VSMC proliferation (by 23.3%), cyclin D1 expression (by 67.6%), and S6 phosphorylation (by 84.7%). However, SFN treatment did not result in a significant change in Akt phosphorylation.
Fig. 5.
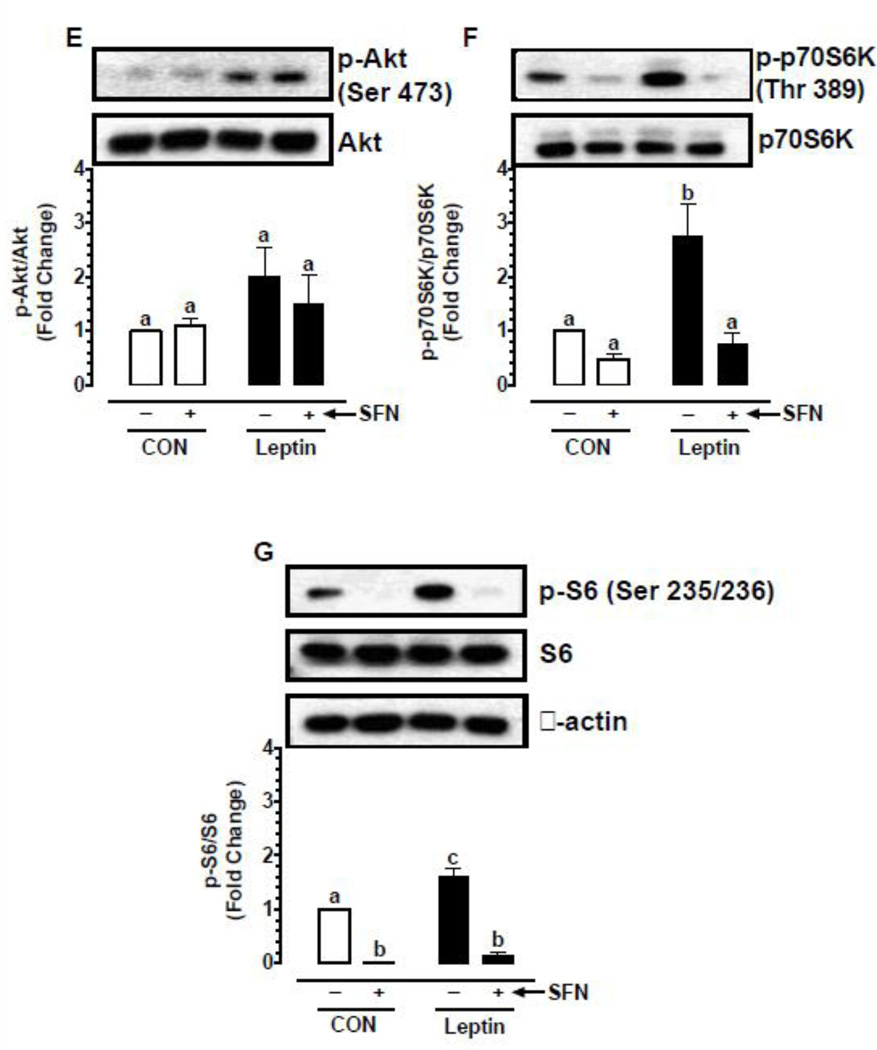
Effects of SFN on leptin-induced key proliferative signaling in VSMCs. A–D) Serum-deprived VSMCs were treated with SFN (5 µM) or vehicle (control) for 30 min followed by exposure to leptin (6 nM) for 96 hr. The changes in cell number were determined using automated counter. Cyclin D1 expression and the phosphorylation state of Akt and S6 were determined by immunoblot analysis, as described. E–G) Serum-deprived VSMCs were treated with SFN (5 µM) or vehicle (control) for 3 hr. During the last 20 min of this treatment period, the cells were exposed to leptin (6 nM). The changes in the phosphorylation state of Akt, p70S6K, and S6 were determined by immunoblot analysis, as described. β-actin was used as an internal control. The data shown in the bar graphs are the means ± SEM from 3–5 separate experiments. Different letters (a and b) indicate statistical significance of p < 0.05, using regular two-way ANOVA followed by Tukey's multiple comparisons test. Groups sharing a common letter are not statistically significant.
To confirm the differential effects of SFN on Akt versus S6 phosphorylation, VSMCs were pretreated with SFN followed by acute exposure to leptin (6 nM) for 20 min, as described (Fig 5E–G). Even under these conditions, SFN did not significantly affect leptin-induced Akt phosphorylation. Importantly, SFN not only decreased leptin-induced S6 phosphorylation by 91.5% (p < 0.05) but also diminished the phosphorylation of p70S6K (an upstream kinase for S6) by 72.5% (p < 0.05). Thus, pretreatment of VSMCs with SFN led to a marked decrease in leptin-induced phosphorylation of p70S6K and S6.
4. Discussion
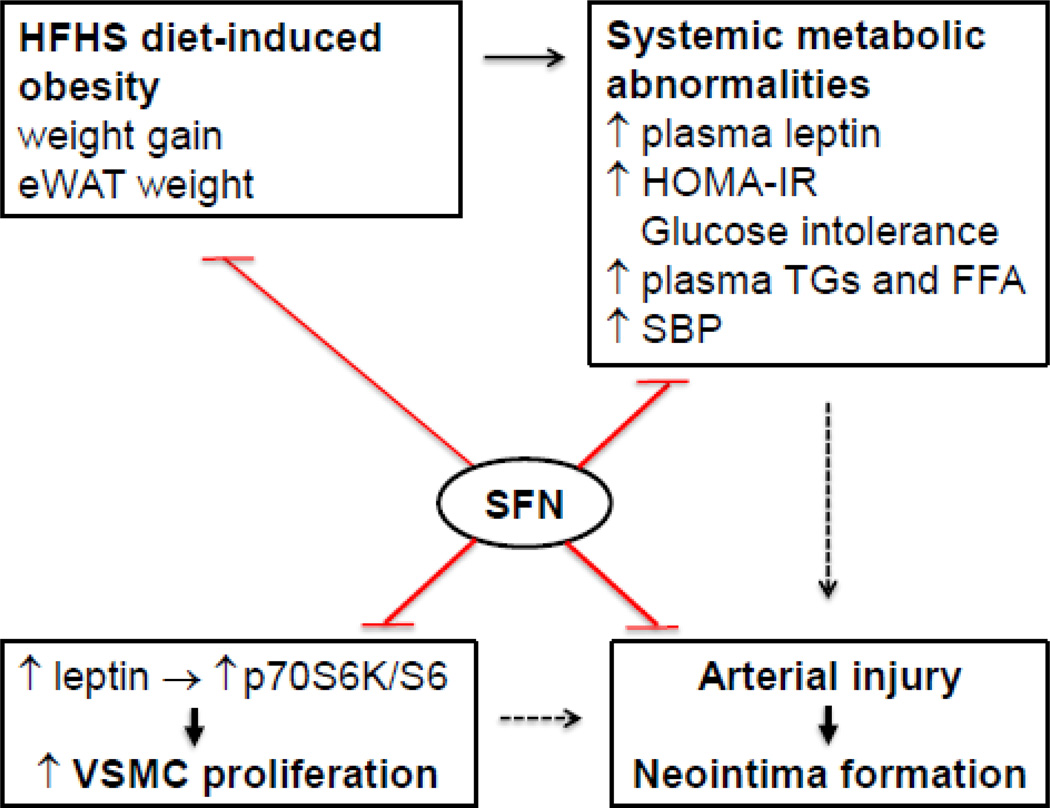
The present study demonstrates for the first time that, in the setting of diet-induced obesity, SFN intervention improved systemic metabolic abnormalities and suppressed neointima formation in the injured vessel wall. In particular, SFN treatment in western diet (HFHS)-fed obese mice led to: i) a decrease in weight gain and eWAT weight; ii) attenuation of hyperleptinemia; iii) improvement in HOMA-IR (an index of insulin resistance) and glucose tolerance; iv) improvement in dyslipidemia; and v) a decrease in systolic blood pressure. Under these conditions, SFN inhibition of dysregulated vascular smooth muscle phenotype was evidenced by ~60% decrease in intima/media ratio in the injured femoral artery from HFHS diet-fed mice, compared with ~51% decrease in intima/media ratio from control diet-fed mice. Under in vitro conditions, SFN diminished leptin-induced VSMC proliferation by targeting key signaling components (e.g., p70S6K/S6). Thus, SFN intervention during revascularization procedures in diet-induced obesity has the potential to suppress neointima formation at the lesion site, an effect possibly mediated through an improvement in dysregulated metabolic profile and VSMC-specific inhibition of leptin-induced key proliferative signaling (Fig. 6).
Fig. 6.
Effects of SFN on dysregulated metabolic parameters and injury-induced neointima formation in western diet (HFHS)-fed obese C57BL/6J mice. SFN treatment attenuates weight gain and eWAT weight and improves systemic metabolic abnormalities (e.g., ↓ plasma leptin and insulin, improves HOMA-IR and glucose tolerance, and lowers plasma triglycerides/FFA and systolic blood pressure). In addition, SFN suppresses injury-induced intimal hyperplasia in the femoral artery and inhibits leptin-induced VSMC proliferation by targeting p70S6K/S6 signaling. The use of SFN as a dietary supplement may provide a rational prophylactic approach to target restenosis after angioplasty in diet-induced obesity.
Previous studies have shown that SFN suppresses neointima formation in rat models of carotid artery injury [5, 6, 26]. In these studies, the vasoprotective effects of SFN have been observed in rats fed a normal diet with no obvious metabolic abnormalities. In addition, SFN has been delivered by two different approaches but with similar outcomes. For instance, local delivery of SFN via pluronic gel close to the lesion site [5, 6] or intraperitoneal injection of SFN [26] for up to 2 weeks leads to inhibition of neointima formation in balloon/wire-injured rat carotid artery. Importantly, arterial injury is associated with the local release of platelet-derived growth factor (PDGF) from several cell types including VSMCs, and this would contribute to enhanced VSMC proliferation [49]. In this regard, SFN has been shown to inhibit PDGF-induced VSMC proliferation through upregulation of p53 and the resultant inhibition of cell cycle regulatory events critical for G1/S progression [6]. In the present study, subcutaneous administration of SFN attenuated neointima formation in the mouse model of femoral artery injury under metabolically compromised conditions.
In addition to PDGF, adipose tissue-derived cytokines/adipokines [50, 51], including TNFα [52, 53] and leptin [15, 16, 54, 55], contribute to dysregulated vascular phenotype especially in the setting of obesity. In particular, TNFα has been shown to exhibit proliferative and/or apoptotic effects in VSMCs [52, 53] and pro-inflammatory effects in the vessel wall. SFN treatment prevents TNFα-induced pro-inflammatory effects by inhibiting endothelial and smooth muscle cell expression of adhesion molecules (e.g., ICAM-1 and VCAM-1) via suppression of nuclear factor-kappa B (NF-κB) [5, 23, 56, 57]. Importantly, hyperleptinemia is implicated in HFD-induced increase in neointima formation after injury in mouse carotid artery [15]. Thus, leptin enhances VSMC proliferation as evidenced in previous in vivo and in vitro studies [15, 16, 54, 55] and the present in vitro study. SFN treatment lowers HFHS diet-induced increase in plasma leptin by 42% and inhibits leptin-induced VSMC proliferation by ~23% in the present study. Together, these findings suggest that SFN has the potential to inhibit pro-inflammatory and proliferative phenotype in the vessel wall by targeting adipose tissue-derived TNFα or leptin.
It is well accepted that hyperleptinemia and the associated leptin resistance in obese phenotype contribute to insulin resistance and vascular complications [58]. Importantly, resistance to the physiological actions of leptin at the level of pancreatic β-cells results in the development of hyperinsulinemia [45, 46, 59]. Moreover, leptin resistance reduces the hypothalamic response to insulin thereby impairing peripheral glucose homeostasis [60]. In addition, clinical studies have shown that plasma leptin is more closely correlated with plasma insulin [61, 62] and inversely correlated with insulin sensitivity [63]. From the present findings in HFHS diet-fed mice, it is apparent that SFN-mediated decrease in plasma leptin may in part be accountable for the observed decrease in plasma insulin and improvements in HOMA-IR value (an index of insulin resistance) and glucose tolerance. At this juncture, it is important to note that in HFD fed-mice, nrf2 inducers such as SFN, triterpenoid CDDO-imidazolide, and oltipraz attenuate weight gain and visceral adiposity [13, 64, 65] and prevent insulin resistance [65]. It is likely that SFN treatment in HSHS diet-fed mice (present study) inhibits the obese phenotype in a similar manner through nrf2 activation in adipocytes. Nevertheless, the role of nrf2 in adipogenesis remains controversial [66]. Further studies are clearly warranted to provide a definitive link between decreased adiposity/circulating leptin and improved insulin resistance upon SFN intervention in diet-induced obesity. It is noteworthy that the use of a non-invasive technique such as dual-energy X-ray absorptiometry (DEXA) scan in rodents or humans would provide a realistic approach to effectively characterize lean and fat volumes [67].
The role of leptin in the control of atherosclerotic lesion development or neointima formation is determined by several factors, including normal versus atherogenic diet, lean versus obese phenotype, insulin deficiency versus hyperinsulinemia, dyslipidemia, and functional leptin receptor signaling in the vessel wall. For instance, in LDL receptor-deficient atherogenic mouse model, deletion of leptin gene (ob/ob) results in exaggerated hypercholesterolemia and atherosclerosis [68]. Our recent study demonstrates that in lean, insulin- and leptin-deficient Ins2+/Akita:apoE−/− mice on a normal diet, low-dose leptin therapy diminishes the progression of exaggerated atherosclerosis by attenuating hypercholesterolemia [69]. Contrarily, in apoE−/− mice on a western diet, leptin administration enhances atherosclerosis presumably by its direct effects at the lesion site in spite of its metabolic benefits [14]. Importantly, studies by Schroeter et al. and Zeadin et al. have shown that in apoE−/− mice on a normal or atherogenic diet, leptin administration does not exaggerate atherosclerotic lesion [55, 70] or neointima formation [55]. This is most likely because leptin requires intact apoE in the vessel wall to promote lesion development [55]. In this regard, leptin administration in C57BL/6J mice on a normal or atherogenic diet has been shown to enhance neointima formation after chemical/mechanical injury to carotid or femoral artery [15, 16]. In line with the previous study [16], the present findings suggest that leptin activation of p70S6K/S6 signaling is associated with enhanced VSMC proliferation, a key component of atherogenesis and neointima formation. In HFHS diet-fed obese C57BL/6J mice that display hyperinsulinemia and increased HOMA-IR (present study), elevated level of endogenous leptin in the circulation is associated with a modest increase in neointima formation after arterial injury. At this juncture, it is important to note that in patients with angiographically confirmed coronary atherosclerosis, enhanced plasma leptin level serves as a biomarker of future cardiovascular events [71]. The present findings that demonstrate SFN inhibition of intimal hyperplasia in conjunction with its leptin-lowering effect in diet-induced obesity suggest the potential for this isothiocyanate derivative to exert direct inhibitory effects on leptin synthesis/release from adipose tissue and leptin-induced proliferative signaling (p70S6K/S6) in VSMCs in the injured vessel wall. Although SFN does not affect the increases in the circulating levels of total cholesterol and LDL-cholesterol in HFHS diet-fed mice, it significantly diminishes FFA and triglyceride levels. Future studies should determine whether SFN suppresses the development of atherosclerosis by attenuating hyperleptinemia and dyslipidemia in western diet-fed LDL receptor-deficient mice, an established animal model of atherosclerosis with an intact apoE.
In conclusion, the present findings suggest that SFN intervention during revascularization procedures under metabolically compromised conditions has the potential to suppress the progression of exaggerated intimal hyperplasia in vulnerable vessels by targeting hyperleptinemia and leptin-induced VSMC proliferation, especially in the setting of diet-induced obesity. The use of SFN as a dietary supplement may provide a rational prophylactic approach to target restenosis after angioplasty in obese subjects.
Supplementary Material
Acknowledgments
This work was supported by the National Heart, Lung, and Blood Institute/National Institutes of Health Grant (R01-HL-097090), University of Georgia Research Foundation Fund, and Egyptian Government Scholarship Fund from the Egyptian Cultural and Educational Bureau.
Footnotes
Publisher's Disclaimer: This is a PDF file of an unedited manuscript that has been accepted for publication. As a service to our customers we are providing this early version of the manuscript. The manuscript will undergo copyediting, typesetting, and review of the resulting proof before it is published in its final citable form. Please note that during the production process errors may be discovered which could affect the content, and all legal disclaimers that apply to the journal pertain.
References
- 1.Danaei G, Singh GM, Paciorek CJ, Lin JK, Cowan MJ, Finucane MM, et al. The global cardiovascular risk transition: associations of four metabolic risk factors with national income, urbanization, and Western diet in 1980 and 2008. Circulation. 2013;127:1493–1502. 502e1–502e8. doi: 10.1161/CIRCULATIONAHA.113.001470. [DOI] [PMC free article] [PubMed] [Google Scholar]
- 2.Jensen MD, Ryan DH, Apovian CM, Ard JD, Comuzzie AG, Donato KA, et al. 2013 AHA/ACC/TOS guideline for the management of overweight and obesity in adults: a report of the American College of Cardiology/American Heart Association Task Force on Practice Guidelines and The Obesity Society. J Am Coll Cardiol. 2014;63:2985–3023. doi: 10.1016/j.jacc.2013.11.004. [DOI] [PubMed] [Google Scholar]
- 3.Dauchet L, Amouyel P, Dallongeville J. Fruits, vegetables and coronary heart disease. Nature reviews Cardiology. 2009;6:599–608. doi: 10.1038/nrcardio.2009.131. [DOI] [PubMed] [Google Scholar]
- 4.Wu L, Noyan Ashraf MH, Facci M, Wang R, Paterson PG, Ferrie A, et al. Dietary approach to attenuate oxidative stress, hypertension, and inflammation in the cardiovascular system. Proc Natl Acad Sci U S A. 2004;101:7094–7099. doi: 10.1073/pnas.0402004101. [DOI] [PMC free article] [PubMed] [Google Scholar]
- 5.Kwon JS, Joung H, Kim YS, Shim YS, Ahn Y, Jeong MH, et al. Sulforaphane inhibits restenosis by suppressing inflammation and the proliferation of vascular smooth muscle cells. Atherosclerosis. 2012;225:41–49. doi: 10.1016/j.atherosclerosis.2012.07.040. [DOI] [PubMed] [Google Scholar]
- 6.Yoo SH, Lim Y, Kim SJ, Yoo KD, Yoo HS, Hong JT, et al. Sulforaphane inhibits PDGF-induced proliferation of rat aortic vascular smooth muscle cell by up-regulation of p53 leading to G1/S cell cycle arrest. Vascul Pharmacol. 2013;59:44–51. doi: 10.1016/j.vph.2013.06.003. [DOI] [PubMed] [Google Scholar]
- 7.Kim JW, Lim SC, Lee MY, Lee JW, Oh WK, Kim SK, et al. Inhibition of neointimal formation by trans-resveratrol: role of phosphatidyl inositol 3-kinase-dependent Nrf2 activation in heme oxygenase-1 induction. Molecular nutrition & food research. 2010;54:1497–1505. doi: 10.1002/mnfr.201000016. [DOI] [PubMed] [Google Scholar]
- 8.Javkhedkar AA, Quiroz Y, Rodriguez-Iturbe B, Vaziri ND, Lokhandwala MF, Banday AA. Resveratrol restored Nrf2 function, reduced renal inflammation, and mitigated hypertension in spontaneously hypertensive rats. Am J Physiol Regul Integr Comp Physiol. 2015;308:R840–R846. doi: 10.1152/ajpregu.00308.2014. [DOI] [PMC free article] [PubMed] [Google Scholar]
- 9.Avila PR, Marques SO, Luciano TF, Vitto MF, Engelmann J, Souza DR, et al. Resveratrol and fish oil reduce catecholamine-induced mortality in obese rats: role of oxidative stress in the myocardium and aorta. Br J Nutr. 2013;110:1580–1590. doi: 10.1017/S0007114513000925. [DOI] [PubMed] [Google Scholar]
- 10.Hasan ST, Zingg JM, Kwan P, Noble T, Smith D, Meydani M. Curcumin modulation of high fat diet-induced atherosclerosis and steatohepatosis in LDL receptor deficient mice. Atherosclerosis. 2014;232:40–51. doi: 10.1016/j.atherosclerosis.2013.10.016. [DOI] [PubMed] [Google Scholar]
- 11.Mattison JA, Wang M, Bernier M, Zhang J, Park SS, Maudsley S, et al. Resveratrol prevents high fat/sucrose diet-induced central arterial wall inflammation and stiffening in nonhuman primates. Cell Metab. 2014;20:183–190. doi: 10.1016/j.cmet.2014.04.018. [DOI] [PMC free article] [PubMed] [Google Scholar]
- 12.Pearson KJ, Baur JA, Lewis KN, Peshkin L, Price NL, Labinskyy N, et al. Resveratrol delays age-related deterioration and mimics transcriptional aspects of dietary restriction without extending life span. Cell Metab. 2008;8:157–168. doi: 10.1016/j.cmet.2008.06.011. [DOI] [PMC free article] [PubMed] [Google Scholar]
- 13.Choi KM, Lee YS, Kim W, Kim SJ, Shin KO, Yu JY, et al. Sulforaphane attenuates obesity by inhibiting adipogenesis and activating the AMPK pathway in obese mice. J Nutr Biochem. 2014;25:201–207. doi: 10.1016/j.jnutbio.2013.10.007. [DOI] [PubMed] [Google Scholar]
- 14.Bodary PF, Gu S, Shen Y, Hasty AH, Buckler JM, Eitzman DT. Recombinant leptin promotes atherosclerosis and thrombosis in apolipoprotein E-deficient mice. Arterioscler Thromb Vasc Biol. 2005;25:e119–e122. doi: 10.1161/01.ATV.0000173306.47722.ec. [DOI] [PubMed] [Google Scholar]
- 15.Schafer K, Halle M, Goeschen C, Dellas C, Pynn M, Loskutoff DJ, et al. Leptin promotes vascular remodeling and neointimal growth in mice. Arterioscler Thromb Vasc Biol. 2004;24:112–117. doi: 10.1161/01.ATV.0000105904.02142.e7. [DOI] [PubMed] [Google Scholar]
- 16.Shan J, Nguyen TB, Totary-Jain H, Dansky H, Marx SO, Marks AR. Leptin-enhanced neointimal hyperplasia is reduced by mTOR and PI3K inhibitors. Proc Natl Acad Sci U S A. 2008;105:19006–19011. doi: 10.1073/pnas.0809743105. [DOI] [PMC free article] [PubMed] [Google Scholar]
- 17.Bahadoran Z, Mirmiran P, Azizi F. Potential efficacy of broccoli sprouts as a unique supplement for management of type 2 diabetes and its complications. Journal of medicinal food. 2013;16:375–382. doi: 10.1089/jmf.2012.2559. [DOI] [PubMed] [Google Scholar]
- 18.Bahadoran Z, Tohidi M, Nazeri P, Mehran M, Azizi F, Mirmiran P. Effect of broccoli sprouts on insulin resistance in type 2 diabetic patients: a randomized double-blind clinical trial. International journal of food sciences and nutrition. 2012;63:767–771. doi: 10.3109/09637486.2012.665043. [DOI] [PubMed] [Google Scholar]
- 19.Kubota T, Kubota N, Moroi M, Terauchi Y, Kobayashi T, Kamata K, et al. Lack of insulin receptor substrate-2 causes progressive neointima formation in response to vessel injury. Circulation. 2003;107:3073–3080. doi: 10.1161/01.CIR.0000070937.52035.25. [DOI] [PubMed] [Google Scholar]
- 20.Kozakova M, Natali A, Dekker J, Beck-Nielsen H, Laakso M, Nilsson P, et al. Insulin sensitivity and carotid intima-media thickness: relationship between insulin sensitivity and cardiovascular risk study. Arterioscler Thromb Vasc Biol. 2013;33:1409–1417. doi: 10.1161/ATVBAHA.112.300948. [DOI] [PubMed] [Google Scholar]
- 21.Wu L, Juurlink BH. The impaired glutathione system and its up-regulation by sulforaphane in vascular smooth muscle cells from spontaneously hypertensive rats. J Hypertens. 2001;19:1819–1825. doi: 10.1097/00004872-200110000-00016. [DOI] [PubMed] [Google Scholar]
- 22.Xu C, Yuan X, Pan Z, Shen G, Kim JH, Yu S, et al. Mechanism of action of isothiocyanates: the induction of ARE-regulated genes is associated with activation of ERK and JNK and the phosphorylation and nuclear translocation of Nrf2. Mol Cancer Ther. 2006;5:1918–1926. doi: 10.1158/1535-7163.MCT-05-0497. [DOI] [PubMed] [Google Scholar]
- 23.Kim JY, Park HJ, Um SH, Sohn EH, Kim BO, Moon EY, et al. Sulforaphane suppresses vascular adhesion molecule-1 expression in TNF-alpha-stimulated mouse vascular smooth muscle cells: involvement of the MAPK, NF-kappaB and AP-1 signaling pathways. Vascul Pharmacol. 2012;56:131–141. doi: 10.1016/j.vph.2011.11.007. [DOI] [PubMed] [Google Scholar]
- 24.Miao X, Bai Y, Sun W, Cui W, Xin Y, Wang Y, et al. Sulforaphane prevention of diabetes-induced aortic damage was associated with the up-regulation of Nrf2 and its down-stream antioxidants. Nutrition & metabolism. 2012;9:84. doi: 10.1186/1743-7075-9-84. [DOI] [PMC free article] [PubMed] [Google Scholar]
- 25.Hanlon N, Coldham N, Gielbert A, Kuhnert N, Sauer MJ, King LJ, et al. Absolute bioavailability and dose-dependent pharmacokinetic behaviour of dietary doses of the chemopreventive isothiocyanate sulforaphane in rat. Br J Nutr. 2008;99:559–564. doi: 10.1017/S0007114507824093. [DOI] [PubMed] [Google Scholar]
- 26.Orozco-Sevilla V, Naftalovich R, Hoffmann T, London D, Czernizer E, Yang C, et al. Epigallocatechin-3-gallate is a potent phytochemical inhibitor of intimal hyperplasia in the wire-injured carotid artery. J Vasc Surg. 2013;58:1360–1365. doi: 10.1016/j.jvs.2012.11.090. [DOI] [PMC free article] [PubMed] [Google Scholar]
- 27.Ayala JE, Bracy DP, McGuinness OP, Wasserman DH. Considerations in the design of hyperinsulinemic-euglycemic clamps in the conscious mouse. Diabetes. 2006;55:390–397. doi: 10.2337/diabetes.55.02.06.db05-0686. [DOI] [PubMed] [Google Scholar]
- 28.Ayala JE, Samuel VT, Morton GJ, Obici S, Croniger CM, Shulman GI, et al. Standard operating procedures for describing and performing metabolic tests of glucose homeostasis in mice. Disease models & mechanisms. 2010;3:525–534. doi: 10.1242/dmm.006239. [DOI] [PMC free article] [PubMed] [Google Scholar]
- 29.Becker M, Rabe K, Lebherz C, Zugwurst J, Goke B, Parhofer KG, et al. Expression of human chemerin induces insulin resistance in the skeletal muscle but does not affect weight, lipid levels, and atherosclerosis in LDL receptor knockout mice on high-fat diet. Diabetes. 2010;59:2898–2903. doi: 10.2337/db10-0362. [DOI] [PMC free article] [PubMed] [Google Scholar]
- 30.Asai A, Nagao M, Kawahara M, Shuto Y, Sugihara H, Oikawa S. Effect of impaired glucose tolerance on atherosclerotic lesion formation: an evaluation in selectively bred mice with different susceptibilities to glucose intolerance. Atherosclerosis. 2013;231:421–426. doi: 10.1016/j.atherosclerosis.2013.10.009. [DOI] [PubMed] [Google Scholar]
- 31.Matthews DR, Hosker JP, Rudenski AS, Naylor BA, Treacher DF, Turner RC. Homeostasis model assessment: insulin resistance and beta-cell function from fasting plasma glucose and insulin concentrations in man. Diabetologia. 1985;28:412–419. doi: 10.1007/BF00280883. [DOI] [PubMed] [Google Scholar]
- 32.Friedewald WT, Levy RI, Fredrickson DS. Estimation of the concentration of low-density lipoprotein cholesterol in plasma, without use of the preparative ultracentrifuge. Clin Chem. 1972;18:499–502. [PubMed] [Google Scholar]
- 33.Quispe R, Manalac RJ, Faridi KF, Blaha MJ, Toth PP, Kulkarni KR, et al. Relationship of the triglyceride to high-density lipoprotein cholesterol (TG/HDL-C) ratio to the remainder of the lipid profile: The Very Large Database of Lipids-4 (VLDL-4) study. Atherosclerosis. 2015;242:243–250. doi: 10.1016/j.atherosclerosis.2015.06.057. [DOI] [PubMed] [Google Scholar]
- 34.Sata M, Maejima Y, Adachi F, Fukino K, Saiura A, Sugiura S, et al. A mouse model of vascular injury that induces rapid onset of medial cell apoptosis followed by reproducible neointimal hyperplasia. J Mol Cell Cardiol. 2000;32:2097–2104. doi: 10.1006/jmcc.2000.1238. [DOI] [PubMed] [Google Scholar]
- 35.Basi DL, Adhikari N, Mariash A, Li Q, Kao E, Mullegama SV, et al. Femoral artery neointimal hyperplasia is reduced after wire injury in Ref-1+/− mice. Am J Physiol Heart Circ Physiol. 2007;292:H516–H521. doi: 10.1152/ajpheart.00246.2006. [DOI] [PubMed] [Google Scholar]
- 36.Galarraga M, Campion J, Munoz-Barrutia A, Boque N, Moreno H, Martinez JA, et al. Adiposoft: automated software for the analysis of white adipose tissue cellularity in histological sections. Journal of lipid research. 2012;53:2791–2796. doi: 10.1194/jlr.D023788. [DOI] [PMC free article] [PubMed] [Google Scholar]
- 37.Pyla R, Poulose N, Jun JY, Segar L. Expression of conventional and novel glucose transporters, GLUT1 -9, -10, and -12, in vascular smooth muscle cells. Am J Physiol Cell Physiol. 2013;304:C574–C589. doi: 10.1152/ajpcell.00275.2012. [DOI] [PMC free article] [PubMed] [Google Scholar]
- 38.Choi KM, Lee YS, Sin DM, Lee S, Lee MK, Lee YM, et al. Sulforaphane inhibits mitotic clonal expansion during adipogenesis through cell cycle arrest. Obesity (Silver Spring) 2012;20:1365–1371. doi: 10.1038/oby.2011.388. [DOI] [PubMed] [Google Scholar]
- 39.Pyla R, Pichavaram P, Fairaq A, Park MA, Kozak M, Kamath V, et al. Altered energy state reversibly controls smooth muscle contractile function in human saphenous vein during acute hypoxia-reoxygenation: Role of glycogen, AMP-activated protein kinase, and insulin-independent glucose uptake. Biochem Pharmacol. 2015;97:77–88. doi: 10.1016/j.bcp.2015.06.036. [DOI] [PMC free article] [PubMed] [Google Scholar]
- 40.Choi K-M, Lee Y-S, Kim W, Kim SJ, Shin K-O, Yu J-Y, et al. Sulforaphane attenuates obesity by inhibiting adipogenesis and activating the AMPK pathway in obese mice. The Journal of nutritional biochemistry. 2014;25:201–207. doi: 10.1016/j.jnutbio.2013.10.007. [DOI] [PubMed] [Google Scholar]
- 41.Bachmanov AA, Reed DR, Tordoff MG, Price RA, Beauchamp GK. Nutrient preference and diet-induced adiposity in C57BL/6ByJ and 129P3/J mice. Physiology & behavior. 2001;72:603–613. doi: 10.1016/s0031-9384(01)00412-7. [DOI] [PMC free article] [PubMed] [Google Scholar]
- 42.Collino M, Benetti E, Rogazzo M, Chiazza F, Mastrocola R, Nigro D, et al. A non-erythropoietic peptide derivative of erythropoietin decreases susceptibility to diet-induced insulin resistance in mice. British journal of pharmacology. 2014;171:5802–5815. doi: 10.1111/bph.12888. [DOI] [PMC free article] [PubMed] [Google Scholar] [Retracted]
- 43.Roberts CK, Berger JJ, Barnard RJ. Long-term effects of diet on leptin, energy intake, and activity in a model of diet-induced obesity. Journal of applied physiology. 2002;93:887–893. doi: 10.1152/japplphysiol.00224.2002. [DOI] [PubMed] [Google Scholar]
- 44.Shapiro A, Tumer N, Gao Y, Cheng KY, Scarpace PJ. Prevention and reversal of diet-induced leptin resistance with a sugar-free diet despite high fat content. Br J Nutr. 2011;106:390–397. doi: 10.1017/S000711451100033X. [DOI] [PubMed] [Google Scholar]
- 45.Seufert J. Leptin effects on pancreatic beta-cell gene expression and function. Diabetes. 2004;53(Suppl 1):S152–S158. doi: 10.2337/diabetes.53.2007.s152. [DOI] [PubMed] [Google Scholar]
- 46.Seufert J, Kieffer TJ, Leech CA, Holz GG, Moritz W, Ricordi C, et al. Leptin suppression of insulin secretion and gene expression in human pancreatic islets: implications for the development of adipogenic diabetes mellitus. J Clin Endocrinol Metab. 1999;84:670–676. doi: 10.1210/jcem.84.2.5460. [DOI] [PMC free article] [PubMed] [Google Scholar]
- 47.Bourgoin F, Bachelard H, Badeau M, Melancon S, Pitre M, Lariviere R, et al. Endothelial and vascular dysfunctions and insulin resistance in rats fed a high-fat, high-sucrose diet. Am J Physiol Heart Circ Physiol. 2008;295:H1044–H1055. doi: 10.1152/ajpheart.00516.2008. [DOI] [PubMed] [Google Scholar]
- 48.Li L, Mamputu JC, Wiernsperger N, Renier G. Signaling pathways involved in human vascular smooth muscle cell proliferation and matrix metalloproteinase-2 expression induced by leptin: inhibitory effect of metformin. Diabetes. 2005;54:2227–2234. doi: 10.2337/diabetes.54.7.2227. [DOI] [PubMed] [Google Scholar]
- 49.Heldin CH, Westermark B. Mechanism of action and in vivo role of platelet-derived growth factor. Physiol Rev. 1999;79:1283–1316. doi: 10.1152/physrev.1999.79.4.1283. [DOI] [PubMed] [Google Scholar]
- 50.Hotamisligil GS, Shargill NS, Spiegelman BM. Adipose expression of tumor necrosis factor-alpha: direct role in obesity-linked insulin resistance. Science. 1993;259:87–91. doi: 10.1126/science.7678183. [DOI] [PubMed] [Google Scholar]
- 51.Berg AH, Scherer PE. Adipose tissue, inflammation, and cardiovascular disease. Circ Res. 2005;96:939–949. doi: 10.1161/01.RES.0000163635.62927.34. [DOI] [PubMed] [Google Scholar]
- 52.Young W, Mahboubi K, Haider A, Li I, Ferreri NR. Cyclooxygenase-2 is required for tumor necrosis factor-alpha- and angiotensin II-mediated proliferation of vascular smooth muscle cells. Circ Res. 2000;86:906–914. doi: 10.1161/01.res.86.8.906. [DOI] [PubMed] [Google Scholar]
- 53.Wang Z, Rao PJ, Castresana MR, Newman WH. TNF-alpha induces proliferation or apoptosis in human saphenous vein smooth muscle cells depending on phenotype. Am J Physiol Heart Circ Physiol. 2005;288:H293–H301. doi: 10.1152/ajpheart.00165.2004. [DOI] [PubMed] [Google Scholar]
- 54.Bodary PF, Shen Y, Ohman M, Bahrou KL, Vargas FB, Cudney SS, et al. Leptin regulates neointima formation after arterial injury through mechanisms independent of blood pressure and the leptin receptor/STAT3 signaling pathways involved in energy balance. Arterioscler Thromb Vasc Biol. 2007;27:70–76. doi: 10.1161/01.ATV.0000252068.89775.ee. [DOI] [PubMed] [Google Scholar]
- 55.Schroeter MR, Leifheit-Nestler M, Hubert A, Schumann B, Gluckermann R, Eschholz N, et al. Leptin promotes neointima formation and smooth muscle cell proliferation via NADPH oxidase activation and signalling in caveolin-rich microdomains. Cardiovasc Res. 2013;99:555–565. doi: 10.1093/cvr/cvt126. [DOI] [PubMed] [Google Scholar]
- 56.Chen XL, Dodd G, Kunsch C. Sulforaphane inhibits TNF-alpha-induced activation of p38 MAP kinase and VCAM-1 and MCP-1 expression in endothelial cells. Inflammation research : official journal of the European Histamine Research Society [et al] 2009;58:513–521. doi: 10.1007/s00011-009-0017-7. [DOI] [PubMed] [Google Scholar]
- 57.Nallasamy P, Si H, Babu PV, Pan D, Fu Y, Brooke EA, et al. Sulforaphane reduces vascular inflammation in mice and prevents TNF-alpha-induced monocyte adhesion to primary endothelial cells through interfering with the NF-kappaB pathway. J Nutr Biochem. 2014;25:824–833. doi: 10.1016/j.jnutbio.2014.03.011. [DOI] [PMC free article] [PubMed] [Google Scholar]
- 58.Martin SS, Qasim A, Reilly MP. Leptin resistance: a possible interface of inflammation and metabolism in obesity-related cardiovascular disease. J Am Coll Cardiol. 2008;52:1201–1210. doi: 10.1016/j.jacc.2008.05.060. [DOI] [PMC free article] [PubMed] [Google Scholar]
- 59.Covey SD, Wideman RD, McDonald C, Unniappan S, Huynh F, Asadi A, et al. The pancreatic beta cell is a key site for mediating the effects of leptin on glucose homeostasis. Cell Metab. 2006;4:291–302. doi: 10.1016/j.cmet.2006.09.005. [DOI] [PubMed] [Google Scholar]
- 60.Koch C, Augustine RA, Steger J, Ganjam GK, Benzler J, Pracht C, et al. Leptin rapidly improves glucose homeostasis in obese mice by increasing hypothalamic insulin sensitivity. J Neurosci. 2010;30:16180–16187. doi: 10.1523/JNEUROSCI.3202-10.2010. [DOI] [PMC free article] [PubMed] [Google Scholar]
- 61.Havel PJ, Kasim-Karakas S, Mueller W, Johnson PR, Gingerich RL, Stern JS. Relationship of plasma leptin to plasma insulin and adiposity in normal weight and overweight women: effects of dietary fat content and sustained weight loss. J Clin Endocrinol Metab. 1996;81:4406–4413. doi: 10.1210/jcem.81.12.8954050. [DOI] [PubMed] [Google Scholar]
- 62.Ahren B, Larsson H, Wilhelmsson C, Nasman B, Olsson T. Regulation of circulating leptin in humans. Endocrine. 1997;7:1–8. doi: 10.1007/BF02778056. [DOI] [PubMed] [Google Scholar]
- 63.Segal KR, Landt M, Klein S. Relationship between insulin sensitivity and plasma leptin concentration in lean and obese men. Diabetes. 1996;45:988–991. doi: 10.2337/diab.45.7.988. [DOI] [PubMed] [Google Scholar]
- 64.Shin S, Wakabayashi J, Yates MS, Wakabayashi N, Dolan PM, Aja S, et al. Role of Nrf2 in prevention of high-fat diet-induced obesity by synthetic triterpenoid CDDO-imidazolide. Eur J Pharmacol. 2009;620:138–144. doi: 10.1016/j.ejphar.2009.08.022. [DOI] [PMC free article] [PubMed] [Google Scholar]
- 65.Yu Z, Shao W, Chiang Y, Foltz W, Zhang Z, Ling W, et al. Oltipraz upregulates the nuclear factor (erythroid-derived 2)-like 2 [corrected](NRF2) antioxidant system and prevents insulin resistance and obesity induced by a high-fat diet in C57BL/6J mice. Diabetologia. 2011;54:922–934. doi: 10.1007/s00125-010-2001-8. [DOI] [PubMed] [Google Scholar]
- 66.Vomhof-Dekrey EE, Picklo MJ., Sr The Nrf2-antioxidant response element pathway: a target for regulating energy metabolism. J Nutr Biochem. 2012;23:1201–1206. doi: 10.1016/j.jnutbio.2012.03.005. [DOI] [PubMed] [Google Scholar]
- 67.Chen W, Wilson JL, Khaksari M, Cowley MA, Enriori PJ. Abdominal fat analyzed by DEXA scan reflects visceral body fat and improves the phenotype description and the assessment of metabolic risk in mice. Am J Physiol Endocrinol Metab. 2012;303:E635–E643. doi: 10.1152/ajpendo.00078.2012. [DOI] [PMC free article] [PubMed] [Google Scholar]
- 68.Hasty AH, Shimano H, Osuga J, Namatame I, Takahashi A, Yahagi N, et al. Severe hypercholesterolemia, hypertriglyceridemia, and atherosclerosis in mice lacking both leptin and the low density lipoprotein receptor. J Biol Chem. 2001;276:37402–37408. doi: 10.1074/jbc.M010176200. [DOI] [PubMed] [Google Scholar]
- 69.Jun JY, Ma Z, Pyla R, Segar L. Leptin treatment inhibits the progression of atherosclerosis by attenuating hypercholesterolemia in type 1 diabetic Ins2(+/Akita):apoE(−/−) mice. Atherosclerosis. 2012;225:341–347. doi: 10.1016/j.atherosclerosis.2012.10.031. [DOI] [PMC free article] [PubMed] [Google Scholar]
- 70.Zeadin M, Butcher M, Werstuck G, Khan M, Yee CK, Shaughnessy SG. Effect of leptin on vascular calcification in apolipoprotein E-deficient mice. Arterioscler Thromb Vasc Biol. 2009;29:2069–2075. doi: 10.1161/ATVBAHA.109.195255. [DOI] [PubMed] [Google Scholar]
- 71.Wolk R, Berger P, Lennon RJ, Brilakis ES, Johnson BD, Somers VK. Plasma leptin and prognosis in patients with established coronary atherosclerosis. J Am Coll Cardiol. 2004;44:1819–1824. doi: 10.1016/j.jacc.2004.07.050. [DOI] [PubMed] [Google Scholar]
Associated Data
This section collects any data citations, data availability statements, or supplementary materials included in this article.


