

Abstract
Context
Families of intensive care unit (ICU) patients are at risk for depression, and are important targets for depression-reducing interventions. Multi-item scores for evaluating such interventions should meet criteria for unidimensionality and longitudinal measurement invariance. The Patient Health Questionnaire (PHQ), widely used for measuring depression severity, provides standard nine-, eight-, and two-item scores. However, published studies often report no (or weak) evidence of these scores' unidimensionality/invariance, and no tests have evaluated them as measures of depression severity in ICU patients' families.
Objectives
To identify multi-item PHQ constructs with promise for evaluating change in depression severity among family members of critically ill patients.
Methods
Structural equation models with rigorous fit criterion (χ2 P≥0.05) tested the standard nine-, eight-, and two-item PHQ, and other item subsets, for unidimensionality and longitudinal invariance, using data from a trial evaluating an intervention to reduce depressive symptoms in family members.
Results
Neither the standard nine-item nor eight-item PHQ construct showed longitudinal invariance, although the standard two-item construct and other item subsets did.
Conclusion
The longer eight- and nine-item PHQ scores appear inappropriate for assessing depression severity in this population, with constructs based on smaller subsets of items being more promising targets for future trials. The CONSORT (Consolidated Standards of Reporting Trials) requirement for pre-specified trial outcomes is problematic because unidimensionality/invariance testing must occur after trial completion. CONSORT could be strengthened by endorsing rigorous assessment of composite scores and encouraging use of the most appropriate substitute, should trial-based evidence challenge the legitimacy of pre-specified multi-item scores.
Keywords: Patient Health Questionnaire (PHQ), unidimensionality, longitudinal measurement invariance, depression severity, ICU patients' families, CONSORT
Introduction
Current guidelines for palliative care in intensive care units (ICU) urge family-centered approaches (1, 2). ICU patients' families face increased risk for depressive symptoms (3-6), and several studies have employed composite scores to measure families' depression-severity (7-13). Measurement experts contend that to be legitimate, such scores must be unidimensional (14-16) and show measurement invariance for groups or times being compared (17-20). That is, the component items must measure a single underlying construct consistently. To date, no such evidence has been provided for widely used measures of depression severity in ICU patients' families.
Although insufficiently tested scores are reported for both observational studies and trial evaluations, their use in trials may be partly attributable to the Consolidated Standards of Reporting Trials (CONSORT) guidelines, which require that outcomes be specified before the trial (21). Later modification is allowed if the researcher can supply adequate reason, but the standard provides no guidance regarding acceptable reasons. Nor does CONSORT require testing of composite scores for sample-specific appropriateness, with replacement using the best available substitute when testing fails. These CONSORT guidelines (and omissions) may result in trials reporting results based on inadequately tested outcome measures.
Although sample-specific testing is needed, evidence from one sample can indicate whether a score is likely to be unidimensional/invariant in similar future samples. This potential for informing future selection of depression severity outcomes motivated the current article. We looked specifically at the Patient Health Questionnaire (PHQ), an instrument developed as a clinical tool to screen primary care patients for major depressive disorder (MDD), with subsequent clinical evaluation required for actual diagnosis. Increasingly used in research evaluating the severity of depressive symptoms (22), it covers the nine diagnostic criteria for MDD from the Diagnostic and Statistical Manual of Mental Disorders (DSM)-IV and DSM-5 (23, 24). Three sum-scores have been developed: PHQ-9, covering all nine criteria; the PHQ-8, which omits a suicidal ideation item; and PHQ-2, which includes only items assessing anhedonia and depressed mood (22). All three have shown responsiveness in monitoring depression-related outcomes (22, 25).
Numerous articles assessing dimensionality/invariance of the PHQ have based their conclusions on exploratory factor analysis, a method that often produces models with poor fit to observed data (26). Other studies, based on more rigorous confirmatory factor analysis (CFA) techniques, have evaluated model fit with approximate-fit indices, a practice methodologists have deemed problematic (27-29). In addition to urging the use of stronger criteria for assessing the dimensionality/invariance of constructs, methodologists note the need to consider whether all item-combinations function equivalently for all purposes. For example, a particular intervention might be expected to influence a narrower definition of depression, measured by fewer items. A recent article recommended that researchers use only a few indicators for each construct, selecting one to three that best represent the latent variable relevant to a given investigation (30).
During a randomized trial of an intervention to reduce depressive symptoms in family members of ICU patients, we administered the nine-item PHQ three times: at study enrollment and three and six months later. The current report sought to answer three questions: 1) Did any of the standard PHQ composite scores meet criteria for unidimensionality and longitudinal measurement invariance in this sample? 2) Did other item subsets, defining slightly different depression severity constructs, meet these criteria? and 3) Did patient/family characteristics contribute to family members' depression severity?
Methods
Study Sample and Setting
We used data from a randomized trial testing an intervention to improve communication between clinicians and ICU patients' families (31, 32). Patients being treated in ICUs in two Seattle-area hospitals were eligible for inclusion if they were mechanically ventilated, with estimated hospital mortality ≥30% based on mortality prediction scales (33) and diagnoses (31). Family members of eligible patients received baseline and three- and six-month follow-up questionnaires. The pre-specified test of trial efficacy was an association of the intervention with change between baseline and the two follow-up periods in family members' depression severity, as assessed by the PHQ-9.
Measures
Each time-specific PHQ included nine items measuring the frequency of depressive symptoms in the previous two weeks (0=not at all, 1=several days, 2=more than half the days, 3=nearly every day). Questionnaires also documented respondent gender, age, race/ethnicity, education, and length/type of relationship with the patient. Medical records provided information about patient gender, age, race/ethnicity, hospital length-of-stay, and mortality status at hospital discharge. Study records provided the patient's randomization condition.
Statistical Analysis
We used CFA (34-38) to evaluate unidimensionality of the standard PHQ-9 and PHQ-8 items and all combinations of 4-7 items at baseline. Combinations of 2-3 indicators were not separately testable for unidimensionality, but were retained, along with the unidimensional baseline combinations, for later testing.
Structural equation models (SEM) subsequently tested each retained item-combination for longitudinal measurement invariance. For latent constructs to be comparable over time, they should be measured by the same set of indicators at all time points, with each indicator carrying the same weight over time, thus providing time-invariant meaning to the construct. With ordinal items, invariant models have item loadings and category thresholds constrained to equality across time (39). We constructed each model with three underlying factors, representing depression severity at the three time points, measured by identical combinations of time-specific indicators with the required equality constraints. Our determination of longitudinal invariance required that a model, thus constrained, demonstrate adequate fit to the data. Each model also included structural effects leading from baseline depression severity to 3-month severity, and from three-month severity to six-month severity. An additional direct link from baseline severity to six-month severity was never statistically significant and is omitted from models presented in the results.
We evaluated additional evidence of departures from unidimensionality/invariance via Rasch analyses, based on Rasch-Masters Partial Credit models (40). This involved identifying items with disordered category thresholds (the latent construct's average value at an indicator threshold being greater than its average at the next higher threshold), as well as items that exhibited time-related differential item functioning (DIF).
We tested patient/family contributors to depression severity (measured with two items constituting the standard PHQ-2) with path models that included exogenous predictors of depression severity at the three time points. We hypothesized that any of the following might contribute to baseline depression severity: patient gender, age, race; respondent gender, age, race, education, length and type of relationship to patient. We further hypothesized that any of these variables, plus the patient's hospital length-of-stay, mortality status at hospital discharge, and randomization condition, might have independent effects on depression severity at follow-up. We began with a model that included all potential predictors of baseline depression severity, removing non-significant predictors in a reverse stepwise procedure until only predictors with P≤0.20 remained. We then added all potential predictors of three-month severity, and then of six-month severity, following the same procedure for removal of predictors with the highest P-values. Finally, using a stepwise procedure, we removed all remaining predictors having P≥0.05.
We based all CFA/SEM analyses on complex single-group models, with family members clustered under patients, using a sample having complete data on all variables in the model. We defined PHQ items as ordered categorical variables and used robust least squares (WLSMV) estimation. We evaluated model fit with the χ2 test of fit, rejecting all models with P<0.05. Although significant χ2 values are possible with only trivial misfit when samples are large, our sample was small enough to be relatively immune to this problem. We report unstandardized coefficients, with estimates for the indicator-loadings representing probit regression coefficients (41). We used SPSS 19.0.0 (42) for data management, Mplus 7.3 (43) for SEM analysis, and Winsteps 3.81.0 (44) for Rasch analysis.
Results
Sample Characteristics
We enrolled 232 family members of 149 critically ill patients, with 193 family members (131 patients) providing sufficient data to be included in one or more analyses for the current study. Patient and family characteristics are shown in Table 1. Family members' responses to the questions about depressive symptoms (Table 2) indicated relatively low symptom frequency at all assessments (Table 3).
Table 1. Family and Patient Characteristics.
| Valid n | Statistic | |
|---|---|---|
| Patient Characteristics | ||
| Female, n (%) | 131 | 50 (38.2) |
| Racial/ethnic minority, n (%) | 117 | 20 (17.1) |
| Age at ICU admit, mean (SD) | 131 | 55.0 (18.2) |
| Days in hospital, mean (SD) | 118 | 27.8 (18.7) |
| Died in hospital, n (%) | 131 | 37 (28.2) |
| Family Characteristics | ||
| Female, n (%) | 193 | 131 (67.9) |
| Racial/ethnic minority, n (%) | 117 | 20 (17.1) |
| Education level, median (IQR)a | 193 | 4 (1) |
| Relationship to patient, n (%) | 193 | |
| Spouse | 59 (30.6) | |
| Child of patient | 52 (26.9) | |
| Parent of patient | 34 (17.6) | |
| Other | 48 (24.9) | |
| Age, mean (SD) | 190 | 51.1 (13.0) |
| Years of acquaintance, mean (SD) | 191 | 33.0 (15.8) |
1=8th grade or less; 2=some high school; 3=high school graduate or equivalent; 4=trade school or some college; 5=undergraduate degree; 6=post-college education
Table 2. Wording of PHQ-9 Items.
Over the last two weeks, how often have you been bothered by any of the following problems? (Please check one box for each item.)
| Not at all | Several days | More than half the days | Nearly everyday | |
|---|---|---|---|---|
| 1. Little interest or pleasure in doing things | □ | □ | □ | □ |
| 2. Feeling down, depressed or hopeless | □ | □ | □ | □ |
| 3. Trouble falling, staying asleep, or sleeping too mucha | □ | □ | □ | □ |
| 4. Feeling tired or having little energy | □ | □ | □ | □ |
| 5. Poor appetite or overeatinga | □ | □ | □ | □ |
| 6. Feeling bad about yourself – or that you are a failure or have let yourself or your family down | □ | □ | □ | □ |
| 7. Trouble concentrating on things, such as reading the newspaper or watching television | □ | □ | □ | □ |
| 8. Moving or speaking so slowly that other people could have noticed, or the opposite - being so fidgety or restless that you have been moving around a lot more than usuala | □ | □ | □ | □ |
| 9. Thoughts that you would be better off dead or hurting yourself in some way | □ | □ | □ | □ |
This bidirectional item has been noted as problematic because it measures the frequency with which two diametrically opposed symptoms has occurred, thus rendering it definitionally ambiguous.
Table 3. Responses to the PHQ-9 Itemsa.
| Baseline | 3-Month | 6-Month | ||||
|---|---|---|---|---|---|---|
| Item | Valid | n (%) | Valid | n (%) | Valid | n (%) |
| 1. Anhedonia | 191 | 127 | 127 | |||
| not at all | 106 (55.5) | 81 (63.8) | 87 (68.5) | |||
| several days | 42 (22.0) | 37 (29.1) | 30 (23.6) | |||
| more than half the days | 22 (11.5 | 4 (3.1) | 9 (7.1) | |||
| nearly every day | 21 (11.0) | 5 (3.9) | 1 (0.8) | |||
| 2. Depressed mood | 190 | 126 | 126 | |||
| not at all | 92 (48.4) | 75 (59.5) | 84 (66.7) | |||
| several days | 71 (37.4) | 39 (31.0) | 31 (24.6) | |||
| more than half the days | 17 (8.9) | 6 (4.8) | 7 (5.6) | |||
| nearly every day | 10 (5.3) | 6 (4.8) | 8 (3.2) | |||
| 3. Sleep disturbance | 193 | 128 | 128 | |||
| not at all | 68 (35.2) | 62 (48.4) | 58 (45.3) | |||
| several days | 69 (35.8) | 44 (34.4) | 46 (35.9) | |||
| more than half the days | 28 (14.5) | 11 (8.6) | 14 (10.9) | |||
| nearly every day | 28 (14.5) | 11 (8.6) | 10 (7.8) | |||
| 4. Low energy | 193 | 128 | 128 | |||
| not at all | 57 (29.5) | 52 (40.6) | 47 (36.7) | |||
| several days | 82 (42.5) | 42 (32.8) | 55 (43.0) | |||
| more than half the days | 30 (15.5) | 20 (15.6) | 17 (13.3) | |||
| nearly every day | 24 (12.4) | 14 (10.9) | 9 (7.0) | |||
| 5. Eating disturbance | 191 | 126 | 126 | |||
| not at all | 89 (46.6) | 75 (59.5) | 75 (59.5) | |||
| several days | 55 (28.8) | 28 (22.2) | 32 (25.4) | |||
| more than half the days | 27 (14.1) | 18 (14.3) | 13 (10.3) | |||
| nearly every day | 20 (10.5) | 5 (4.0) | 6 (4.8) | |||
| 6. Low self-worth | 191 | 128 | 128 | |||
| not at all | 140 (73.3) | 81 (63.3) | 82 (64.1) | |||
| several days | 36 (18.8) | 37 (28.9) | 35 (27.3) | |||
| more than half the days | 7 (3.7) | 6 (4.7) | 7 (5.5) | |||
| nearly every day | 8 (4.2) | 4 (3.1) | 4 (3.1) | |||
| 7. Trouble concentrating | 187 | 126 | 126 | |||
| not at all | 88 (47.1) | 81 (64.3) | 87 (69.0) | |||
| several days | 58 (31.0) | 28 (22.2) | 30 (23.8) | |||
| more than half the days | 20 (10.7) | 11 (8.7) | 8 (6.3) | |||
| nearly every day | 21 (11.2) | 6 (4.8) | 1 (0.8) | |||
| 8. Psychomotor disturbance | 186 | 125 | 125 | |||
| not at all | 140 (75.3) | 102 (81.6) | 107 (85.6) | |||
| several days | 27 (14.5) | 16 (12.8) | 13 (10.4) | |||
| more than half the days | 11 (5.9) | 4 (3.2) | 5 (4.0) | |||
| nearly every day | 8 (4.3) | 3 (2.4) | 0 (0.0) | |||
| 9. Suicidal ideation | 185 | 123 | 123 | |||
| not at all | 183 (98.9) | 113 (91.9) | 113 (91.9) | |||
| several days | 2 (1.1) | 8 (6.5) | 8 (6.5) | |||
| more than half the days | 0 (0.0) | 1 (0.8) | 2 (1.6) | |||
| nearly every day | 0 (0.0) | 1 (0.8) | 0 (0.0) | |||
Respondents are included for each item and time point for which they provided data used in at least one of the analyses for the current study.
Tests for Unidimensionality at Baseline
Test of the PHQ-9 baseline model showed significant misfit (χ2 P=0.001). Three items were problematic: item #9 (suicidal ideation), an empirical dichotomy in this dataset (99% of all respondents indicating no problem, and all remaining respondents indicating “several days”); and #6 (low self-worth) and #7 (trouble concentrating), both of which had the top two category thresholds disordered, per Rasch analysis. The PHQ-8, omitting the suicide item, showed only a modest improvement in fit at baseline (χ2 P=0.005).
Of 162 baseline models containing 4-7 items (and excluding suicide item #9), 83 passed the baseline unidimensionality test, with 67 of these including the anhedonia and/or depressed mood indicator. We considered models that included neither anhedonia nor depressed mood to be suspect as models of depression severity, as the remaining symptom combinations could reflect conditions other than depression.
Tests for Longitudinal Invariance
Longitudinal measurement invariance tests involved 167 models: 83 models that passed the baseline unidimensionality test and 84 models based on 2-3 indicators. Of the 167 models, 42 (including the standard PHQ-2) resulted in χ2 P≥0.05, with 34 containing the anhedonia and/or depressed mood indicator (test results in Table 4; syntax used to test PHQ-2 in Table 5, available at jpsmjournal.com). Although the 34 models were acceptable on both empirical and theoretical grounds, most included at least one item (#3, #5, or #8) with ambiguous meaning (Table 2), rendering the construct similarly ambiguous. Most of the models based on three or more indicators included the psychomotor disturbance indicator (# 8), which Rasch analysis suggested was the most serious of the symptoms.
Table 4. Tests for Longitudinal Invariance, PHQ Item Subsetsa.
| Model Description | Family n | Patient n | P for χ2 test of fit |
|---|---|---|---|
| PHQ-2: | |||
| Items #1, 2 | 125 | 88 | 0.342 |
| Other 2-indicator models: | |||
| Items #2, 4 | 124 | 87 | 0.392 |
| Items #2, 3 | 124 | 87 | 0.321 |
| Items #2, 7 | 124 | 87 | 0.296 |
| Items #1, 5 | 124 | 89 | 0.078 |
| Items #2, 5 | 123 | 87 | 0.078 |
| Items #1, 3 | 125 | 89 | 0.059 |
| 3-indicator models: | |||
| Items #2, 7, 8 | 124 | 87 | 0.255 |
| Items #2, 3, 8 | 122 | 86 | 0.245 |
| Items #2, 3, 5 | 122 | 87 | 0.242 |
| Items #2, 4, 8 | 122 | 86 | 0.235 |
| Items #1, 2, 8 | 123 | 87 | 0.170 |
| Items #1, 5, 8 | 121 | 87 | 0.169 |
| Items #2, 5, 8 | 121 | 86 | 0.158 |
| Items #2, 3, 4 | 122 | 86 | 0.125 |
| Items #1, 4, 8 | 122 | 87 | 0.122 |
| Items #1, 3, 8 | 122 | 87 | 0.119 |
| Items #1, 2, 4 | 123 | 87 | 0.110 |
| Items #2, 4, 7 | 122 | 86 | 0.096 |
| Items #1, 7, 8 | 124 | 88 | 0.092 |
| Items #1, 3, 5 | 123 | 89 | 0.064 |
| 4-indicator models: | |||
| Items #1, 2, 4, 8 | 121 | 86 | 0.151 |
| Items #1, 4, 5, 8 | 120 | 86 | 0.147 |
| Items #1, 2, 5, 8 | 120 | 86 | 0.146 |
| Items #2, 4, 7, 8 | 122 | 86 | 0.139 |
| Items #1, 3, 5, 8 | 120 | 87 | 0.138 |
| Items #2, 4, 5, 8 | 120 | 85 | 0.117 |
| Items #2, 3, 7, 8 | 122 | 86 | 0.112 |
| Items #1, 5, 7, 8 | 121 | 87 | 0.077 |
| Items #2, 3, 4, 5 | 121 | 86 | 0.054 |
| Items #1, 3, 4, 8 | 120 | 86 | 0.050 |
| 5-indicator models: | |||
| Items #1, 2, 4, 5, 8 | 119 | 85 | 0.117 |
| Items #2, 3, 5, 7, 8 | 120 | 86 | 0.071 |
| Items #1, 3, 4, 5, 8 | 119 | 86 | 0.063 |
Table shows all item combinations that were theoretically tenable as models of depression (because they included the anhedonia and/or depressed mood indicator) and for which the test for longitudinal invariance produced χ2 probability >0.05 and “proper” estimates (i.e., positive definite theta and psi matrices); three models were excluded solely because they produced improper estimates. The following models had χ2 probability >0.05 and proper estimates, but did not include anhedonia or depressed mood, and were, therefore, excluded from the table: items 3-4, 3-5, 3-8; 3-4-8, 3-5-8, 4-5-8, 5-7-8; 3-4-5-8; three additional models that excluded anhedonia or depressed mood were excluded because they also produced improper estimates.
Table 5. Mplus Syntax Example for Testing Longitudinal Scalar Invariance: Model Including Indicators #1 (Anhedonia) and #2 (Depressed Mood).
| TITLE: Test for longitudinal invariance PHQ items 1 & 2; |
| DATA: File = FileName.dat; |
| VARIABLE: |
| NAMES = PIDint FIDint basePHQ1-basePHQ9 mo3PHQ1-mo3PHQ9 mo6PHQ1-mo6PHQ9 |
| ffem fage feduc frace spouse child parent yrsknwn page pfem prace |
| hospdth hospdays random; |
| cluster = PIDint; !family respondents clustered under patients; |
| categorical = basePHQ1 basePHQ2 mo3PHQ1 mo3PHQ2 mo6PHQ1 mo6PHQ2; |
| USEVARIABLES = basePHQ1 basePHQ2 mo3PHQ1 mo3PHQ2 mo6PHQ1 mo6PHQ2; |
| SUBPOPULATION = !cases with complete data only |
| (basePHQ1 ne 999 and basePHQ2 ne 999 and |
| mo3PHQ1 ne 999 and mo3PHQ2 ne 999 and |
| mo6PHQ1 ne 999 and mo6PHQ2 ne 999); |
| MISSING = basePHQ1-HospDays(999); |
| ANALYSIS: type=complex; |
| MODEL: |
| !SET METRIC by fixing a loading 1, |
| !CONSTRAIN LOADINGS to equality over time; |
| depress1 by basePHQ1 |
| basePHQ2 (1); |
| depress3 by mo3PHQ1 |
| mo3PHQ2 (1); |
| depress6 by mo6PHQ1 |
| mo6PHQ2 (1); |
| depress1 depress3 depress6; !factor variances free over time |
| [depress1@0 depress3 depress6] !factor mean=0 at baseline; free at follow up; |
| !CONSTRAIN INDICATOR THRESHOLDS to equality over time; |
| [basePHQ1$1 mo3PHQ1$1 mo6PHQ1$1] (2); |
| [basePHQ2$1 mo3PHQ2$1 mo6PHQ2$1] (3); |
| [basePHQ1$2 mo3PHQ1$2 mo6PHQ1$2] (4); |
| [basePHQ2$2 mo3PHQ2$2 mo6PHQ2$2] (5); |
| [basePHQ1$3 mo3PHQ1$3 mo6PHQ1$3] (6); |
| [basePHQ2$3 mo3PHQ2$3 mo6PHQ2$3] (7); |
| !CONSTRAIN baseline delta scale factor to 1; estimate other times |
| {basePHQ1-basePHQ2@1 mo3PHQ1-mo3PHQ2 mo6PHQ1-mo6PHQ2}; |
| !INCLUDE STRUCTURAL PATHS |
| depress3 on depress1; |
| depress6 on depress3; |
Eight additional models met the χ2 criterion but did not include either anhedonia or depressed mood. They included various combinations of sleep, energy, eating, and psychomotor disturbances that could be attributable to physical illness, anxiety, or other conditions unrelated to depression.
Primary Contributors to Longitudinal Variance
None of the models that met the criterion for longitudinal measurement invariance included item #6 (low self-worth). Evaluation of models containing this item showed that it exhibited DIF: low self-worth being reported at baseline primarily by respondents with high values on the depression severity construct, but at follow-up points by respondents with lower values (i.e., low self-worth was more symptomatic of the construct at baseline than at follow-up, when it frequently reflected other underlying issues). When this item was included as a depressive symptom, slightly different “varieties” of the construct were measured at baseline than at follow-up. Item #7 (trouble concentrating) also exhibited DIF, concentration problems being frequently reported at baseline by respondents with relatively low depression severity, but at follow-up primarily by respondents with high severity levels. Concentration problems, thus, were more indicative of the construct at follow-up than at baseline.
Of 31 models that showed significant departure from longitudinal measurement invariance, and that excluded items #6-#7, none provided evidence of DIF. However, 24 produced evidence suggesting that the indicators did not reflect any unidimensional construct at all three time points, much less the same construct at all time points.
Predictors of Depression Severity Over Time
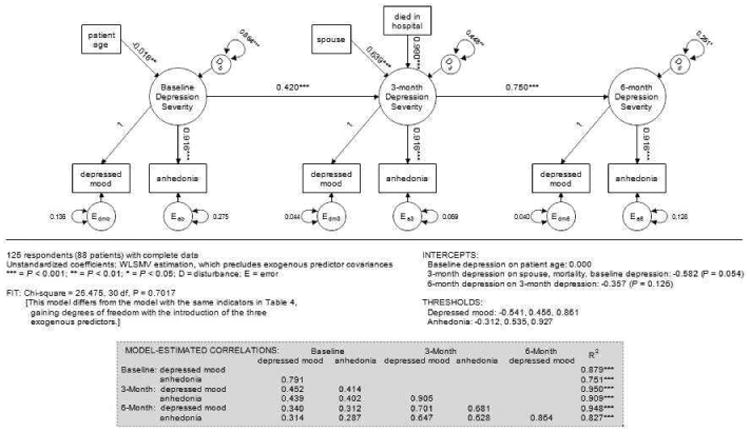
We investigated the association of patient/family characteristics with the depression severity construct measured with the standard PHQ-2. Of known characteristics, only patient age predicted depression severity at baseline – family members of older patients reporting less severe symptoms (Fig. 1). Although female respondents endorsed more depressive symptoms than male respondents, the association was just short of statistical significance (P = 0.053). Baseline depression severity was a significant predictor of three-month severity. In addition, there were significant independent effects of the respondent's relationship to the patient (higher severity when the family member was the patient's spouse/partner) and the patient's mortality status at hospital discharge (higher severity when the patient had died). Depression severity at three months carried over significantly into the six-month period, but there were no other significant predictors of six-month severity, nor was there a significant direct effect of baseline severity on six-month severity. Significant unexplained variance in depression severity was present at all three time points (labeled “D” in Fig. 1), with the unexplained amount decreasing over time.
Figure 1. PHQ-2 Model with Exogenous Predictors.
Discussion
In both clinical and research settings, the PHQ is commonly used to measure depression severity via standard summated scoring of the items. Our analyses suggest that neither the eight-nor nine-item score appropriately represents depression severity for family members of ICU patients. Neither represented a unidimensional construct at baseline and neither had consistent meaning over time.
We identified numerous subsets of items, including one based on the standard PHQ-2, that showed longitudinal measurement invariance among family respondents. This demonstrates that, at least in our sample, using a strict fit criterion did not prevent identification of empirically appropriate models. There is no guarantee that any of these models would provide acceptable fit to other family-member samples, nor would all of the constructs have equal theoretical appeal for specific studies. Identification of the best indicator-set involves both empirical assessment of fit and consideration of underlying theory. For example, the best latent construct for evaluating an intervention is the construct that most precisely matches the features hypothesized to be amenable to change by the intervention. We believe it is important for researchers to evaluate both model fit and theory in selecting an outcome, rather than automatically employing an “industry standard.”
Our sample exhibited relatively low levels of depressive symptoms, however measured. Several items were particularly problematic. Suicidal ideation was rarely endorsed. Researchers evaluating the PHQ-9 in a population-based sample of older adults in Germany also noted problems with this item, reporting its low reliability and suggesting that suicidality may be only loosely related to depression (45). A group studying psychiatric genetics contended that suicidal behavior is more appropriately regarded as an independent clinical entity than as a symptom of major psychiatric disorders (46). As an indicator of depression severity, low self-worth was stronger at baseline than at follow-up. Difficulty concentrating was stronger at follow-up than at baseline, when fatigue, worry, and uncertainty may reduce the ability to concentrate.
The fact that the models that were longitudinally invariant and theoretically tenable in our sample comprised relatively small sets of items accords well with the call by SEM methodologists for the use of small sets of indicators that most precisely capture the construct of interest (30). All models with P>0.30 contained two indicators.
This study's limitations are small sample size and lack of geographic dispersion. This limits the extent to which the observations can be confidently generalized to other populations of family members in similar circumstances. The study also ignores the issue of whether it is appropriate to use sum-scores, rather than latent variables, as research outcomes.
Although we have abbreviated the construct of interest as “depression severity,” this is not meant to imply a clinical diagnosis, but rather the severity of a constellation of depression-related symptoms. Our objective was not to define a “best measure” for tracking depression severity in ICU patients' families nor to specify the form an ideal measure would take, but rather to provide preliminary evidence of depression severity constructs that might prove useful in similar samples, pending sample-specific tests of appropriateness. We believe our results raise a general question related to using pre-specified composite outcomes in evaluating randomized trials, in the absence of trial-based evidence supporting the composites. CONSORT guidelines (21) permit changing an outcome measure after commencement of a trial if the change is appropriately justified, but provide no guidance regarding what constitutes a justifiable basis. We believe the guidelines could be strengthened if they encouraged assessment of composite scores, and recommended employing the strongest and most appropriate alternative measure, should trial-based evidence challenge a pre-specified multi-item score.
Acknowledgments
The randomized trial providing data for this report was funded by the NIH/NINR (R01-NR05226), which had no role in study design; data collection, analysis, or interpretation; writing of this report; or the decision to submit it for publication.
Footnotes
Disclosures: The authors declare no conflicts of interest.
Publisher's Disclaimer: This is a PDF file of an unedited manuscript that has been accepted for publication. As a service to our customers we are providing this early version of the manuscript. The manuscript will undergo copyediting, typesetting, and review of the resulting proof before it is published in its final citable form. Please note that during the production process errors may be discovered which could affect the content, and all legal disclaimers that apply to the journal pertain.
References
- 1.Davidson JE, Powers K, Hedayat KM, et al. Clinical practice guidelines for support of the family in the patient-centered intensive care unit: American College of Critical Care Medicine Task Force 2004-2005. Crit Care Med. 2007;35:605–622. doi: 10.1097/01.CCM.0000254067.14607.EB. [DOI] [PubMed] [Google Scholar]
- 2.Truog RD, Campbell ML, Curtis JR, et al. Recommendations for end-of-life care in the intensive care unit: A consensus statement by the American College of Critical Care Medicine. Crit Care Med. 2008;36:953–963. doi: 10.1097/CCM.0B013E3181659096. [DOI] [PubMed] [Google Scholar]
- 3.Pochard F, Darmon M, Fassier T, et al. Symptoms of anxiety and depression in family members of intensive care unit patients before discharge or death. A prospective multicenter study. J Crit Care. 2005;20:90–96. doi: 10.1016/j.jcrc.2004.11.004. [DOI] [PubMed] [Google Scholar]
- 4.Siegel MD, Hayes E, Venderwerker LC, Loseth DB, Prigerson HG. Psychiatric illness in the next of kin of patients who die in the intensive care unit. Crit Care Med. 2008;36:1722–1728. doi: 10.1097/CCM.0b013e318174da72. [DOI] [PubMed] [Google Scholar]
- 5.McAdam JL, Dracup KA, White DB, Fontaine DK, Puntillo KA. Symptom experiences of family members of intensive care unit patients at high risk for dying. Crit Care Med. 2010;38:1078–1085. doi: 10.1097/CCM.0b013e3181cf6d94. [DOI] [PubMed] [Google Scholar]
- 6.Schmidt M, Azoulay E. Having a loved one in the ICU: the forgotten family. Curr Opin Crit Care. 2012;18:540–547. doi: 10.1097/MCC.0b013e328357f141. [DOI] [PubMed] [Google Scholar]
- 7.Paparrigopoulos T, Melissaki A, Efthymiou A, et al. Short-term psychological impact on family members of intensive care unit patients. J Psychosom Res. 2006;61:719–722. doi: 10.1016/j.jpsychores.2006.05.013. [DOI] [PubMed] [Google Scholar]
- 8.Gries CJ, Engelberg RA, Kross EK, et al. Predictors of symptoms of posttraumatic stress and depression in family members after patient death in the ICU. Chest. 2010;137:280–287. doi: 10.1378/chest.09-1291. [DOI] [PMC free article] [PubMed] [Google Scholar]
- 9.Kross EK, Engelberg RA, Gries CJ, et al. ICU care associated with symptoms of depression and posttraumatic stress disorder among family members of patients who die in the ICU. Chest. 2011;139:795–801. doi: 10.1378/chest.10-0652. [DOI] [PMC free article] [PubMed] [Google Scholar]
- 10.Fumis RRL, Deheinzelin D. Family members of critically ill cancer patients: assessing the symptoms of anxiety and depression. Intensive Care Med. 2009;35:899–902. doi: 10.1007/s00134-009-1406-7. [DOI] [PubMed] [Google Scholar]
- 11.Jones C, Skirrow P, Griffiths RD, et al. Post-traumatic stress disorder-related symptoms in relatives of patients following intensive care. Intensive Care Med. 2004;30:456–460. doi: 10.1007/s00134-003-2149-5. [DOI] [PubMed] [Google Scholar]
- 12.Douglas SL, Daly BJ, Kelley CG, O'Toole E, Montenegro H. Impact of a disease management program upon caregivers of chronically critically ill patients. Chest. 2005;128:3925–3936. doi: 10.1378/chest.128.6.3925. [DOI] [PubMed] [Google Scholar]
- 13.Lautrette A, Darmon M, Megarbane B, et al. A communication strategy and brochure for relatives of patients dying in the ICU. N Engl J Med. 2007;356:469–478. doi: 10.1056/NEJMoa063446. [DOI] [PubMed] [Google Scholar]
- 14.Hattie J. Methodology review: assessing unidimensionality of tests and items. Appl Psychol Meas. 1985;9:139–164. [Google Scholar]
- 15.Wright BD, Linacre JM. Observations are always ordinal; measurements, however, must be interval. Arch Phys Med Rehabil. 1989;70:857–860. [PubMed] [Google Scholar]
- 16.Silverstein BS, Fisher WP, Kilgore KM, Harley JP, Harvey RF. Applying psychometric criteria to functional assessment in medical rehabilitation: II. Defining interval measures. Arch Phys Med Rehabil. 1992;73:507–518. [PubMed] [Google Scholar]
- 17.Meredith W, Teresi JA. An essay on measurement and factorial invariance. Med Care. 2006;44:S69–S77. doi: 10.1097/01.mlr.0000245438.73837.89. [DOI] [PubMed] [Google Scholar]
- 18.Milfont TL, Fischer R. Testing measurement invariance across groups: applications in cross-cultural research. Int J Psychol Res. 2010;3:111–121. [Google Scholar]
- 19.Byrne BM, van de Vijver FJR. Testing for measurement and structural equivalence in large-scale cross-cultural studies: addressing the issue of nonequivalence. Int J Testing. 2010;10:107–132. [Google Scholar]
- 20.van de Schoot R, Lugtig P, Hox J. Developmetrics: a checklist for testing measurement invariance. Eur J Dev Psychol. 2012;9:486–492. [Google Scholar]
- 21.Consolidated Standards of Reporting Trials. CONSORT transparent reporting of trials: CONSORT 2010. [Accessed February 14, 2015]; Available at: http://www.consort-statement.org/consort-2010.
- 22.Kroenke K, Spitzer RL, Williams JBW, Löwe B. The Patient Health Questionnaire Somatic, Anxiety, and Depressive Symptom Scales: a systematic review. Gen Hosp Psychiatry. 2010;32:345–359. doi: 10.1016/j.genhosppsych.2010.03.006. [DOI] [PubMed] [Google Scholar]
- 23.American Psychiatric Association. Diagnostic and statistical manual of mental disorders: DSM-IV. Washington, DC: American Psychiatric Association; 2000. [Google Scholar]
- 24.American Psychiatric Association. Diagnostic and statistical manual of mental disorders: DSM-5. Washington, DC: American Psychiatric Association; 2013. [Google Scholar]
- 25.Löwe B, Kroenke K, Gräfe K. Detecting and monitoring depression with a two-item questionnaire (PHQ-2) J Psychosom Res. 2005;58:163–171. doi: 10.1016/j.jpsychores.2004.09.006. [DOI] [PubMed] [Google Scholar]
- 26.van Prooijen JW, van der Kloot WA. Confirmatory analysis of exploratively obtained factor structures. Educ Psychol Meas. 2001;61:777–792. [Google Scholar]
- 27.Hayduk LA, Cummings G, Boadu K, Pazderka-Robinson H, Boulianne S. Testing! testing! one, two, three -- testing the theory in structural equation models! Pers Indiv Differ. 2007;42:841–850. [Google Scholar]
- 28.McIntosh CN. Strengthening the assessment of factorial invariance across population subgroups: a commentary on Varni et al. (2013) Qual Life Res. 2013;22:2595–2601. doi: 10.1007/s11136-013-0465-y. [DOI] [PubMed] [Google Scholar]
- 29.Hayduk LA. Shame for disrespecting evidence: the personal consequences of insufficient respect for structural equation model testing. BMC Med Res Methodol. 2014;14:124. doi: 10.1186/1471-2288-14-124. [DOI] [PMC free article] [PubMed] [Google Scholar]
- 30.Hayduk LA, Littvay L. Should researchers use single indicators, best indicators, or multiple indicators in structural equation models? BMC Med Res Methodol. 2012;12:159. doi: 10.1186/1471-2288-12-159. [DOI] [PMC free article] [PubMed] [Google Scholar]
- 31.Curtis JR, Ciechanowski PS, Downey L, et al. Development and evaluation of an interprofessional communication intervention to improve family outcomes in the ICU. Contemp Clin Trials. 2012;33:1245–1254. doi: 10.1016/j.cct.2012.06.010. [DOI] [PMC free article] [PubMed] [Google Scholar]
- 32.Curtis JR, Treece PD, Nielsen EL, et al. Randomized trial of communication facilitators to reduce family distress and intensity of end-of-life care. Am J Respir Crit Care Med. 2015 Sep 17; doi: 10.1164/rccm.201505-0900OC. Epub ahead of print. [DOI] [PMC free article] [PubMed] [Google Scholar]
- 33.Vincent JL, Moreno R, Takala J, et al. The SOFA (Sepsis-related Organ Failure Assessment) score to describe organ dysfunction/failure. On behalf of the Working Group on Sepsis-Related Problems of the European Society of Intensive Care Medicine. Intensive Care Med. 1996;22:707–710. doi: 10.1007/BF01709751. [DOI] [PubMed] [Google Scholar]
- 34.Bollen KA. Structural equations with latent variables. New York: John Wiley & Sons; 1989. [Google Scholar]
- 35.Hayduk LA. Structural equation modeling with LISREL: Essentials and advances. Baltimore, MD: The Johns Hopkins University Press; 1987. [Google Scholar]
- 36.Hayduk LA. LISREL issues, debates, and strategies. Baltimore, MD: The Johns Hopkins University Press; 1996. [Google Scholar]
- 37.Kline RB. Principles and practice of structural equation modeling. 3rd. New York: The Guilford Press; 2011. [Google Scholar]
- 38.Brown TA. Confirmatory factor analysis for applied research. New York: The Guilford Press; 2006. [Google Scholar]
- 39.Muthén B, Asparouhov T. Latent variable analysis with categorical outcomes: multiple-group and growth modeling in Mplus. Mplus Web Notes. 2002 Dec 9;4(version 5) [Google Scholar]
- 40.Wright BD, Masters G. Rating scale analysis. Chicago: Mesa Press; 1982. [Google Scholar]
- 41.Muthén LK, Muthén BO. Mplus statistical analysis with latent variables: User's guide. 7th. Los Angeles, CA: Muthén & Muthén; 2012. [Google Scholar]
- 42.IBM Corporation. IBM SPSS Statistics for Windows, v 19.0. [Accessed February 14, 2015]; Available at: http://www.ibm.com/software/analytics/spss.
- 43.Muthén & Muthén. Mplus. Available at: http://www.statmodel.com/. Accessed February 14, 2015
- 44.Linacre JM. WINSTEPS Facets Rasch Software. [Accessed February 14, 2015]; Available at: http://www.winsteps.com/index.htm.
- 45.Forkmann T, Gauggel S, Spangenberg L, Brähler E, Glaesmer H. Dimensional assessment of depressive severity in the elderly general population: psychometric evaluation of the PHQ-9 using Rasch analysis. J Affect Disord. 2013;148:323–330. doi: 10.1016/j.jad.2012.12.019. [DOI] [PubMed] [Google Scholar]
- 46.Leboyer M, Slama F, Siever L, Bellivier F. Suicidal disorders: a nosological entity per se? Am J Med Genet C Semin Med Genet. 2005;133C:3–7. doi: 10.1002/ajmg.c.30040. [DOI] [PubMed] [Google Scholar]