

Abstract
Clear cell renal cell carcinoma (ccRCC) is characterized by Von Hippel–Lindau (VHL)-deficiency, resulting in pseudohypoxic, angiogenic and glycolytic tumours. Hydrogen sulfide (H2S) is an endogenously-produced gasotransmitter that accumulates under hypoxia and has been shown to be pro-angiogenic and cytoprotective in cancer. It was hypothesized that H2S levels are elevated in VHL-deficient ccRCC, contributing to survival, metabolism and angiogenesis. Using the H2S-specific probe MeRhoAz, it was found that H2S levels were higher in VHL-deficient ccRCC cell lines compared to cells with wild-type VHL. Inhibition of H2S-producing enzymes could reduce the proliferation, metabolism and survival of ccRCC cell lines, as determined by live-cell imaging, XTT/ATP assay, and flow cytometry respectively. Using the chorioallantoic membrane angiogenesis model, it was found that systemic inhibition of endogenous H2S production was able to decrease vascularization of VHL-deficient ccRCC xenografts. Endogenous H2S production is an attractive new target in ccRCC due to its involvement in multiple aspects of disease.
Keywords: Clear cell renal cell carcinoma, Hydrogen sulfide, Cell hypoxia, Angiogenesis, Cell metabolism, Cell survival
1. Introduction
Renal cell carcinoma (RCC) has a cancer-specific mortality rate of 30–40% [1]. Despite advances in early detection of RCC, upto 30% of RCC patients present with metastatic disease (mRCC), which is highly resistant to systemic chemotherapy and radiation therapy [2]. This has led to the development of alternate RCC therapies that target the molecular basis of the cancer [3].
Of the various histological subtypes of RCC, the most common is the clear cell histotype (ccRCC), accounting for roughly 80% of all RCCs [4]. A common molecular signature of ccRCC, present in 90% of cases, is inactivation of the Von Hippel–Lindau (VHL) tumour suppressor, a protein responsible for the degradation of hypoxia-inducible factors alpha subunits (HIF-1/2α) under normoxia [3,5]. When VHL is inactivated, HIF-1/2α transcription factors are not degraded under normoxic conditions and cells become pseudohypoxic, inappropriately upregulating growth factors and pro-angiogenic factors like vascular endothelial growth factor (VEGF) [3]. As such, recently developed ccRCC therapies aim to disrupt these growth and angiogenic signalling pathways by targeting mammalian target of rapamycin (mTOR) – a master regulator of growth and survival – and VEGF receptors on endothelial cells [3].
Unfortunately, objective response rates of these targeted therapies only approach 50% and durable complete responses are rare [1,6]. There is a need for a truly unique targeted therapy for treatment of mRCC, seeing as significant investment into VEGF and mTOR inhibitors has yet to yield a cure for the disease [7]. Another identifying feature of pseudohypoxic ccRCC tumours which may be a promising target is a strong preference for glycolysis over mitochondrial respiration, even when oxygen is readily available [8]. This shift in metabolism is known as the Warburg Effect, and is thought to provide cancer cells with a cellular environment that facilitates rapid proliferation [9]. Rather than targeting cell proliferation, angiogenesis, and metabolism individually, it might be more favourable to target these processes simultaneously. However, finding good molecular targets that mediate multiple aspects of disease has proven challenging.
Hydrogen sulfide (H2S)’s role as a physiological molecule with pleiotropic functions is becoming increasingly apparent. It is generated endogenously in mammalian cells by three independent enzymes: cystathionine γ-lyase (CSE), cystathionine β-synthase (CBS) and 3-mercaptopyruvate sulfurtransferase (MPST) [10]. Expression of these enzymes within renal epithelial cells is physiologically important because of the role that they play in the detoxification of homocysteine [10,11]. Production of H2S was long regarded as simply a by-product of this process, however there is now evidence that this small gaseous molecule serves diverse functions in the kidneys and throughout the body [12,13]. In the vascular system, H2S functions as a potent vasodilator and pro-angiogenic factor that works in combination with nitric oxide and VEGF [14–16]. Throughout the body H2S has been shown to be cytoprotective and antioxidative in various models of injury and ageing [17,18], and has also been shown to be mitogenic [19].
Under normoxic conditions, H2S is rapidly oxidized by mitochondria through the combined action of the electron transport chain (ETC), the enzyme sulfide quinone reductase (SQR), and the sulfide-oxidizing unit [20–22]. Aerobic mitochondrial oxidation of H2S not only ensures that H2S does not reach a toxic concentration at which Complex IV of the ETC is inhibited, but electrons derived from this oxidation also help to drive mitochondrial ATP production [22]. However under hypoxic conditions when oxygen is scarce, mitochondrial oxidation of H2S ceases, allowing H2S to accumulate and function as an oxygen sensor [23,24]. H2S accumulation under hypoxia helps maintain cell function by upregulating anaerobic metabolic pathways like glycolysis [25], upregulating cytoprotective pathways [26], and helping to restore oxygen supply [15,27].
Given its involvement in angiogenesis, cytoprotection and metabolism, increased H2S production has been linked to various cancers. It has recently been shown that upregulation of CBS in colon cancer cells produces H2S at a level that is capable of sustaining the bioenergetics of malignant colonocytes, which in turn leads to increased proliferation [19,23,28]. In addition, CBS upregulation in tumour cells increases tumour neovascularization [28]. H2S production has also been linked to play a role in cancers of the ovaries, breast and the liver where it may play a role in conferring resistance to radiation therapy, chemotherapy and hypoxia by maintaining supply of glycolytic and antioxidative substrates [29–32]. While the expression of H2S-producing enzymes has not been investigated in ccRCC nor other renal cancers, it was recently found that the expression of CBS is regulated in part by HIF-1/2α subunits [33]. This leads us to hypothesize that expression of endogenous H2S-producing enzymes might be increased in psuedohypoxic ccRCC cell lines, and may contribute to the survival, metabolism and angiogenesis of ccRCC tumours.
Here we describe for the first time that endogenous levels of H2S are increased in VHL-deficient ccRCC cell lines and inhibition of H2S-producing enzymes can significantly decrease the growth, survival, metabolic output and angiogenic potential of ccRCC cell lines. The cell-permeable, H2S-specific, fluorescent probe MeRhoAz was used to measure intracellular levels of H2S in ccRCC cell lines at baseline, and following inhibition/stimulation of H2S-producing enzymes. We evaluated the effects of inhibiting/stimulating endogenous H2S production on ccRCC cell lines in vitro by quantifying cell growth, metabolism and viability in the VHL-deficient ccRCC cell lines 786-O and 769-P, as well as the VHL wild-type ccRCC cell lines Caki-1 and the 786-O VHL knock-in (786-O VHL+). We further evaluated the effects of H2S inhibition on xenograft neovascularization in vivo using an avian xenograft model previously developed for RCC [34].
2. Methods
2.1. Cell culture
All cells were cultured under normal growth conditions (37 °C, 5% CO2, 21% O2) in growth media (Gibco®) supplemented with 10% fetal bovine serum and 1% penicillin/streptomycin. Subculturing of cells was performed weekly with use of 0.05% trypsin EDTA (Gibco®). The human renal epithelial cell line HK-2 was generously donated by Dr. Lakshman Gunaratnam (Western University, London, ON) and cultured in Keratinocyte Serum Free Medium supplemented with human recombinant Epidermal Growth Factor 1–53 and Bovine Pituitary Extract. The VHL wild-type ccRCC cell line Caki-1 was generously donated by Dr. Alison Allan (Western University, London, ON) and cultured in McCoy’s 5A growth medium. The VHL-deficient ccRCC cell lines 769-P and 786-O were also donated by Dr. L. Gunaratnam and cultured in Dulbecco’s Modified Eagle Medium. The ccRCC 786-O VHL+ cell line was generously donated by Dr. James Brugarolas (UT Southwestern, Dallas, TX) and grown in Dulbecco’s Modified Eagle Medium.
2.2. Treatments
Inhibitors of endogenous H2S synthesis – hydroxylamine (HA) and propargyl glycine (PAG) – and the substrate for endogenous H2S production – L-cysteine (LC) – were prepared as 100 mM stock solutions in PBS. Effective doses ranged from 0.5 mM to 5 mM, depending on the assay, and were used to treat cells seeded in 96-well, 24-well, 12-well or 6-well plates. Cells were treated for 6–48 h in either normoxic growth conditions (37 °C, 5% CO2, 21% O2) or hypoxic growth conditions (37 °C, 5% CO2, 1% O2) using a HypOxystation® H85 hypoxia chamber (HYPO2XYGEN, Frederick, MD).
2.3. Real-time measurement of endogenous H2S production
The cell-permeable, H2S-specific, fluorescent probe MeRhoAz was used in combination with live-cell imaging to track endogenous H2S production in our cell cultures in real-time (Hammers et al., In Press). MeRhoAz was generously donated by Dr. Michael Pluth (University of Oregon, Eugene, OR) and is the second-generation product of probes previously developed in the Pluth lab [35]. The live-cell imaging platform used here was the IncuCyte ZOOM (Essen BioScience, Ann Arbour, MI) and its use was graciously afforded by Dr. Anthony Jevnikar (Western University, London, ON). Cells were seeded into 96-well plates (2 × 10⁴ cells per well) and allowed to adhere overnight. Treatments and MeRhoAz were added to wells simultaneously and green channel fluorescent images of each well were captured every 30 min for 15 h (4× objective, 440 nm excitation/520 nm emission). Using IncuCyte internal software, thresholding was performed on wells in which no MeRhoAz had been added in order to eliminate background cellular fluorescence. The total number of cells fluorescing above the established threshold was quantified, yielding a Total Probe Count. IncuCyte internal software was also able to quantify percentage cell confluency after additional thresholding, and this was used to normalize the Total Probe Count.
2.4. Western blot analysis
Cells were plated into 60 mm dishes and allowed to reach 90–100% confluency. Cells were either kept in normoxia or exposed to hypoxia for 6–24 h. Following treatment, media was aspirated, cells were washed twice with PBS before being lysed on ice for 15 min in RIPA buffer. Lysates were collected and centrifuged at 4 °C and 10,000 × g for 10 min before being aliquoted and stored at −80 °C. Forty-fifty micrograms of each sample was run on 10–12%, Tris-glycine, SDS-polyacrylamide gels under thiol-reducing conditions at 60–120 V and transferred to PVDF membranes for 45 min at 80 V. Membranes were blocked in TBS (5% BSA) and incubated overnight at 4 °C with primary antibody (mouse-anti-human CBS (B-4): Santacruz Biotechnology Inc., sc-133154; rabbit-anti-human CTH (CSE): Sigma Aldrich, SAB2100501; mouse-anti-human MPST (D-8): Santacruz Biotechnology Inc., sc-374326; mouse-anti-human β-actin: Sigma Aldrich, A5441). Membranes were washed in TBS (1% Tween-20) for 3 × 10 min, incubated with HRP-conjugated secondary antibody (goat-anti-mouse IgG HRP conjugate: Life Technologies™, G-21040; goat-anti-rabbit IgG-HRP-conjugate: Jackson Immunoresearch Laboratories Inc., 111-035-003) for 1 h at room temperature and washed for 3 × 10 min. Chemiluminescence was induced using Luminata™ Crescendo Western HRP Substrate (EMD Millipore, WBLUR0100A). Blots were imaged using the C-DiGit® Blot Scanner (LI-COR) and subsequently analyzed using Image Studio Lite version 4.0.
2.5. Cell growth assay
Cells were seeded into 96-well plates (1 × 10⁴ cells per well) and allowed to adhere overnight, resulting in roughly 50% confluency at the time of treatment. Treatments were added to wells and images (4× magnification) of each well were captured every 30 min for 12 h using the IncuCyte ZOOM live-cell imaging platform (Essen BioScience, Ann Arbour, MI). Using IncuCyte internal software, thresholding was performed on wells in which cells received no treatment in order to optimize quantitation of cell confluency. The percentage change in confluency for each individual well was then calculated.
2.6. Cell viability assay
Cells were seeded into 12-well plates and allowed to reach 70–90% confluency. Treatments were applied and cells were then placed in hypoxic or normoxic growth conditions for 48 h. Following treatment, cells were trypsinized and washed with PBS in preparation for flow cytometry. Cells were stained with the necrosis marker 7-AAD (Biolegend®, 420404) and the apoptosis marker phycoerythrin-conjugated Annexin-V (Biolegend®, 640908) and analyzed using the Cytomics FC500 flow cytometer (Beckman Coulter, Mississauga, ON). Heat-killed samples singly stained for each marker and doubly stained for both markers served as positive controls for compensation analysis. Cells identified as viable were those negative for both Annexin-V and 7-AAD, as compared to the gated normoxic control samples.
2.7. XTT cytotoxicity assay
Pre-assay optimization was performed according to manufacturer protocol (ATCC, 30–1011 K) which allowed for identification of ideal seeding density and ideal reagent incubation time. In 96-well plates, 786-O, 769-P and 786-O VHL+ cells were plated at 1 × 10⁴ cells/mL, whereas Caki-1 and HK-2 cells were plated at 5 × 10⁴ cells/mL. Following plating, cells were allowed to adhere overnight before addition of treatment and growth under either normoxia or hypoxia. Cells were treated for 44 h before addition of XTT Reagent to growth media for the remainder of the 48 h incubation. Plates were read by a spectrophotometer at 660 nm, for measurement of non-specific absorbance, and again at 475 nm for measurement of metabolic activity. Wells were also blanked against growth media without cells or drug added. Data was then normalized to the normoxic control after converting all final readings to positive values.
2.8. Chorioallantoic membrane xenograft assay
Four RCC cell lines (Caki-1, 769-P, 786-O, and 786-O VHL+) were seeded and grown to 50–60% confluency. Cells were inoculated with ZsGreen lentiviral vector containing a gene for extreme green fluorescent protein (EGFP) and a puromycin resistance gene for pooled clone selection. Two days following infection, EGFP-expressing cells were selected for using 1–2 μg/mL of puromycin, depending on the cell line. Puromycin was removed from growth medium following 2 weeks of sub-culturing.
Fertilized chicken eggs were incubated at 37 °C in humidified, non-sterile conditions for three days before being cracked and deposited into individual plastic trays. Embryos were placed back in the incubator and were ready for introduction of cancer cells after another six days of incubation. On day 9 post-fertilization (pf), a filter paper disc 7 mm in diameter was placed onto the chorioallantoic membrane (CAM) near large oxygenated blood vessels and subsequently ripped off to remove the upper-most layers of the CAM. Ten microlitres of a 1:1 suspension of EGFP-expressing cancer cells in BD Matrigel™ were then implanted on top of this exposed area, and tumours were given two days to establish themselves within the tissue.
At 2 days post-implantation, tumours that had successfully begun recruiting blood vessels were randomly sorted into four groups. Intravascular injections of 50 μL of either: i) 20 mM HA, ii) 10 mM LC, iii) 20 mM HA + 10 mM LC or iv) PBS vehicle control were administered daily on days 11 pf through 14 pf. On day 15 pf, embryos were intravascularly injected with 75 μL of 0.5 mg/mL rhodamine-labelled lens culinaris agglutinin (rhodamine-LCA; Vector Laboratories, RL-1042) to fluorescently label vasculature for subsequent analysis prior to harvesting tumours from the CAM. As a control, 4 PBS-treated tumours were harvested and analyzed without rhodamine-LCA injection. Tumours were washed in PBS then fixed in 10% neutral buffered formalin containing 30% sucrose for a minimum of 1 week. Tumours were then embedded in Optimal Cutting Temperature compound and stored at −80 °C until sectioning. Using a CM30505 Cryostat (Leica, Concord, ON), ten 10 μm sections were obtained from various depths of each tumour, with the plane of sectioning running parallel to the surface of the once-surrounding CAM.
Fluorescence stereoscope images of tumours were obtained at 20× magnification using the AX10 Zoom V.16 stereoscope (Zeiss, Toronto, ON) before tumours were harvested from the CAM. The cross-sectional area of stereoscope tumour images was measured using the hand trace tool in ImageJ Software.
Sectioning and imaging/analysis of tumours were performed by separate individuals and both were performed in a blinded fashion. Sections were imaged using the Fluoview FV1200 confocal laser scanning microscope (Olympus, Toronto, ON) and the number of rhodamine-LCA positive blood vessels in each field of view was visually quantified.
2.9. Statistical analyses
All statistical analyses were performed using GraphPad Prism v6.05 software. Figures displaying representative data of one independent experiment show standard deviation of the mean. Figures displaying data of multiple independent experiments show standard error of the mean. Results from one-way ANOVA were further subjected to Tukey’s multiple comparisons test. Results from two-way ANOVA were further subjected to Sidak’s multiple comparisons test, Tukey’s multiple comparisons test and Dunnet’s multiple comparisons test.
3. Results
3.1. Endogenous levels of H2S are elevated in VHL-deficient ccRCC cell lines
To address whether baseline H2S production is increased in VHL-deficient ccRCC, endogenous levels of H2S were measured in two VHL-deficient ccRCC cell lines (786-O and 769-P) and compared to a VHL wild-type ccRCC cell line (Caki-1) and a nonmalignant renal cell line (HK-2). Accumulation of intracellular H2S was tracked over 15 h using MeRhoAz in combination with live-cell imaging (Fig. 1). It was found that significant accumulation of H2S occurred in HK-2 cells (p < 0.001), 786-O cells (p < 0.0001) and 769-P cells (p < 0.0001) over 15 h, though not in Caki-1 cells (Fig. 1Aii). When compared to HK-2 cells, the accumulation of H2S in 786-O and 769-P cells after 15 h was significantly greater (p < 0.0001), while the accumulation of H2S in Caki-1 cells was not (Fig. 1Aiii, 1B). Accumulation of H2S in the VHL-deficient ccRCC cell lines after 15 h was also significantly greater (p < 0.0001) than in the VHL wild-type Caki-1 cells (Fig. 1Aiii).
Fig. 1. Baseline endogenous H2S production is greater in VHL-deficient ccRCC cell lines than in VHL wild-type malignant and non-malignant renal cell lines.
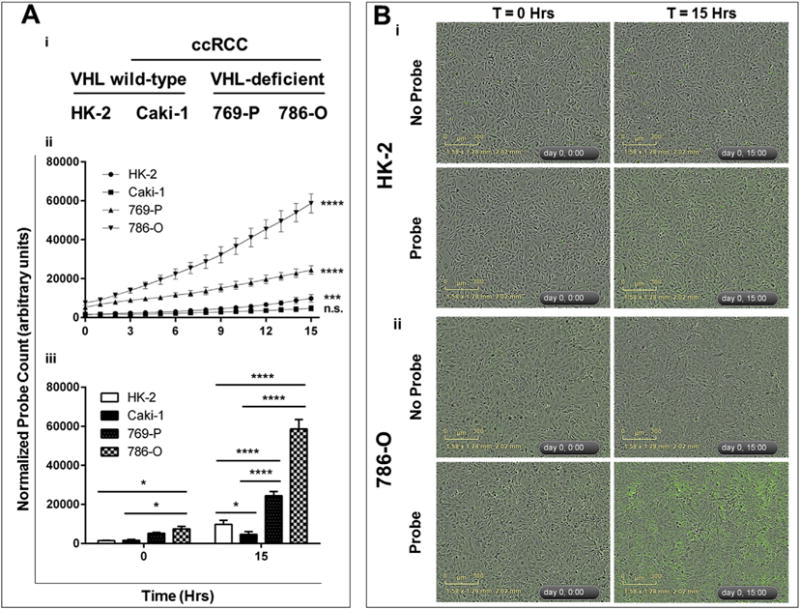
Cells were seeded into 96-well plates and allowed to reach 90–100% confluency. A cell-permeable probe that reacts specifically with H2S to fluoresce green (MeRhoAz) was then either added (probe), or not added (no probe), to growth media and cells were imaged every hour for 15 h. Following imaging, the number of fluorescent “hits” was normalized to cell confluency for each well and each time point, resulting in a normalized probe count which was then averaged (n = 3, error bars represent standard deviation of the mean). Results are representative of 3 independent experiments (n = 9 total). One-way ANOVA with Tukey’s multiple comparisons test was used to asses statistically significant differences between groups (*p < 0.05; **p < 0.01; ***p < 0.001; ****p < 0.0001). (A) (i) VHL mutation status of nonmalignant renal cells (HK-2) and ccRCC cell lines (Caki-1, 769-P, 786-O). (ii) Statistically significant changes in endogenous H2S production over time (between 0 h and 15 h) in each cell line. (iii) Statistically significant differences in endogenous H2S production between cell lines. (B) Representative images of enhanced endogenous H2S production in 786-O cells (ii) as compared to HK-2 cells (i).
It was hypothesized that VHL inactivation leads to increased expression of the H2S-producing enzymes CBS, CSE and/or MPST, which in turn leads to increased cellular levels of H2S. To answer this question, western blot analysis of CBS, CSE and MPST was performed to determine baseline expression of these enzymes in HK-2, Caki-1, 786-O and 769-P cell lines (Supplementary Figure 1). There were no significant differences in baseline normoxic expression of CBS, CSE, nor MPST between cell lines (Supplementary Figure 1).
To more thoroughly investigate the relationship between VHL function and hypoxic induction of CBS, CSE and MPST, western blot analysis comparing expression of CBS, CSE and MPST in 786-O and 786-O VHL+ cells grown in normoxia and hypoxia was performed (Fig. 2). When VHL function was restored to 786-O cells, expression of CBS and CSE decreased slightly under normoxia, though not significantly, while expression of MPST did not change (Fig. 2B,C). A slight decline in endogenous H2S production, as measured by methylene blue assay, was also observed in 786-O cells upon VHL knock-in (data not shown). When cells were grown in hypoxia for 24 h, expression of CBS and CSE in VHL knock-in cells increased, returning to levels seen in wild-type 786-O cells (Fig. 2B,C). Similar hypoxic induction experiments were performed in unmolested ccRCC cell lines, which revealed no relationship between VHL inactivation and aberrant upregulation of CBS, CSE and MPST (Supplementary Figure 2).
Fig. 2. Inhibition of endogenous H2S production reduces elevated levels of H2S in VHL-deficient ccRCC cell lines.
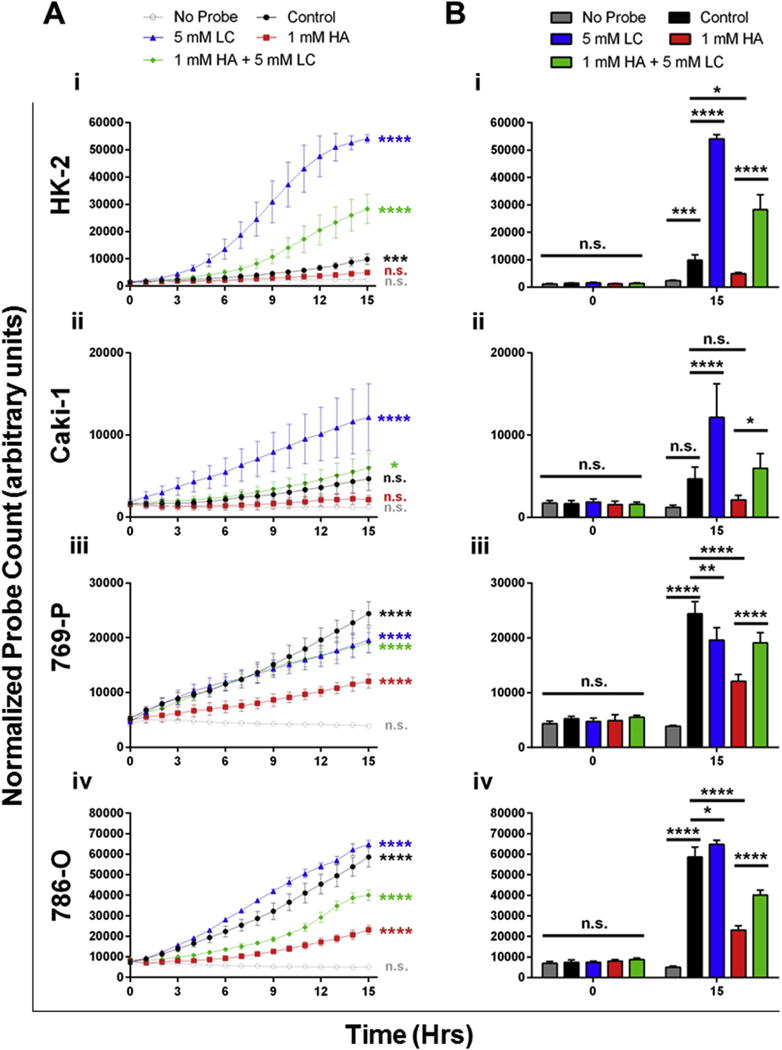
Cells were seeded into 96-well plates and allowed to reach 90–100% confluency. A cell-permeable probe that reacts specifically with H2S to fluoresce green (MeRhoAz) was then added (or not added; ie. no probe), to growth media. At the same time, cells were treated with either PBS vehicle (control; black) an inhibitor of endogenous H2S synthesis (hydroxylamine (HA); 1 mM; red), the substrate for endogenous H2S synthesis (L-cysteine (LC); 5 mM; blue) or a combination of the two (1 mM HA + 5 mM LC; green). Cells were imaged every hour for 15 h and background fluorescence was compensated for using thresholding. Following compensation, the number of fluorescent “hits” was normalized to cell confluency for each well and each time point, resulting in a normalized probe count which was then averaged (n = 3, error bars represent standard deviation of the mean). Results are representative of 3 independent experiments (n = 9 total). One-way ANOVA with Tukey’s multiple comparisons test was used to asses statistically significant differences between groups (*p < 0.05; **p < 0.01; ***p < 0.001; ****p < 0.0001). (A) Statistically significant changes in endogenous H2S production over time (between 0 h and 15 h) were determined for each treatment in HK-2 (i), Caki-1 (ii), 769-P (iii) and 786-O (iv) cells. (B) Statistically significant differences in endogenous H2S production between treatments were determined in each cell line. (For interpretation of the references to colour in this figure legend, the reader is referred to the web version of this article.)
3.2. Endogenous H2S production can be targeted in ccRCC cell lines
The dual CBS/CSE inhibitor HA, the CSE inhibitor PAG and the substrate for endogenous H2S production LC were administered to HK-2, Caki-1, 786-O and 769-P cell lines to determine if they could influence baseline H2S production (Fig. 3). Using MeRhoAz it was found that accumulation of H2S in HK-2 cells significantly (p < 0.0001) increased over time when LC (blue) was added to growth media (Fig. 3Ai) and that this increase in H2S was significantly greater than the increase observed in untreated cells (Fig. 3Bi). LC was able to evoke a similar response in VHL wild-type Caki-1 cells (Fig. 3Aii, Bii). However, in the VHL-deficient ccRCC cell lines, treatment with LC did not increase endogenous H2S production to the same degree, as a result of increased baseline levels (Fig. 3Aiii, Biii, Aiv, Biv).
Fig. 3. Normoxic expression and hypoxic induction of H2S-producing enzymes in wild-type 786-O cells (786-O) and VHL knock-in 786-O cells (786-O VHL+).
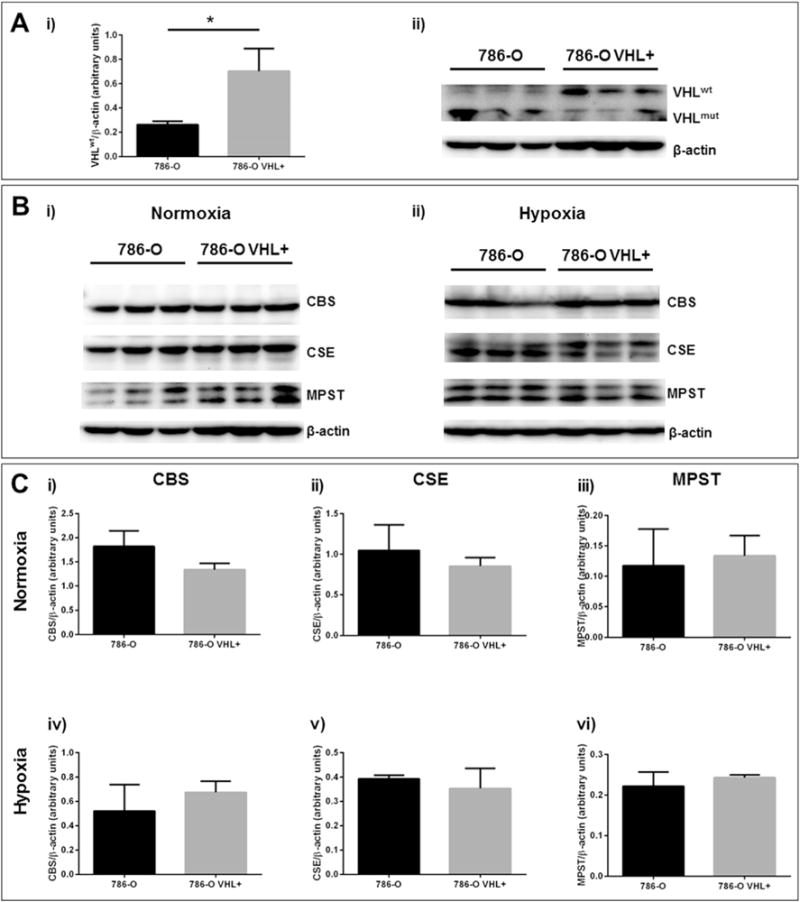
Protein was isolated from 80 to 90% confluent cell cultures grown in normoxia (21% O2) or hypoxia (1% O2) for 15 h using RIPA buffer. SDS-PAGE was carried out on 40–50 μg of whole cell lysate using 10–12% poly-acrylamide gels and western blots were performed using PVDF membranes. (A) Validation of VHLwt (20 kDa) knock-in was performed under normoxic growth conditions. (B, C) Normoxic expression or hypoxic induction of CBS (63 kDa), MPST (33 kDa) and CSE (45 kDa) was evaluated in 786-O and 786-O VHL+ cell lines. Protein levels were expressed relative to β-actin (43 kDa). Error bars represent standard error of the mean (SEM), n = 3. One-way ANOVA and Tukey’s multiple comparisons test indicate statistically significant differences (p < 0.05) where indicated (*).
As a result of their elevated baseline production of H2S, VHL-deficient ccRCC cell lines were much more susceptible to inhibition with HA when compared to non-malignant HK-2 cells and VHL wild-type Caki-1 cells (Fig. 3, red). There was no significant accumulation of H2S in HK-2 cells over 15 h when cultured in the presence of HA (Fig. 6Ai) and levels of H2S in HA-treated cells were significantly (p < 0.05) lower than in untreated cells (Fig. 3Bi). Reduction in H2S synthesis upon HA treatment were more significant in 769-P cells (p < 0.0001; Fig. 3Biii) and 786-O cells (p < 0.0001; Fig. 3Biv). Treatment of all cell lines with a combination of HA and LC could significantly increase production of H2S when compared to treatment with HA alone (Fig. 3, green). Treatment with the CSE inhibitor PAG did not significantly decrease endogenous H2S production (data not shown).
Fig. 6. Inhibition of endogenous H2S production selectively kills ccRCC cells over non-malignant renal cells.
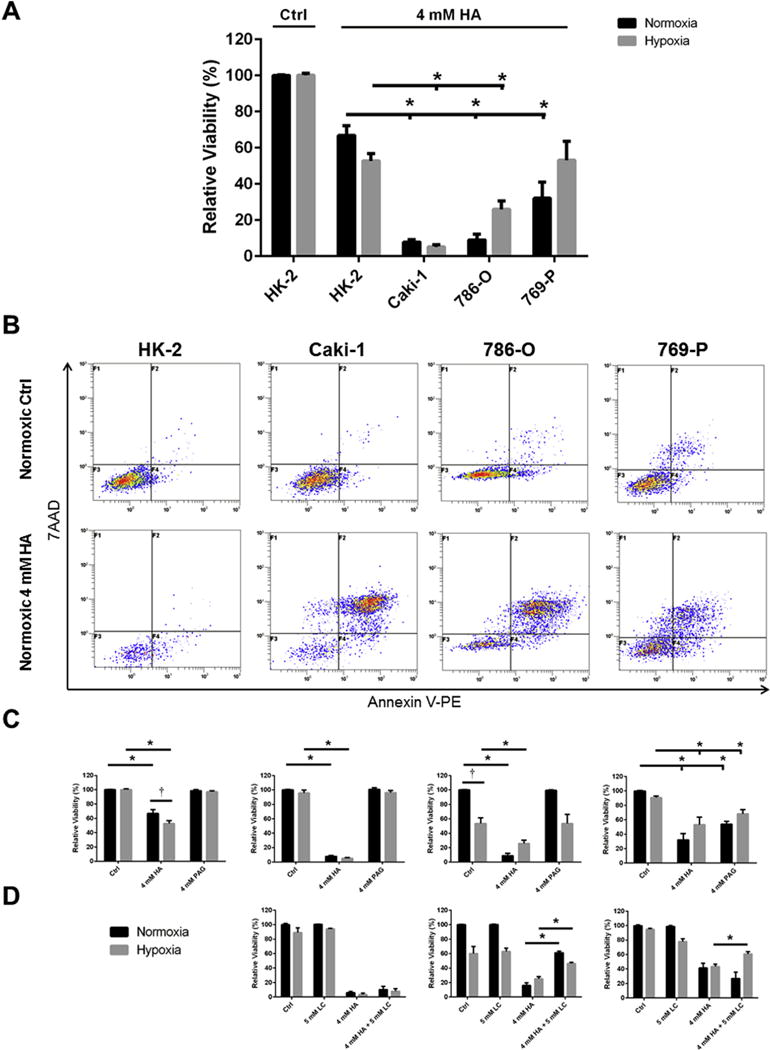
Cells were treated for 48 h with inhibitors of endogenous H2S production hydroxylamine (HA) and propargyl glycine (PAG) and/or the substrate for endogenous H2S production L-cysteine (LC) in normoxic (21% O2) or hypoxic (1% O2) growth conditions. Cell culture viability was determined via detection of Annexin-V-PE and 7AAD using flow cytometry and quantified relative to the untreated, normoxic cells within each experimental trial. Error bars represent standard error of the mean (SEM). Two-way ANOVA with Dunnett’s multiple comparisons test was used to asses significant differences between groups (i.e. normoxic control vs. hypoxia control; †; p < 0.05). Two-way ANOVA with Sidak’s multiple comparisons test was used to assess significant differences between treatments within groups (i.e. normoxic control vs. normoxic 4 mM HA; *; p < 0.05). (A) ccRCC cell lines are more susceptible to treatment with HA than non-malignant HK-2 cells, n = 6–9. (B) Representative flow cytometry dot plots illustrating changes in normoxic viability of cell lines following treatment with 4 mM HA, as quantified in (A). (C) Differential susceptibility of ccRCC cell lines to treatment with HA and PAG (HK-2, n = 6; Caki-1, n = 6–8; 786-O, n = 6–10; 769-P, n = 6–12). (D) VHL-deficient ccRCC cell lines treated with HA and LC simultaneously display attenuated declines in viability (Caki-1, n = 3–6; 786-O, n = 4–6; 769-P, n = 3–8).
3.3. Inhibition of endogenous H2S production restricts the growth, metabolism and survival of ccRCC cell lines
Cells were treated with HA and cell confluency was tracked over 15 h using live-cell imaging to determine whether endogenous H2S production plays a role in mediating cell growth (Fig. 4). HA appeared to slightly restrict the growth of HK-2 cells, although results were not significant (Fig. 4). Significant (p < 0.05) restriction of cell growth was observed in Caki-1 cells, 769-P cells and 786-O cells, though not in 786-O VHL+ cells (Fig. 4). While higher concentrations of HA (1 mM) were cytotoxic to ccRCC cell lines, lower concentrations of HA (0.1 mM) did not restrict cell growth (data not shown), revealing a narrow range of the inhibitor’s cytostatic effects. There was no clear relationship between VHL inactivation, and reliance on H2S for cell growth (Fig. 4).
Fig. 4. Inhibition of endogenous H2S production attenuates proliferation of ccRCC cell lines.
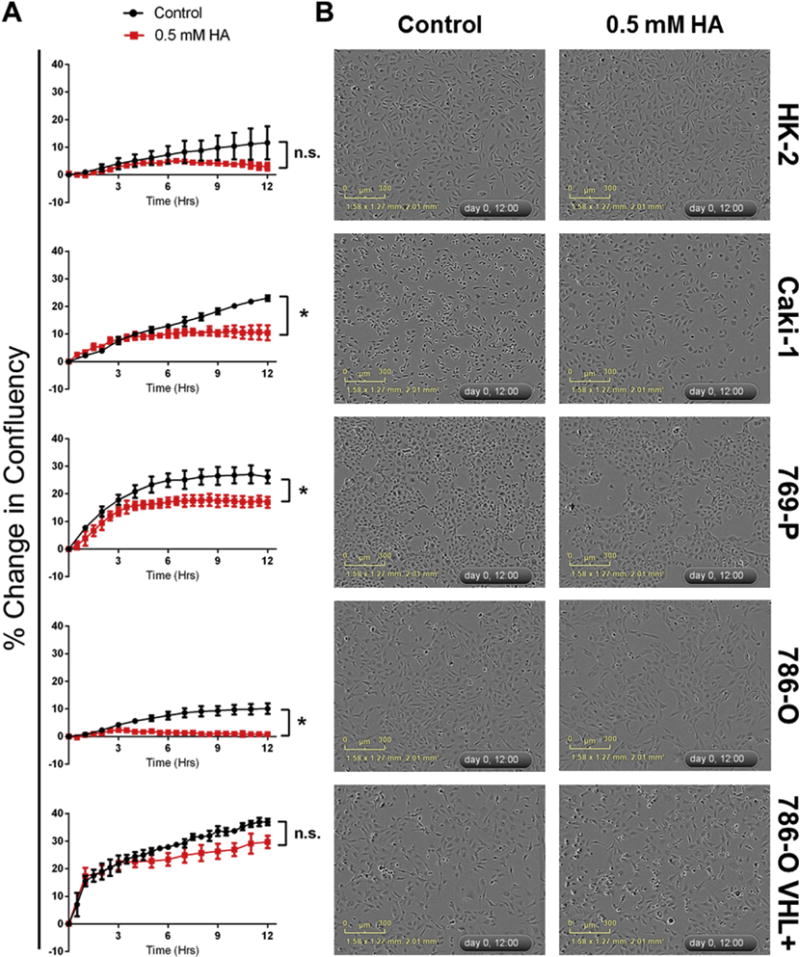
Cells were seeded into 96-well plates and allowed to reach 40–60% confluency. Cells were treated with either PBS vehicle (control; black) or an inhibitor of endogenous H2S synthesis (hydroxylamine (HA); 0.5 mM; red). Cells were imaged every hour for 12 h and phase confluency was measured. (A) Following imaging, percentage change in cell confluency was determined for each well and averaged for each time point (n = 3, error bars represent standard deviation of the mean). Results are representative of 2 independent experiments (n = 6 total). Multiple t-tests were used to asses statistically significant differences between groups at T = 12 h (*p < 0.05). (B) Representative images depicting inhibition of cell proliferation following 12 h treatment with HA. (For interpretation of the references to colour in this figure legend, the reader is referred to the web version of this article.)
To determine if declines in cell growth upon inhibition of endogenous H2S production were the result of deficits in metabolic activity, the XTT cytotoxicity assay was used to measure alterations in metabolic activity after 48 h treatment (Fig. 5). It was observed that the VHL-deficient cell lines 786-O and 769-P suffered significant declines in metabolic activity upon treatment with HA (p < 0.05) while the VHL wild-type cell lines HK-2, Caki-1 and 786-O VHL+ did not (Fig. 5). Combined treatment with HA and LC resulted in significant (p < 0.05) restoration of hypoxic metabolic activity compared to HA treatment alone in the VHL-deficient ccRCC cell lines 786-O and 769-P (Fig. 5). HA treatment was also observed to significantly (p < 0.05) decrease ATP production in ccRCC cells, though this was not dependant on VHL inactivation (data not shown).
Fig. 5. Inhibition of endogenous H2S production reduces overall metabolic activity of ccRCC cell lines.
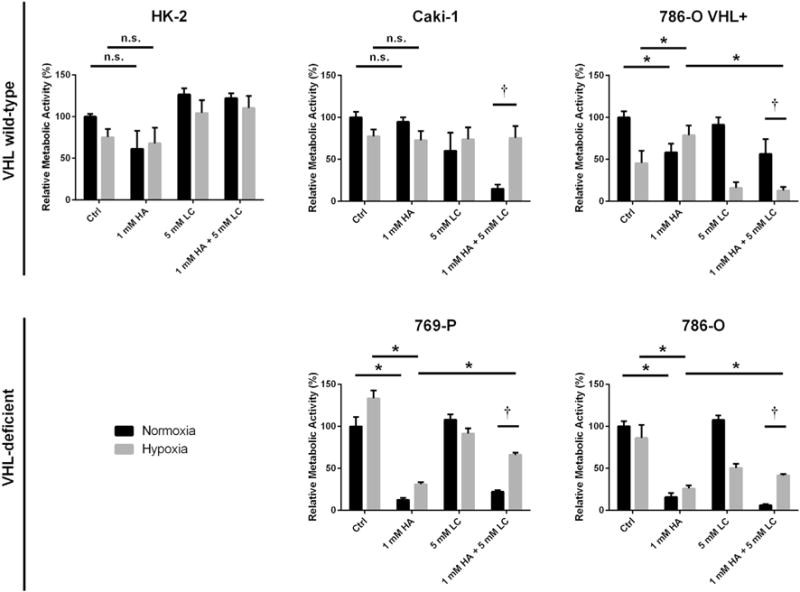
Metabolic activity was assessed via the XTT assay following 48 h treatment with 1 mM hydroxylamine (HA), 5 mM L-cysteine (LC) or a combination of both. Values are presented as relative to the untreated, normoxic cells within each experimental trial. Error bars represent standard error of the mean (SEM). HK-2 (n = 6), Caki-1 (n = 6), 786-O VHL+ (n = 6), 769-P (n = 5–6), 786-O (n = 5–6). Two-way ANOVA with Dunnett’s multiple comparisons test was used to asses significant differences between groups (normoxic control vs. hypoxia control; †; p < 0.05). Two-way ANOVA with Sidak’s multiple comparisons test was used to assess significant differences between treatments within groups (normoxic control vs. normoxic 1 mM HA; *; p < 0.05).
Cells were treated with HA and PAG to determine whether loss of endogenous H2S production impacts 48 h cell survival under normoxic and hypoxic conditions, as determined by Annexin-V-PE and 7-AAD detection (Fig. 6). Under normoxic conditions all ccRCC cell lines were found to be significantly (p < 0.05) more susceptible to treatment with HA than HK-2 cells (Fig. 6A,B). Caki-1 and 786-O cell lines were also significantly (p < 0.05) more susceptible to treatment with HA than HK-2 cells under hypoxic conditions, however 769-P cells were not (Fig. 6A). The reduction in hypoxic viability of HK-2 cells was significantly (p < 0.05) greater than the reduction in normoxic viability, while the opposite was true of the ccRCC cell lines (Fig. 6C). Inhibition of CSE alone, through use of the inhibitor PAG, proved to be less effective in reducing viability than inhibition of CBS and CSE through use of the inhibitor HA (Fig. 6C). The only cell line to display significant declines in viability following PAG treatment was the ccRCC cell line 769-P (Fig. 6C). When treated with a combination of HA and LC, the VHL-deficient ccRCC cell lines 769-P and 786-O displayed significant (p < 0.05) restoration of viability when compared to treatment with HA alone (Fig. 6D). The same could not be said of the VHL wild-type Caki-1 cell line (Fig. 6D).
3.4. Inhibition of endogenous H2S production restricts the neovascularization and growth of ccRCC xenografts
H2S is known to participate in paracrine angiogenic signalling and has been shown to play a role in the vascularization of other cancers. To investigate the effects of endogenous H2S production on the vascularization of ccRCC tumours, the chick chorioallantoic membrane (CAM) was used as a vascular structure for xenograft implantation of ccRCC cell lines. Cell lines were manipulated to express EGFP and chick vasculature was labelled with rhodamine-labelled lens culinaris agglutinin (rhodamine-LCA) such that the number of intratumoural blood vessels could be quantified using fluorescent microscopy. Treatments were administered systemically via intravascular injection for four consecutive days following two days of initial tumour growth and then harvested, sectioned and imaged (Fig. 7).
Fig. 7. Systemic inhibition of endogenous H2S production with hydroxylamine (HA) reduces the vascularization of VHL-deficient ccRCC xenografts.
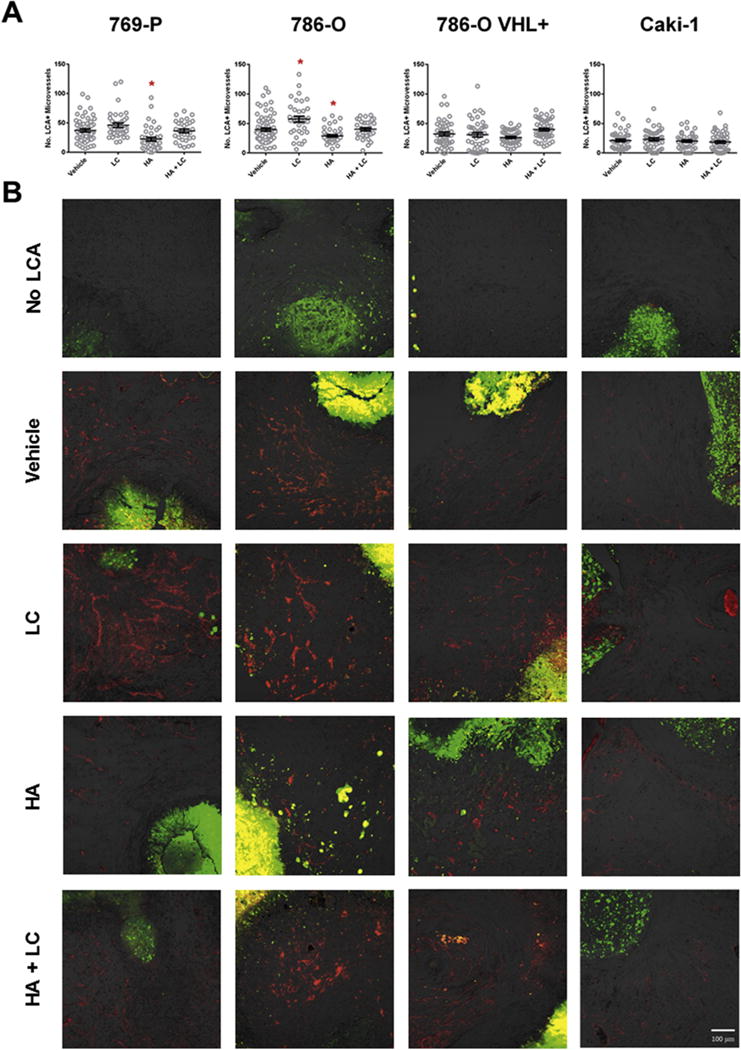
ccRCC cell lines were xenografted into the CAM of 9-day old chicken embryos and given 2 days to establish themselves within the surrounding tissue. Embryos were then systemically treated once a day for 4 days with 50 μL of 20 mM hydroxylamine (HA), 10 mM L-cysteine (LC) or a combination of both (HA + LC) through intravascular microinjection. Prior to harvest, embryos were systemically injected with rhodamine-conjugated lens culinaris agglutinin (rhodamine-LCA) to label all chick vasculature. (A) The number of rhodamine-LCA-positive blood vessels present in each field of view shot was counted manually following confocal imaging at 200× total magnification. Error bars represent standard error of the mean (n ≥ 30 per treatment). One-way ANOVA with Dunnet’s multiple comparisons test was used to asses statistical significance of treatments compared to PBS vehicle control (*; p < 0.05). (B) Representative images of data depicted in (A). Rhodamine-LCA-positive blood vessels (red) are seen in close proximity to EGFP-expressing RCC cells (green). Scale bar represents 100 μm.
Treatment with HA was able to significantly (p < 0.05) decrease the vascularization of the VHL-deficient 786-O and 769-P xenografts while the same treatment had no effect on the vascularization of VHL wild-type Caki-1 xenografts (Fig. 7). Treatment with LC was able to significantly (p < 0.05) increase the number of intratumoural blood vessels (Fig. 7A) and also appeared to dilate blood vessels (Fig. 7B). When 786-O and 769-P xenografts were treated with a combination of HA and LC simultaneously, the decline in vascularization observed with HA treatment alone was attenuated (Fig. 7). Knock-in of VHL into the 786-O cell line not only decreased overall vascularization of untreated xenografts, but also appeared to eliminate the xenograft’s sensitivity to HA and LC treatment (Fig. 7).
Similar trends were observed when analyzing the effect of H2S production on tumour growth as measured by cross-sectional area of whole tumours prior to harvest (Fig. 8). HA treatment was able to significantly (p < 0.05) decrease the size of 769-P xenografts and appeared to have the same effect on 786-O cells, although the observed decrease was not statistically significant (Fig. 8). Conversely, HA treatment had no effect on the cross-sectional area of VHL wild-type Caki-1 and 786-O VHL+ xenografts (Fig. 8). As with vascularization, treatment with HA and LC simultaneously was able to attenuate the decrease in size in 786-O and 769-P xenografts (Fig. 8). Qualitative inspection of tumours revealed that HA treatment also resulted in necrotic and dysmorphic tumours (Fig. 8).
Fig. 8. Systemic inhibition of endogenous H2S production with hydroxylamine (HA) restricts the growth of VHL-deficient ccRCC xenografts.
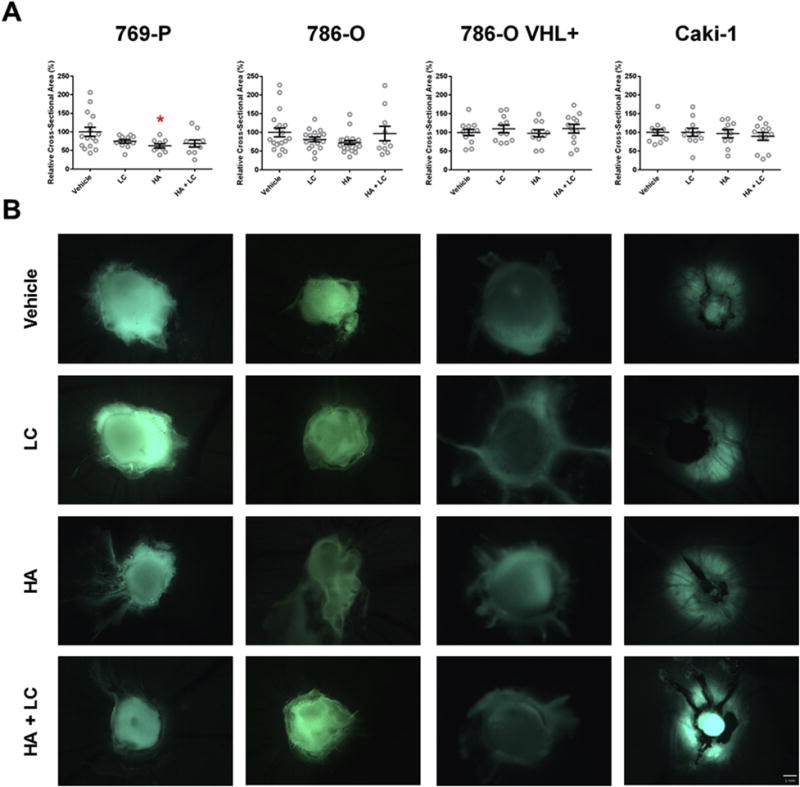
ccRCC cell lines were xenografted into the CAM of 9-day old chicken embryos and given 2 days to establish themselves within the surrounding tissue. Embryos were then systemically treated once a day for 4 days with 50 μL of 20 mM hydroxylamine (HA), 10 mM L-cysteine (LC) or a combination of both (HA + LC) through intravascular microinjection. Prior to harvest, fluorescent stereoscope images were obtained for each tumour. (A) The cross-sectional area of stereoscope images (20×) of each tumour was measured using ImageJ software. Error bars represent standard error of the mean (n ≥ 10 per treatment). One-way ANOVA with Dunnet’s multiple comparisons test was used to asses statistical significance of treatments compared to PBS vehicle control (*; p < 0.05). (B) Representative images of data depicted in (A). zsGreen expression (green) was used to identify RCC cells. Scale bar represents 1 mm. (For interpretation of the references to colour in this figure legend, the reader is referred to the web version of this article.)
4. Discussion
The efficacy of targeted cancer therapies lies in the cancer possessing some trait that non-malignant cells do not possess. Targeted therapies that have been developed for treatment of ccRCC are clinically effective due to their ability to specifically target these traits with relatively mild adverse effects [36]. However, while specificity of action is desired with any treatment, it inherently limits the range of cellular processes that are subject to inhibition. In the case of ccRCC, today’s clinical therapies are unable to concurrently target tumour cell survival and the tumour’s angiogenic potential [7]. While the targeted approach has been shown to be a sound one, the identification of new targets that may be mediating multiple aspects of disease should continue to be pursued. Here it has been shown that targeting the endogenous production of H2S can reduce the proliferation, metabolic output, survival and angiogenic potential of ccRCC cell lines, with minimal effects on non-malignant cells treated in vitro and in vivo. This presents endogenous H2S-production as a valuable target in ccRCC, which when inhibited can challenge the disease on multiple fronts.
It was originally hypothesized that endogenous production of H2S would be increased in ccRCC cell lines lacking a functional copy of the VHL tumour suppressor, as a result of HIF-1/2α-mediated upregulation of H2S-producing enzymes. While levels of H2S were elevated in VHL-deficient ccRCC cell lines, western blot analysis revealed that this was not due to increased expression of the H2S-producing enzymes – CBS, CSE and MPST. Conversely, it is likely that elevated levels of H2S in pseudohypoxic ccRCC cell lines is due to a lack of mitochondrial oxidation, thus eliminating the primary mechanism of H2S removal. It has previously been reported that primary ccRCC cells have very few mitochondria, low mitochondrial activity and low oxygen consumption, all of which would support this theory [8]. Furthermore, loss of VHL function and HIF-1/2α accumulation has been implicated in mitochondrial suppression and the induction of aerobic glycolysis [37,38]. Therefore, while pseudohypoxia does not influence H2S production through induction of CBS, CSE and MPST, pseudohypoxia does result in H2S accumulation by decreasing mitochondrial oxidation.
Loss of VHL function can result in tumours that overexpress HIF-1α and HIF-2α to varying degrees, resulting in two distinct pseudohypoxic ccRCC subtypes [39,40]. It is well accepted that a key initiating event in ccRCC progression is loss of VHL function, resulting in tumours that overexpress both HIF-1α and HIF-2α and are said to have an H1H2 phenotype [40]. Recent evidence suggests that loss of HIF-1α – resulting in the more aggressive H2 phenotype – may be another key event in ccRCC progression, although the mechanism by which HIF-1α is lost is unknown [41–43]. Exogenous H2S has been shown to reduce both the translational expression, and the activity of HIF-1α [44], however this effect has been shown to be dependent on VHL function and mitochondrial activity [45]. Interestingly, H2S-mediated HIF-1α degradation also only occurs under true hypoxic conditions – not in response to hypoxia-mimetics, or pseudohypoxia [45]. There is also evidence that a reducing environment can enhance the stability of HIF-2α, although the effects of a reducing environment on HIF-1α stability were not investigated [46]. Further investigation into whether increased levels of endogenous H2S plays a role in loss of HIF-1α in ccRCC is required. Such investigation may help to explain some of the differences between pseudohypoxic ccRCC cell lines (786-O and 769-P) which were observed here.
Here we showed that H2S production contributes to the enhanced proliferation observed in ccRCC cell lines, and targeting its production can halt cell proliferation. Exogenous H2S has been shown to play a role in the cell cycle entry and proliferation of colonocytes through increased production of NADPH, activation of mitogen-activated protein kinase and Akt signalling pathways, and inactivation of the cell-cycle inhibitor p21 [19,47]. Likewise, inhibition of endogenous H2S synthesis can slow the proliferation of ovarian cancer and colon cancer cell lines [28,29]. There appears to be a narrow range of concentrations – as well as a narrow window of treatment time – at which the CBS/CSE inhibitor stopped proliferation before becoming cytotoxic. As the length of treatment time and/or concentration of the inhibitor increased, loss of H2S production resulted in decreased metabolic activity, decreased ATP production, and ultimately resulted in apoptotic/necrotic cell death. Seeing as loss of H2S production was ultimately cytotoxic in ccRCC cell lines and not simply cytostatic, one is led to believe that it plays an important role in energy production. As suggested here, a slight decrease in H2S production may result in a small deficit in energy production and influence the cell to stop dividing in order to maintain essential survival processes. However, a greater decrease in H2S production may result in a significant deficit in energy production to the point where the cell can no longer maintain essential biologic processes and dies.
The XTT assay measures metabolic activity by gauging the oxidative potential of coenzyme Q of the ETC. In addition to accepting electrons from NADH, coenzyme Q also receives electrons from H2S via the enzyme SQR, and is one way by which H2S can fuel energy production [23]. One might then question how pseudohypoxic ccRCC cell lines with low mitochondrial activity can have such high XTT outputs. Interestingly, coenzyme Q also serves antioxidative functions within the plasma membrane, playing a role in the oxidative stress response [48]. Therefore, a positive signal in the XTT assay can also indicate increased antioxidative activity, increased resistance to oxidative stress, and improvement in survival. It is known that the metabolic reprogramming in VHL-deficient ccRCC helps to keep oxidative stress in check by rerouting certain glycolytic intermediates towards the production of the antioxidant NADPH [9]. In order for aerobic glycolysis to function and increase production of NADPH, NAD+ levels must remain high [49]. Recent evidence has shown that production of H2S in other cancers is a crucial component of the aerobic glycolysis energy circuit that reduces oxidative stress and contributes to ATP production by maintaining production of NAD+ [31,32]. Therefore, in helping to maintain the supply of NAD+ that fuels aerobic glycolysis in ccRCC, H2S indirectly ensures that production of the antioxidant NADPH also remains high, resulting in a high XTT assay output even in mitochondria-deficient cells.
VHL-deficient ccRCC tumours are highly angiogenic as a result of high VEGF secretion that is driven by upregulation of HIF-1/2α [5,50]. VEGF secretion has been shown to be positively correlated with the size, vascularization, stage and Fuhrman grade of ccRCC tumours and has great prognostic value [51]. The efficacy of bevacizumab and various receptor tyrosine kinase inhibitors in the clinical setting speaks to the importance of VEGF-mediated angiogenesis in ccRCC progression both prior to and following metastasis [7]. Multiple sources of evidence suggest that VEGF-mediated angiogenesis is dependent upon tonic inhibition of phosphodiesterase 5 by H2S in endothelial cells [16,27,52,53]. Other mechanisms by which H2S exerts its pro-angiogenic effects have also been suggested [15,52]. CAM-xenograft vascularization assays on ccRCC cell lines performed here support these lines of evidence.
It was found that the attraction of blood vessels towards VHL-deficient ccRCC xenografts could be reduced upon systemic inhibition of endogenous H2S production. However, it could not be determined whether the intravascularly-injected inhibitor was targeting H2S production in endothelial cells or in the cancer cells themselves. The VHL-deficient xenografts were observed to decrease in size following HA treatment which could indicate direct cytotoxicity of the treatment, and suggest that H2S production was being targeted in the tumour. However, the decrease in xenograft size could also have been the effect of being starved of nutrients that aren’t being supplied due to devascularization, which would suggest that treatments failed to reach the tumour are were acting on endothelial cells. Others have shown that chick endothelial cells are susceptible to inhibition of endogenous H2S production within the CAM vasculature [15].
Interestingly, the vascularization of VHL wild-type xenografts was shown to not be susceptible to inhibition of H2S production. These cell lines have been shown to secrete lower levels of VEGF and were, on average, less well vascularized than their VHL-deficient counterparts [39,50]. The VEGF-mediated vascularization of these tumours plays less of a role and this is likely why the inhibitor was not effective. The fact that the inhibitor had no effect on the vascularization of xenografts secreting lower levels of VEGF lends credence to the role of H2S in VEGF-mediated angiogenesis. Of further interest, systemic treatment with LC resulted in noticeable vessel vasodilation, but only when these vessels were in close proximity to VHL-deficient xenografts. This would suggest that the treatments are acting directly on the cancer cells, resulting in changes in tumour-derived H2S that affects the surrounding vasculature through paracrine signalling.
While stage IV mRCC has often been the focus when developing new therapies against ccRCC, (neo)adjuvant therapies for treatment of stage II and stage III ccRCC have not been a priority [54]. Many of these diseases have a high risk of relapsing within 5 years of surgical resection and this contributes heavily to disease mortality [54]. The cellular source of cancer relapse is currently unknown, although there is strong evidence to suggest that cancer stem cells may be responsible for this relapse in ccRCC and other cancers [55]. Recent work has shown that the production of H2S plays a key role in maintaining the stem-like phenotype of cancer cells through induction of stem cell factors OCT4 and NANOG, and through regulation of cellular energy production and oxidative stress [32]. Endogenous H2S production was also associated with the spheroid-forming and transdifferentiation potential of cells, which are thought to be important processes in disease relapse [32]. Treatment with inhibitors of H2S synthesis either before or after nephrectomy might limit the ability of any remaining cancer cells to form new tumours, and this should be investigated further.
In conclusion, it has been shown that inhibition of endogenous H2S production can target multiple aspects of ccRCC disease progression, making it a potentially promising treatment option for mRCC. Depending on the dosage of treatment, the dual CBS/CSE inhibitor preferentially targeted the proliferation, metabolism, and survival of ccRCC cell lines over non-malignant renal epithelial cells in vitro. Furthermore, systemic intravascular injection of the inhibitor was able to decrease the vascularization of ccRCC xenografts without impacting the survival of chick embryos. Some of these effects were observed in both VHL wild-type and VHL-deficient cell lines, and some were observed regardless of VHL status. When translating these findings to the clinical setting, it will be important to identify markers that are more predictive of therapeutic efficacy than VHL-deficiency seems to be [51].
Supplementary Material
Acknowledgments
Our group would like to acknowledge the following sources of funding: Lawson Health Research Institute (Internal Research Fund 0534; Alp Sener), National Institute of Health (Grant ID: R00GM092970; Michael D. Pluth).
Abbreviations
- RCC
renal cell carcinoma
- mRCC
metastatic renal cell carcinoma
- ccRCC
clear cell renal cell carcinoma
- VHL
Von Hippel–Lindau
- HIF
hypoxia-inducible factor
- VEGF
vascular endothelial growth factor
- mTOR
mammalian target of rapamycin
- H2S
hydrogen sulfide
- CSE
cystathionine γ-lyase
- CBS
cystathionine β-synthase
- MPST
3-mercaptopyruvate sulfurtransferase
- ETC
electron transport chain
- SQR
sulfide quinone reductase
- HA
hydroxylamine
- PAG
propargyl glycine
- LC
L-cysteine
- EGFP
extreme green fluorescent protein
- CAM
chorioallantoic membrane
- rhodamine-LCA
rhodamine-conjugated lens culinaris agglutinin
Appendix A
Supplementary data
Supplementary data related to this article can be found at http://dx.doi.org/10.1016/j.niox.2015.06.001.
Footnotes
Conflicts of interest
We disclose no conflicts of interest.
Contributor Information
Eric Sonke, Email: esonke@uwo.ca.
Megan Verrydt, Email: mverrydt@uwo.ca.
Carl O. Postenka, Email: cpostenk@uwo.ca.
Siddika Pardhan, Email: siddika.15@gmail.com.
Chantalle J. Willie, Email: chantalle.willie@gmail.com.
Clarisse R. Mazzola, Email: mazzola_clarisse@hotmail.fr.
Matthew D. Hammers, Email: mhammers@uoregon.edu.
Michael D. Pluth, Email: pluth@uoregon.edu.
Ian Lobb, Email: ilobb@uwo.ca.
Nicholas E. Power, Email: nicholas.power@lhsc.on.ca.
Ann F. Chambers, Email: ann.chambers@lhsc.on.ca.
Hon S. Leong, Email: hon.leong@lhsc.on.ca.
Alp Sener, Email: alp.sener@lhsc.on.ca.
References
- 1.Bhatt JR, Finelli A. Landmarks in the diagnosis and treatment of renal cell carcinoma. Nat Rev Urol. 2014;11:517. doi: 10.1038/nrurol.2014.194. [DOI] [PubMed] [Google Scholar]
- 2.Motzer RJ, Russo P. Systemic therapy for renal cell carcinoma. J Urol. 2000;163:408. [PubMed] [Google Scholar]
- 3.Audenet F, Yates DR, Cancel-Tassin G, et al. Genetic pathways involved in carcinogenesis of clear cell renal cell carcinoma: genomics towards personalized medicine. BJU Int. 2012;109:1864. doi: 10.1111/j.1464-410X.2011.10661.x. [DOI] [PubMed] [Google Scholar]
- 4.van Houwelingen KP, van Dijk BA, Hulsbergen-van de Kaa CA, et al. Prevalence of von Hippel-Lindau gene mutations in sporadic renal cell carcinoma: results from The Netherlands cohort study. BMC Cancer. 2005;5:57. doi: 10.1186/1471-2407-5-57. [DOI] [PMC free article] [PubMed] [Google Scholar]
- 5.Maxwell PH, Wiesener MS, Chang GW, et al. The tumour suppressor protein VHL targets hypoxia-inducible factors for oxygen-dependent proteolysis. Nature. 1999;399:271. doi: 10.1038/20459. [DOI] [PubMed] [Google Scholar]
- 6.Singer EA, Gupta GN, Marchalik D, et al. Evolving therapeutic targets in renal cell carcinoma. Curr Opin Oncol. 2013;25:273. doi: 10.1097/CCO.0b013e32835fc857. [DOI] [PubMed] [Google Scholar]
- 7.Monzon JG, Heng DY. Management of metastatic kidney cancer in the era of personalized medicine. Crit Rev Clin Lab Sci. 2014;51:85. doi: 10.3109/10408363.2013.869544. [DOI] [PubMed] [Google Scholar]
- 8.Nilsson H, Lindgren D, Mandahl Forsberg A, et al. Primary clear cell renal carcinoma cells display minimal mitochondrial respiratory capacity resulting in pronounced sensitivity to glycolytic inhibition by 3-Bromopyruvate. Cell Death Dis. 2015;6:e1585. doi: 10.1038/cddis.2014.545. [DOI] [PMC free article] [PubMed] [Google Scholar]
- 9.Chen X, Qian Y, Wu S. The Warburg effect: evolving interpretations of an established concept, Free Radic. Biol Med. 2015;79C:253. doi: 10.1016/j.freeradbiomed.2014.08.027. [DOI] [PMC free article] [PubMed] [Google Scholar]
- 10.Stipanuk MH, Beck PW. Characterization of the enzymic capacity for cysteine desulphhydration in liver and kidney of the rat. Biochem J. 1982;206:267. doi: 10.1042/bj2060267. [DOI] [PMC free article] [PubMed] [Google Scholar]
- 11.House JD, Brosnan ME, Brosnan JT. Characterization of homocysteine metabolism in the rat kidney. Biochem J. 1997;328(Pt 1):287. doi: 10.1042/bj3280287. [DOI] [PMC free article] [PubMed] [Google Scholar]
- 12.Kamoun P. Endogenous production of hydrogen sulfide in mammals. Amino Acids. 2004;26:243. doi: 10.1007/s00726-004-0072-x. [DOI] [PubMed] [Google Scholar]
- 13.Xia M, Chen L, Muh RW, et al. Production and actions of hydrogen sulfide, a novel gaseous bioactive substance, in the kidneys. J Pharmacol Exp Ther. 2009;329:1056. doi: 10.1124/jpet.108.149963. [DOI] [PMC free article] [PubMed] [Google Scholar]
- 14.Hosoki R, Matsuki N, Kimura H. The possible role of hydrogen sulfide as an endogenous smooth muscle relaxant in synergy with nitric oxide. Biochem Biophys Res Commun. 1997;237:527. doi: 10.1006/bbrc.1997.6878. [DOI] [PubMed] [Google Scholar]
- 15.Szabo C, Papapetropoulos A. Hydrogen sulphide and angiogenesis: mechanisms and applications. Br J Pharmacol. 2011;164:853. doi: 10.1111/j.1476-5381.2010.01191.x. [DOI] [PMC free article] [PubMed] [Google Scholar]
- 16.Papapetropoulos A, Pyriochou A, Altaany Z, et al. Hydrogen sulfide is an endogenous stimulator of angiogenesis. Proc Natl Acad Sci U S A. 2009;106:21972. doi: 10.1073/pnas.0908047106. [DOI] [PMC free article] [PubMed] [Google Scholar]
- 17.Lobb I, Zhu J, Liu W, et al. Hydrogen sulfide treatment ameliorates long-term renal dysfunction resulting from prolonged warm renal ischemia-reperfusion injury. Can Urol Assoc J. 2014;8:E413. doi: 10.5489/cuaj.1694. [DOI] [PMC free article] [PubMed] [Google Scholar]
- 18.Zhang Y, Tang ZH, Ren Z, et al. Hydrogen sulfide, the next potent preventive and therapeutic agent in aging and age-associated diseases. Mol Cell Biol. 2013;33:1104. doi: 10.1128/MCB.01215-12. [DOI] [PMC free article] [PubMed] [Google Scholar]
- 19.Cai WJ, Wang MJ, Ju LH, et al. Hydrogen sulfide induces human colon cancer cell proliferation: role of Akt, ERK and p21. Cell Biol Int. 2010;34:565. doi: 10.1042/CBI20090368. [DOI] [PubMed] [Google Scholar]
- 20.Bouillaud F, Blachier F. Mitochondria and sulfide: a very old story of poisoning, feeding, and signaling? Antioxid Redox Signal. 2011;15:379. doi: 10.1089/ars.2010.3678. [DOI] [PubMed] [Google Scholar]
- 21.Fu M, Zhang W, Wu L, et al. Hydrogen sulfide (H2S) metabolism in mitochondria and its regulatory role in energy production. Proc Natl Acad Sci U S A. 2012;109:2943. doi: 10.1073/pnas.1115634109. [DOI] [PMC free article] [PubMed] [Google Scholar]
- 22.Goubern M, Andriamihaja M, Nubel T, et al. Sulfide, the first inorganic substrate for human cells. FASEB J. 2007;21:1699. doi: 10.1096/fj.06-7407com. [DOI] [PubMed] [Google Scholar]
- 23.Lagoutte E, Mimoun S, Andriamihaja M, et al. Oxidation of hydrogen sulfide remains a priority in mammalian cells and causes reverse electron transfer in colonocytes. Biochim Biophys Acta. 2010;1797:1500. doi: 10.1016/j.bbabio.2010.04.004. [DOI] [PubMed] [Google Scholar]
- 24.Olson KR. Hydrogen sulfide as an oxygen sensor. Clin Chem Lab Med. 2013;51:623. doi: 10.1515/cclm-2012-0551. [DOI] [PubMed] [Google Scholar]
- 25.Mustafa AK, Gadalla MM, Sen N, et al. H2S signals through protein S-sulfhydration. Sci Signal. 2009;2:ra72. doi: 10.1126/scisignal.2000464. [DOI] [PMC free article] [PubMed] [Google Scholar]
- 26.Sen N, Paul BD, Gadalla MM, et al. Hydrogen sulfide-linked sulfhydration of NF-kappaB mediates its antiapoptotic actions. Mol Cell. 2012;45:13. doi: 10.1016/j.molcel.2011.10.021. [DOI] [PMC free article] [PubMed] [Google Scholar]
- 27.Coletta C, Papapetropoulos A, Erdelyi K, et al. Hydrogen sulfide and nitric oxide are mutually dependent in the regulation of angiogenesis and endothelium-dependent vasorelaxation. Proc Natl Acad Sci U S A. 2012;109:9161. doi: 10.1073/pnas.1202916109. [DOI] [PMC free article] [PubMed] [Google Scholar]
- 28.Szabo C, Coletta C, Chao C, et al. Tumor-derived hydrogen sulfide, produced by cystathionine-beta-synthase, stimulates bioenergetics, cell proliferation, and angiogenesis in colon cancer. Proc Natl Acad Sci U S A. 2013;110:12474. doi: 10.1073/pnas.1306241110. [DOI] [PMC free article] [PubMed] [Google Scholar]
- 29.Bhattacharyya S, Saha S, Giri K, et al. Cystathionine beta-synthase (CBS) contributes to advanced ovarian cancer progression and drug resistance. PLoS One. 2013;8:e79167. doi: 10.1371/journal.pone.0079167. [DOI] [PMC free article] [PubMed] [Google Scholar]
- 30.Zhang J, Xie Y, Xu Y, et al. Hydrogen sulfide contributes to hypoxia-induced radioresistance on hepatoma cells. J Radiat Res. 2011;52:622. doi: 10.1269/jrr.11004. [DOI] [PubMed] [Google Scholar]
- 31.Sanokawa-Akakura R, Ostrakhovitch EA, Akakura S, et al. A H2S-Nampt dependent energetic circuit is critical to survival and cytoprotection from damage in cancer cells. PLoS One. 2014;9:e108537. doi: 10.1371/journal.pone.0108537. [DOI] [PMC free article] [PubMed] [Google Scholar]
- 32.Ostrakhovitch EA, Akakura S, Sanokawa-Akakura R, et al. Dedifferentiation of cancer cells following recovery from a potentially lethal damage is mediated by H2S-Nampt. Exp Cell Res. 2015;330:135. doi: 10.1016/j.yexcr.2014.09.027. [DOI] [PubMed] [Google Scholar]
- 33.Takano N, Peng YJ, Kumar GK, et al. Hypoxia-inducible factors regulate human and rat cystathionine beta-synthase gene expression. Biochem J. 2014;458:203. doi: 10.1042/BJ20131350. [DOI] [PMC free article] [PubMed] [Google Scholar]
- 34.Fergelot P, Bernhard JC, Soulet F, et al. The experimental renal cell carcinoma model in the chick embryo. Angiogenesis. 2013;16:181. doi: 10.1007/s10456-012-9311-z. [DOI] [PubMed] [Google Scholar]
- 35.Montoya LA, Pluth MD. Selective turn-on fluorescent probes for imaging hydrogen sulfide in living cells. Chem Commun (Camb) 2012;48:4767. doi: 10.1039/c2cc30730h. [DOI] [PMC free article] [PubMed] [Google Scholar]
- 36.Amin A, White RL., Jr High-dose interleukin-2: is it still indicated for melanoma and RCC in an era of targeted therapies? Oncol Willist Park. 2013;27:680. [PubMed] [Google Scholar]
- 37.Zhang H, Gao P, Fukuda R, et al. HIF-1 inhibits mitochondrial biogenesis and cellular respiration in VHL-deficient renal cell carcinoma by repression of C-MYC activity. Cancer Cell. 2007;11:407. doi: 10.1016/j.ccr.2007.04.001. [DOI] [PubMed] [Google Scholar]
- 38.Unwin RD, Craven RA, Harnden P, et al. Proteomic changes in renal cancer and co-ordinate demonstration of both the glycolytic and mitochondrial aspects of the Warburg effect. Proteomics. 2003;3:1620. doi: 10.1002/pmic.200300464. [DOI] [PubMed] [Google Scholar]
- 39.Raval RR, Lau KW, Tran MG, et al. Contrasting properties of hypoxia-inducible factor 1 (HIF-1) and HIF-2 in von Hippel-Lindau-associated renal cell carcinoma. Mol Cell Biol. 2005;25:5675. doi: 10.1128/MCB.25.13.5675-5686.2005. [DOI] [PMC free article] [PubMed] [Google Scholar]
- 40.Gordan JD, Lal P, Dondeti VR, et al. HIF-alpha effects on c-Myc distinguish two subtypes of sporadic VHL-deficient clear cell renal carcinoma. Cancer Cell. 2008;14:435. doi: 10.1016/j.ccr.2008.10.016. [DOI] [PMC free article] [PubMed] [Google Scholar]
- 41.Dalgliesh GL, Furge K, Greenman C, et al. Systematic sequencing of renal carcinoma reveals inactivation of histone modifying genes. Nature. 2010;463:360. doi: 10.1038/nature08672. [DOI] [PMC free article] [PubMed] [Google Scholar]
- 42.Oosterwijk E, Rathmell WK, Junker K, et al. Basic research in kidney cancer. Eur Urol. 2011;60:622. doi: 10.1016/j.eururo.2011.06.048. [DOI] [PMC free article] [PubMed] [Google Scholar]
- 43.Baldewijns MM, van Vlodrop IJ, Vermeulen PB, et al. VHL and HIF signalling in renal cell carcinogenesis. J Pathol. 2010;221:125. doi: 10.1002/path.2689. [DOI] [PubMed] [Google Scholar]
- 44.Wu B, Teng H, Yang G, et al. Hydrogen sulfide inhibits the translational expression of hypoxia-inducible factor-1alpha. Br J Pharmacol. 2012;167:1492. doi: 10.1111/j.1476-5381.2012.02113.x. [DOI] [PMC free article] [PubMed] [Google Scholar]
- 45.Kai S, Tanaka T, Daijo H, et al. Hydrogen sulfide inhibits hypoxia- but not anoxia-induced hypoxia-inducible factor 1 activation in a von hippel-lindau- and mitochondria-dependent manner. Antioxid Redox Signal. 2012;16:203. doi: 10.1089/ars.2011.3882. [DOI] [PMC free article] [PubMed] [Google Scholar]
- 46.Chen H, Shi H. A reducing environment stabilizes HIF-2alpha in SH-SY5Y cells under hypoxic conditions. FEBS Lett. 2008;582:3899. doi: 10.1016/j.febslet.2008.10.031. [DOI] [PMC free article] [PubMed] [Google Scholar]
- 47.Deplancke B, Gaskins HR. Hydrogen sulfide induces serum-independent cell cycle entry in nontransformed rat intestinal epithelial cells. FASEB J. 2003;17:1310. doi: 10.1096/fj.02-0883fje. [DOI] [PubMed] [Google Scholar]
- 48.Navas P, Villalba JM, de Cabo R. The importance of plasma membrane coenzyme Q in aging and stress responses. Mitochondrion. 2007;7(Suppl. S34) doi: 10.1016/j.mito.2007.02.010. [DOI] [PubMed] [Google Scholar]
- 49.Akakura S, Ostrakhovitch E, Sanokawa-Akakura R, et al. Cancer cells recovering from damage exhibit mitochondrial restructuring and increased aerobic glycolysis. Biochem Biophys Res Commun. 2014;448:461. doi: 10.1016/j.bbrc.2014.04.138. [DOI] [PubMed] [Google Scholar]
- 50.Shinojima T, Oya M, Takayanagi A, et al. Renal cancer cells lacking hypoxia inducible factor (HIF)-1alpha expression maintain vascular endothelial growth factor expression through HIF-2alpha. Carcinogenesis. 2007;28:529. doi: 10.1093/carcin/bgl143. [DOI] [PubMed] [Google Scholar]
- 51.Sun M, Shariat SF, Cheng C, et al. Prognostic factors and predictive models in renal cell carcinoma: a contemporary review. Eur Urol. 2011;60:644. doi: 10.1016/j.eururo.2011.06.041. [DOI] [PubMed] [Google Scholar]
- 52.Bibli SI, Yang G, Zhou Z, et al. Role of cGMP in hydrogen sulfide signaling. Nitric Oxide. 2015;46:7. doi: 10.1016/j.niox.2014.12.004. [DOI] [PubMed] [Google Scholar]
- 53.Cai WJ, Wang MJ, Moore PK, et al. The novel proangiogenic effect of hydrogen sulfide is dependent on Akt phosphorylation. Cardiovasc Res. 2007;76:29. doi: 10.1016/j.cardiores.2007.05.026. [DOI] [PubMed] [Google Scholar]
- 54.Janowitz T, Welsh SJ, Zaki K, et al. Adjuvant therapy in renal cell carcinoma-past, present, and future. Semin Oncol. 2013;40:482. doi: 10.1053/j.seminoncol.2013.05.004. [DOI] [PMC free article] [PubMed] [Google Scholar]
- 55.Matak D, Szymanski L, Szczylik C, et al. Biology of renal tumour cancer stem cells applied in medicine. Contemp Oncol Pozn. 2015;19:A44. doi: 10.5114/wo.2014.47128. [DOI] [PMC free article] [PubMed] [Google Scholar]
Associated Data
This section collects any data citations, data availability statements, or supplementary materials included in this article.