

Aim(s)
Little is known about the pharmacokinetic (PK) properties of gentamicin in newborns undergoing controlled hypothermia after suffering from hypoxic−ischaemic encephalopathy due to perinatal asphyxia. This study prospectively evaluates and describes the population PK of gentamicin in these patients.
Methods
Demographic, clinical and laboratory data of patients included in a multicentre prospective observational cohort study (the ‘PharmaCool Study’) were collected. A non‐linear mixed‐effects regression analysis (nonmem ®) was performed to describe the population PK of gentamicin. The most optimal dosing regimen was evaluated based on simulations of the final model.
Results
A total of 47 patients receiving gentamicin were included in the analysis. The PK were best described by an allometric two compartment model with gestational age (GA) as a covariate on clearance (CL). During hypothermia the CL of a typical patient (3 kg, GA 40 weeks, 2 days post‐natal age (PNA)) was 0.06 l kg−1 h−1 (inter‐individual variability (IIV) 26.6%) and volume of distribution of the central compartment (V c) was 0.46 l kg−1 (IIV 40.8%). CL was constant during hypothermia and rewarming, but increased by 29% after reaching normothermia (>96 h PNA).
Conclusions
This study describes the PK of gentamicin in neonates undergoing controlled hypothermia. The 29% higher CL in the normothermic phase compared with the preceding phases suggests a delay in normalization of CL after rewarming has occurred. Based on simulations we recommend an empiric dose of 5 mg kg−1 every 36 h or every 24 h for patients with GA 36–40 weeks and GA 42 weeks, respectively.
What is Already Known about this Subject
Little is known of the pharmacokinetic (PK) properties of gentamicin in neonates receiving controlled hypothermia. Only a few retrospective studies have been performed to evaluate these properties. For example, conflicting data exist with regard to the changes in clearance (CL) of gentamicin in this population.
What this Study Adds
A description of the PK properties of gentamicin in this patient population based on prospectively gathered data was obtained.
We found a 29% higher CL during normothermia compared with the hypothermic and rewarming periods.
We suggest a new dosing regimen with which adequate peak and trough levels will be acquired.
Introduction
Since 2008 controlled hypothermia is the standard of care in The Netherlands for term newborns suffering from hypoxic−ischaemic encephalopathy (HIE) due to perinatal asphyxia. Approximately 170 asphyxiated term infants are admitted annually to one of the 10 Dutch Neonatal Intensive Care Units (NICU) for this treatment 1. The aminoglycoside gentamicin is frequently prescribed in neonates with unexplained perinatal asphyxia as infection cannot reliably be ruled out. However, it is largely unknown whether hypothermia affects its pharmacokinetic (PK) properties. Although a meta‐analysis of several randomized controlled trials studying the therapeutic effect of controlled hypothermia in comparison with standard NICU care showed no statistically significant difference in the incidence of renal impairment 2, animal studies demonstrated that systemic mild hypothermia may reduce the glomerular filtration rate (GFR) in the immature kidney 3. Consequently, gentamicin clearance (Cl) could be impaired by hypothermia as this drug is mainly eliminated by glomerular filtration. This can possibly result in aminoglycoside toxicity 4.
In humans, only few studies have investigated the PK characteristics of gentamicin in hypothermic neonates. Liu et al. 5 reported no difference in the trough gentamicin concentrations between cooled and normothermic neonates suffering HIE. Two other studies 6, 7, however, found a reduced CL of gentamicin when comparing gentamicin concentrations of cooled asphyxiated newborns with either historical normothermic controls or previously reported values in non‐asphyxiated normothermic term neonates.
The weaknesses of these three human studies are their retrospective design, the fact that they studied merely trough or peak concentrations of gentamicin, and that they only evaluated the hypothermic phase of controlled hypothermia without taking into account the dynamic changes in PK characteristics of gentamicin during rewarming.
The present study is the first prospectively designed observational cohort study in neonates treated with controlled hypothermia for HIE aiming to evaluate and describe the population PK of gentamicin. Based on the derived PK properties rational gentamicin dosing regimens reaching adequate peak and trough plasma concentrations are designed for this population.
Methods
Patients
The ‘PharmaCool Study’ 8 is a multicentre prospective observational cohort study conducted in 10 Dutch and two Belgian NICUs between November 2010 and October 2014. All NICUs had extensive clinical experience in the treatment of asphyxiated newborns with controlled hypothermia. The study was designed to evaluate the effects of hypothermia on the PK properties of analgesic, antiepileptic, sedative and antibiotic drugs.
Term newborns (>37 weeks gestational age (GA)) fulfilling the criteria of perinatal asphyxia were cooled within 6 h after birth to a core body temperature of 33.5°C for 72 h according to national protocol 8. Thereafter the infants were rewarmed to normothermia (36.5°C) over a time period of 8 h. All newborns undergoing controlled hypothermia were deemed eligible for inclusion. Exclusion criteria were the presence of congenital hepatic or renal pathology, no central venous or arterial line in situ for non‐invasive blood sampling procedures or no parental informed consent.
The study protocol was approved by the Institutional Review Board of each participating centre.
Data and sample collection
The following demographic, clinical, and laboratory data were collected: GA, birth weight (BW), gender, cause of the perinatal asphyxia, extent and duration of invasive resuscitation, need for ventilator and/or inotropic support, Thompson score at the start of cooling, use of co‐medication, daily urine output, serum creatinine, urea, aspartate aminotransferase (ASAT) and alanine aminotransferase (ALAT). Gentamicin was prescribed as 4 mg kg−1 once daily according to the Dutch Paediatric Formulary 9 with dosage adjustments based on therapeutic drug monitoring (TDM). The date, dose, start and end time of infusion and all sampling times were recorded in the case report form (CRF). As most infants were outborn in peripheral hospitals the timing and amount of the initial gentamicin dose were largely unknown.
Although the timing of the daily dosing regimen could vary between individuals, blood samples (0.2 ml) for PK analysis of gentamicin were collected at fixed time points after birth: day 2 (hypothermia) 07.30, 09.00, 11.00, 13.00, 15.00 and 19.00 h, day 3 (hypothermia) 07.00, 13.00 and 19.00 h and day 5 (normothermia) 07.30, 09.00, 11.00, 13.00, 15.00 and 19.00 h.
The gentamicin concentration was analyzed in the PK samples as previously described 10. In short, ion‐pair reversed phase chromatography coupled with electrospray ionization tandem mass spectrometry was used to quantify the sum of the major gentamicin components (gentamicin C, C1a, and C2) with a concentration range of 1.0–100 mg l−1. At the lowest limit of quantitation (LLOQ) accuracy was 119% and imprecision was less than 19%. The accuracies of the middle level of quantification (MLQ) and upper limit of quantification (ULOQ) were 98% and 99%, respectively. Imprecision at these levels was <4.5% and <5.5%, respectively. Only 25 μl of plasma was needed for analysis.
Pharmacokinetic modelling
Data were analyzed using the first order conditional estimation (FOCE) method with interaction option in the non‐linear mixed‐effects modelling software nonmem version 7.2 (Globomax LLC, Hanover, MD, USA). Tools like R (https://www.r‐project.org/, open‐source, S‐based statistical software, version 0.98.945), XPose 11, and PsN 12 were used to visualize and evaluate the models. The model building process was performed in a stepwise fashion.
Structural model
The concentration data were log‐transformed and one, two and three compartment models were fitted to the data. PK parameters were estimated as CL, volume of distribution of the central and peripheral compartment (V c and V p, respectively), and inter‐compartmental clearance (Q). For all parameters inter‐individual variability (IIV) and covariance were tested assuming a log‐normal distribution 13. To account for variability in PK parameters due to the varying sizes of individual children BW was included in all model parameters using an allometric power model in which the parameter values were standardized to a body weight of 70 kg:
| (equation 1) |
where θ1 is the typical value of the parameter P and PWR is the allometric scaling parameter, which was fixed at values of 0.75 and 1.0 for CL and V, respectively 14. However, PWR was also estimated to evaluate if this would result in a better fit. Residual variability was estimated using additive and proportional error models. To account for the lacking data on the initial gentamicin dose a standard dose of 4 mg kg−1 with variable bioavailability was assumed to extrapolate the pre‐study time profile concentrations. The likelihood ratio test was used to evaluate statistical significance between nested models where a reduction in the OFV ≥ 3.9 points was considered as statistically significant (P < 0.05 based on χ2 distribution, d.f. = 1). Also, goodness‐of‐fit (GOF) plots (population or individual predictions vs. observations, individual conditional weighted residuals (CWRES) vs. individual predictions and CREWS vs. time), the total number of parameters, visual improvement of individual plots, correlation matrix, confidence intervals of parameter estimates, ill‐conditioning, and η‐ and ε‐shrinkage were assessed 13, 15. The ill‐conditioning was assessed by the ratio of the largest and smallest eigenvalue of the covariance matrix of the estimate from the nonmem output. A ratio > 1000 indicates ill‐conditioning of the model and is often due to over‐parameterization.
Covariate model
Continuous covariates were tested separately in the model, using a power function equation:
| (equation 2) |
where θ1 is the typical value of the parameter P in a patient with the median covariate value (COV) and θ2 is the fractional change in P with each unit of deviation from the median COV. Continuous covariates tested were post‐natal age (PNA), post‐menstrual age (PMA), GA, body temperature, ASAT, ALAT, serum creatinine, urea, and daily urine output. PMA was calculated by adding GA (in days) to PNA (in days). Categorical covariates were implemented in the model according to the following equation:
| (equation 3) |
where θ1 is the typical value of the parameter P and θ2 is the fractional difference in P between categories. For categorical dichotomous data (gender, cooling: on/off, multi‐organ failure (MOF): yes/no and inotropic co‐medication: yes/no) the value of the covariate was set to 0 for the reference classification and 1 for the other classification. MOF was considered to be present if a patient had renal‐ or liver function failure, which were defined as described by Shah et al. 16
Also, CL per study day was assessed by:
| (equation 4) |
where θ1 is the typical value of CL at study day (SD) 1 (0–24 h PNA) and θ2, θ3 and θ4 are the fractional differences in CL per study days SD2 (24–48 h PNA), SD3 (48–72 h PNA), SD4 (72–96 h PNA) and SD5 (>96 h PNA), respectively.
As the study subjects were newborns with a continuous development of organ function in time, maturation models were applied to evaluate the effect of maturation on the parameter estimates. Sigmoid Emax functions and sigmoid hyperbolic functions, an extension to the sigmoid Emax model that allows it to take an asymmetric shape, were tested 17, 18.
In a stepwise fashion the significance of covariates was tested 13. In the forward inclusion a P value of <0.05 was applied (a decrease in the objective function value (OFV) of at least 3.8 points for one degree of freedom), while a more stringent P value of <0.001 was used in the backward deletion (a decrease in the OFV of at least 10.83 points for one degree of freedom).
Model evaluation and simulation
To evaluate parameter precision and model stability a non‐stratified non‐parametric bootstrap analysis was performed using the PsN Toolkit 12 in which the model‐building dataset was resampled a 1000 times to produce a new dataset the size of the original but with a different combination of individuals. The parameter estimates obtained with the bootstrap (median values and 95% CI) were compared to the parameter estimates of the final PK model.
The normalized prediction distribution error (NPDE) method was used to evaluate the predictive properties of the model. To do so, the dataset was simulated 2000 times in nonmem using Monte‐Carlo simulations in which the random effects were included. If the model adequately describes the simulated data, the NPDE is expected to follow a N(0,1) distribution. A histogram and QQ plot of the NPDE distribution and NPDE vs. individual predicted concentrations and vs. time were used to evaluate the final model 19.
To examine the most optimal dosing regimen during controlled hypothermia Monte Carlo simulations (n = 5000) using the final model were performed in nonmem on a selection of patients from the original database with varying GA and BW in which different dosage regimens (i.e. 4 or 5 mg kg−1 every 24, 36 or 48 h for a 7 day period) were evaluated. The median concentration in mg l−1 with interquartile range (IQR) of the trough and peak concentrations were computed. Trough concentrations of <1 mg l−1 and peak concentrations of 8–10 mg l−1 were chosen as reference values and based on the results the best dosing regimen was selected 20, 21. Then, the median and the 5th and 95th percentiles of the simulated concentrations (n = 1000, samples drawn every hour) of this regimen were computed for graphical display.
Results
Patients
In total 194 newborns were included in the multicentre PharmaCool Study 8. Completed data were available for 183 subjects. Data of 11 patients were not complete and could therefore not be evaluated. Of these 183 cases a total of 47 patients receiving gentamicin during controlled hypothermia were included in the current analysis. A summary of demographic and clinical characteristics is presented in Table 1. The median daily gentamicin dose was 13.3 (range 9.0–20.3) mg (i.e. 4.0 (range 3.5–5.1) mg kg−1). Thirty‐three patients (70%) received a median dose of 4.0 (range 3.6–4.1) mg kg−1 24 h–1, eight patients (17%) received a median dose of 4.0 (range 3.8–4.6) mg kg−1 36 h–1, three patients (6%) received a dose of 4.0 mg kg−1 48 h–1, one patient (2%) received a dose of 5.1 mg kg−1 36 h–1 and two patients (4%) received a dose of 4.9 and 5.0 mg kg−1, respectively, 48 h–1. Furthermore, 19% of the patients received gentamicin therapy for more than 3 days. A total number of 612 blood samples were available for analysis. The median number of blood samples taken per patient was 14 (range 4–16) in total, nine (range 3–9) during hypothermia and six (range 0–6) during normothermia. For seven patients samples during rewarming were available as residual material of other laboratory monitoring and could be analyzed. The observed concentrations vs. the time after dose are presented in Figure 1.
Table 1.
Demographics: data are presented as median (minimum–maximum) unless stated otherwise
| Parameter | Gentamicin population (n = 47) | Total population (n = 183) |
|---|---|---|
| GA (weeks) † | 40 (36–42) | 40 (36–42) |
| BW (g) † | 3400 (2090–5070) | 3400 (2090–5070) |
| Male | 27 (58.7%)* | 112 (61.2%)* |
| PNA § | 4.7 (2.3–5.2) | 4.7 (1.9–5.0) |
| SCr (μmol l – 1 ) ‡ | 49 (26–114) | 53 (9–295) |
| ASAT ( U l – 1 ) ‡ | 58 (19–9179) | 80 (19–9179) |
| ALAT ( U l – 1 ) ‡ | 23 (3–2631) | 36 (3–2631) |
| MOF ‡ | 19 (40.4%)* | 101 (55.2%)* |
| Inotropic medication ‡ | 30 (63.8%)* | 111 (60.7)* |
| Thompson score † | 9 (3–19) | 9 (3–19) |
Data presented as n (%).
Parameter measured at admittance.
Parameter measured throughout study period.
Parameter measured at end of study period.
GA, gestational age; MOF, multi organ failure; SCr, serum creatinine; BW, birth weight.
Figure 1.
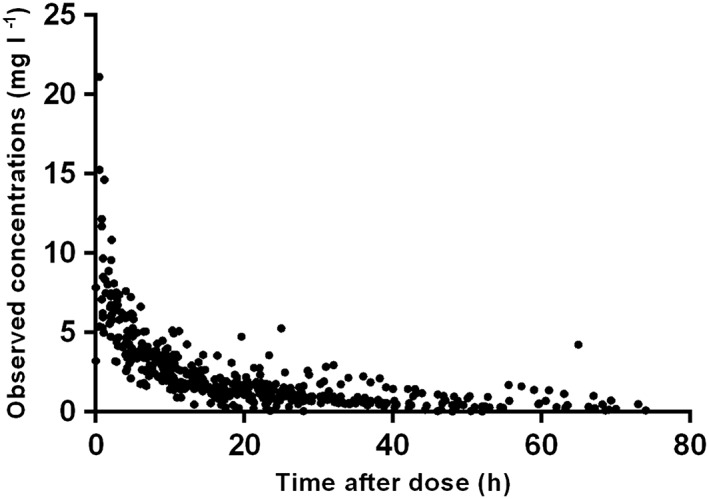
Observed gentamicin concentrations (mg l–1) vs. the time after dose (hours) plot
Pharmacokinetic model building
A two compartment model parameterized in terms of CL, V c, V p, and Q was preferred to a one and three compartment model. Parameters were normalized for a body weight of 70 kg using fixed exponents according to the ¾ rule 14. Residual variability of the log‐transformed data was described with an additive error model. IIV could be estimated for CL, V c and V p. Variability between CL and V c was correlated (r = 0.81). To account for the lacking data on the initial gentamicin dose a standard dose of 4 mg kg−1 with variable bioavailability was assumed to extrapolate the pre‐study time profile concentrations. The bioavailability of the first virtual standard dose of 4 mg kg−1 was 142% with an IIV of 75.4%. The structural two compartment model had an OFV of −811. The parameters of the structural model are shown in Table 2.
Table 2.
Parameter estimation of structural and final pharmacokinetic models, with final model associated bootstraps
| Structural model | Final model | Final bootstrap (n = 1000 samples) | |||||
|---|---|---|---|---|---|---|---|
| Parameters | Estimates | CV (%) | Estimates | CV (%) | Estimates † | CI (2.5%) | CI (97.5%) |
| OFV | −811 | ‐ | −844 | ‐ | |||
| CL (l h −1 /70 kg) | 1.86 | 4 | 1.89 | 4.5 | 1.87 | 1.74 | 2.05 |
| θ CLGA | ‐ | ‐ | 3.00 | 16 | 3.00 | 1.78 | 4.76 |
| θ SD5 | ‐ | ‐ | 1.29 | 12 | 1.30 | 0.99 | 1.67 |
| V c (l/70 kg) | 31.8 | 9 | 32.5 | 10 | 32.0 | 26.6 | 38.1 |
| Q ( l h −1 /70 kg) | 2.16 | 12 | 2.01 | 12 | 2.03 | 1.52 | 2.53 |
| V p (l/70 kg) | 28.6 | 8 | 30.3 | 9 | 30.3 | 24. 9 | 37.3 |
| Additive error | 0.15 | 9 | 0.15 | 9 | 0.15 | 0.13 | 0.18 |
| IIV CL (%) | 30.1 | 13 | 26.6 | 15 | 25.7 | 16.8 | 34.2 |
| IIV V c (%) | 37.7 | 22 | 40.8 | 22 | 40.6 | 21.9 | 59.3 |
| IIV V p (%) | 52.3 | 19 | 53.3 | 23 | 50.5 | 26.8 | 95.7 |
| IIV additive residual error (%) | 53.4 | 16 | 50.2 | 15 | 48.7 | 27.3 | 67.1 |
Final model:
TVCL = CL x (BW/70)0.75 x θSD5 x (GA/GAmedian)θCLGA
TVVc =Vc x (BW/70)1
TVQ = Q x (BW/70)0.75
TVVp =Vp x (BW/70)1
Median estimates. OFV objective function value; CL clearance; θCLGA fractional change in CL with each unit of deviation from the median GA; θSD5 fractional increase in CL from study day 5 on; CV coefficient of variation; CI confidence interval; V c volume of distribution of the central compartment; Q inter‐compartmental clearance; V p volume of distribution of the peripheral compartment; IIV inter‐individual variability; TV typical value; SD5 study day 5 (>96 h post‐natal age)
In the covariate analysis GA and PMA were identified as significant covariates on CL, causing a drop in OFV of 17.1 and 19.3 points, respectively. As PMA is the sum of GA and PNA, and as GA gave the highest drop in OFV compared with PNA, GA was considered the most influential variable and was therefore implemented as a covariate on CL using a power function (P < 0.001). No relationship between CL and the following patient parameters was detected: BW, PNA, gender, body temperature, cooling on/off, inotropic co‐medication, ASAT, ALAT, serum creatinine, urea, daily urine output and MOF. Maturation models as covariates on CL did not improve the PK model. Furthermore, estimation of the allometric exponents of CL and V did not result in a better fit. For V c and V p no significant covariate‐parameter relationship was identified.
Interestingly, when CL was assessed per study day it was unchanged during study days 1, 2, 3 and 4, whereas it increased with 44% from study day 5 on. Applying this effect in the model caused a drop in the OFV of 25.8 points (P < 0.001, d.f. = 4). For reasons of parsimony, the model was then parameterized in terms of CL before or at study day 5 by defining a categorical covariate which equals 1 at study day 5 and 0 before study day 5. The time dependency of CL resulted in a drop in OFV of 14.1 points compared with the structural model. CL at study day 5 was 29% higher than CL before study day 5 (P < 0.001). The period from study day 5 on (>96 h PNA) reflects the period after rewarming has ended and thus normothermia has been reached. Combined inclusion of the covariates GA and study day 5 on CL gave a drop in OFV of 32.0 points compared with the structural model.
The η and ε shrinkage were <20% rendering the EBE‐based diagnostics useful for model evaluation 11. An individual concentration vs. time curve using POSTHOC PK values is presented in Figure 2.
Figure 2.
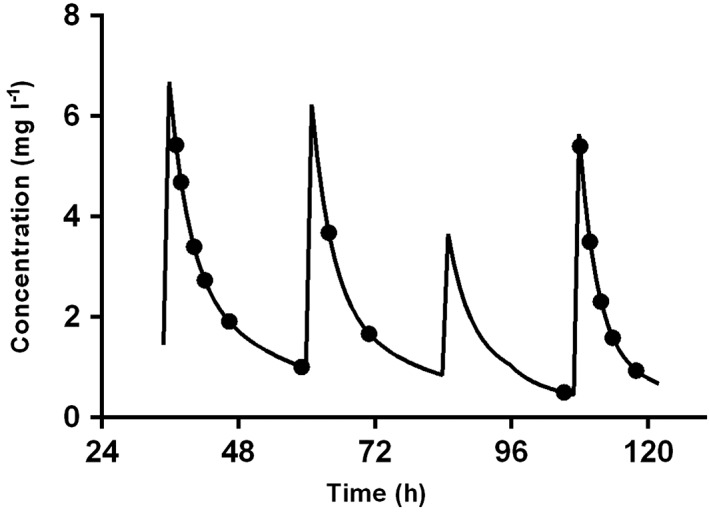
Concentration gentamicin (mg l–1) vs. time (h) plot of a patient (male, GA 41 weeks, and BW 3790 g) included in the PharmaCool Study. The black dots represent the measured concentrations of gentamicin. The black line represents the individual concentration–time curve derived from post hoc PK values. The periods from 0–72 h, 72–96 h and >96 h reflect the hypothermic, the rewarming and the normothermic phase, respectively
Model validation and simulation
Table 2 gives a summary of the parameter estimates of the structural and final model, and the values of the bootstrap analysis of the final model. As the latter was in agreement with those of the final population PK model, the final model estimates are considered reliable. The diagnostic plots are shown in Figure 3 and indicate that the final model describes the observed data well. The observed concentrations vs. population‐predicted concentrations (including IIV) and vs. the individual‐predicted concentrations show that the data are evenly distributed around the line of identity indicating that no major bias in the population component of the final model exists and that an appropriate structural model is found for most individuals. Furthermore, in the CWRES vs. time after dose plot the data are evenly distributed around zero with most values between ± 2, which means there is no major bias. No ill‐conditioning was found in the final model as the ratio of the largest and smallest eigenvalue of the covariance matrix of the estimate was 160.
Figure 3.
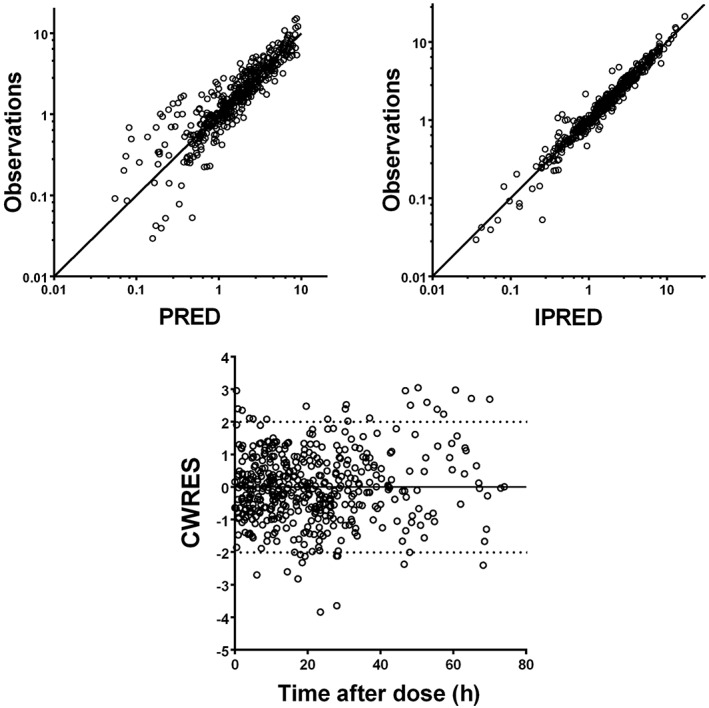
Goodness‐of‐fit plots of observations vs. the population (PRED) and individual predictions (IPRED), and conditional weighted residuals (CWRES) vs. time after dose. The solid line represents the line of identity
In Figure 4 the NPDE plots are shown. The QQ‐plot compares the distribution of the NPDE with a normal N(0,1) distribution. The points are close to the line y = x which suggests the absence of (major) bias. Also, the histogram of the NPDE is shown. From this figure it can also be seen that the NPDE follows the normal distribution, indicating a good fit of the model to the individual data. In the diagnostic plot of NPDE vs. time no apparent trend was observed up to 96 h PNA. However, after 96 h PNA a light trend can be seen wherein the mean of the NPDEs seems negative and significantly different from 0, and the variance significantly different from 1. Notwithstanding, GOF plots for the data >96 h PNA (figures not shown) indicated that the final model did describe the observed >96 h PNA data well. As can be seen from Table 3 in which the results of simulations based on the final model are presented, a dosage regimen of 5 mg kg−1 every 36 h or every 24 h for patients with GA 36–40 weeks and GA 42 weeks, respectively, will result in sufficient trough and peak concentrations for patients during the 5 day period of cooling, rewarming and normothermia. The concentration–time profiles of the recommended dosage regimen are shown in Figure 5.
Figure 4.
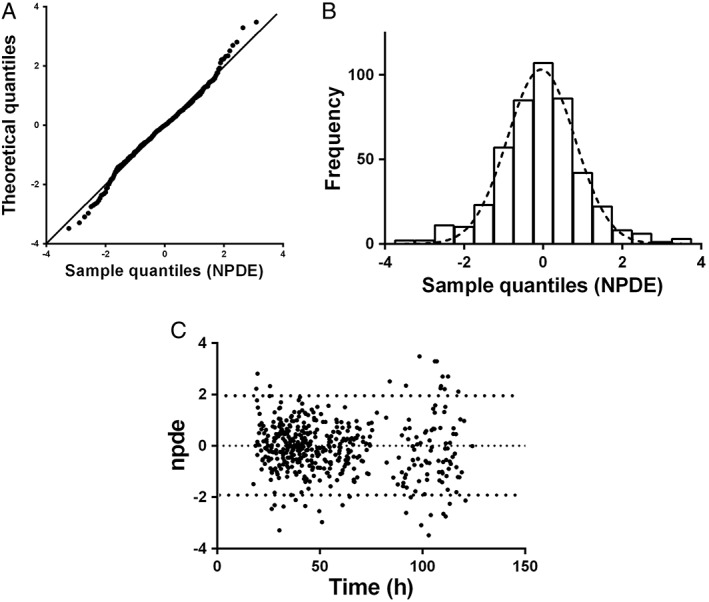
A) QQ‐plot of the metrics based on observations vs. the theoretical N(0,1) distribution. B) histogram of the NPDE distribution with the dashed line representing a normal distribution as a reference. C) NPDE vs. time (h)
Table 3.
Simulated trough and peak gentamicin concentrations based on the final model
| Dosing frequency and dose | |||||||
|---|---|---|---|---|---|---|---|
| 24 h | 36 h | 48 h | |||||
| GA (weeks) | Sample | 4 mg kg−1 | 5 mg kg−1 | 4 mg kg−1 | 5 mg kg−1 | 4 mg kg−1 | 5 mg kg−1 |
| Simulated median (IQR) gentamicin peak and trough concentrations (mg l−1) | |||||||
| 36 | Trough | 1.4 (1.1−1.8)* | 1.6 (1.2−2.1)* | 0.6 (0.4−0.8) | 0.7 (0.5−1.0) | 0.5 (0.2−0.6) | 0.4 (0.2−0.6) |
| Peak | 2.7 (2.1−3.5)* | 10.3 (8.2−12.8)* | 7.6 (6.0−9.5)* | 9.5 (7.5−11.9) | 7.5 (5.9−9.2)* | 9.3 (7.4−11.5) | |
| 38 | Trough | 1.1 (0.9−1.5)* | 1.4 (1.1−1.9)* | 0.5 (0.4−0.7) | 0.6 (0.3−0.8) | 0.3 (0.2−0.4) | 0.3 (0.1−0.5) |
| Peak | 8.2 (6.5−10.2) | 10.2 (8.1−12.7)* | 7.6 (6.0−9.5)* | 9.5 (7.5−11.9) | 7.5 (5.9−9.3)* | 9.3 (7.4−11.6) | |
| 40 | Trough | 0.8 (0.6−1.1) | 1.0 (0.7−1.4)* | 0.3 (0.2−0.5) | 0.4 (0.2−0.6) | 0.2 (0.1−0.3) | 0.2 (0.1−0.3) |
| Peak | 7.9 (6.2−9.8)* | 9.8 (7.8−12.2) | 7.4 (5.9−9.3)* | 9.2 (7.3−11.6) | 7.3 (5.8−9.1)* | 9.1 (7.2−11.3) | |
| 42 | Trough | 0.6 (0.39−0.84) | 0.7 (0.5−1.1) | 0.2 (0.1−0.4) | 0.3 (0.1−0.4) | 0.1 (0.0−0.2) | 0.1 (0.0−0.2) |
| Peak | 7.5 (6.0−9.3)* | 9.4 (7.5−11.7) | 7.2 (5.7−9.0)* | 8.9 (7.1−11.2) | 7.1 (5.6−8.8)* | 8.9 (7.0−11.0) | |
Median simulated gentamicin concentrations outside the reference range.
GA, gestational age; IQR, interquartile range.
Figure 5.
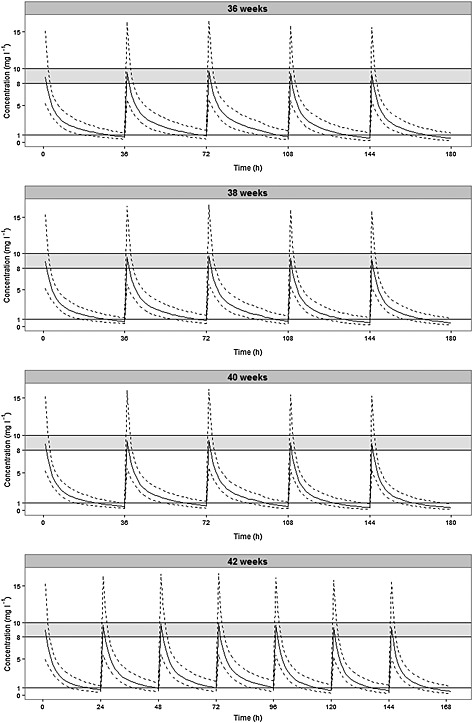
Model‐based predicted median gentamicin concentration–time profiles (solid line) and the 5th and 95th percentile intervals (dashed lines) for four patients with varying gestational ages and body weights receiving 5 mg kg−1 gentamicin every 36 h (GA < 42 weeks) or every 24 hours (GA 42 weeks). The shaded area represents the target concentration interval for the peak level (8–10 mg l−1) and the solid line at 1 mg l−1 depicts the maximum concentration allowed for the trough level. The periods from 0–72 h, 72–96 h and >96 h reflect the hypothermic, the rewarming and the normothermic phase, respectively
Discussion
To our knowledge this is the first and largest prospective study evaluating the PK characteristics of gentamicin in asphyxiated term infants with HIE undergoing controlled hypothermia.
The PK properties of gentamicin were best described by a two compartment model with GA and BW being primary factors of influence on CL. Both are known mediators of GFR maturation and drug clearance 22, 23. Notably, we found that the CL from study day 5 on (>96 h PNA) was 29% higher than the CL at study days 1–4. The period >96 h PNA reflects the period after rewarming has ended and thus normothermia has been reached. For a typical patient of 3 kg, 2 days PNA, and a GA of 40 weeks we found a CL of 0.06 l kg−1 h−1−1 (IIV 26.6%) during hypothermia, which is slightly higher than that found in previously published retrospective studies in the same patient population 6, 7. Mark et al. 6 compared the PK properties of gentamicin in 16 neonates with HIE (median GA 38.4 weeks, BW 2.93 kg) during controlled hypothermia with a historical control group of seven uncooled infants. They concluded that hypothermia reduced gentamicin CL by 25.5% (hypothermia group: 0.04 ± 0.01 l kg−1 h−1, normothermia group 0.05 ± 0.01 l kg−1 h−1). We could not compare our results with a control group prospectively because of evident ethical considerations. Frymoyer et al. 7 found a CL of 0.036 l kg−1 h−1 for a typical patient with a BW of 3.3 kg in their population of 29 hypothermic neonates and concluded that the estimate of CL was 25–50% lower than previously reported in non‐asphyxiated normothermic neonates. On the other hand, Liu et al. 5 reported that reduced body temperature did not affect the CL of gentamicin as they did not find differences between the trough gentamicin concentrations of hypothermic and normothermic patients. However, they did not report on peak concentrations or PK parameters of gentamicin. These three studies conducted in hypothermic neonates were of retrospective design and did not include as many patients as our trial. Furthermore, in the referred studies, only trough or peak samples were evaluated whereas in our study the whole PK profile of gentamicin was described using multiple serial samples collected during all phases of controlled hypothermia, i.e. hypothermic, rewarming and normothermic phase.
Although others found that PNA was a covariate on gentamicin CL in preterm and term neonates of varying GA and PNA 24, 25, 26, our study could not confirm this in our specific patient group. We found that CL at study days 1, 2, 3 and 4 remained constant. As PNA (as a continuous covariate) nor the maturation models tested were found to be covariates, the subsequent rise found in CL from study day 5 on (>96 h PNA) cannot be attributed to maturation of kidney function. Fuchs et al. 24 studied the population PK properties of gentamicin in a cohort of premature and term neonates not receiving controlled hypothermia. They showed that CL increased per day PNA. As such an increase was not seen in our study during the first 96 h PNA it is likely that CL is affected by hypothermia, although a direct effect of body temperature was not found to be a covariate on CL. These findings suggest that there is a delay in kidney function maturation with respect to gentamicin CL after controlled hypothermia has been discontinued.
In our patient population the V c was found to be 0.46 l kg–1 (IIV 40.8%) for a typical patient of 3 kg and 40 weeks GA. This is comparable with values found in hypothermic and non‐hypothermic neonates 6, 7, 24, 25, 27, 28, 29, 30. Contrary to CL, no changes in time were seen in V c and therefore hypothermia does not seem to influence this PK parameter.
Simulations based on our final model demonstrated that all neonates receiving controlled hypothermia are expected to reach median target peak and trough levels (8–10 mg l−1 and <1 mg l−1, respectively) with an empiric dose of 5 mg kg−1 every 36 h or every 24 h for patients with GA 36–40 weeks and GA 42 weeks, respectively. Dosing gentamicin every 24 h resulted in trough concentrations of >1 mg l−1 for patients with GA < 42 weeks. This was also observed in the study of Liu et al. where at a dose of 4–5 mg kg−1 gentamicin every 24 h 36% of hypothermic and 44% of normothermic neonates had elevated trough concentrations, i.e. >2 mg l−1 5. Also, Mark et al. 6 and Frymoyer et al. 31 found that a dose of 4 and 5 mg kg−1, respectively, every 36 h was needed to achieve adequate trough levels in cooled HIE infants, whilst still attaining adequate peak levels. Our proposed dosing schedule of 5 mg kg−1 every 36 h or every 24 h for patients with GA 36–40 weeks and GA 42 weeks, respectively, during controlled hypothermia is different from the current dosing schedule of the Dutch Paediatric Formulary 9 in which gentamicin is dosed for all newborns as 4 mg kg−1 every 36 h (GA 32–37 weeks) and 4 mg kg–1 every 24 h (GA > 37 weeks). However, we recommend TDM using Bayesian forecasting before the second dose to optimize the dosage as the inter‐patient variability in CL and V c is considerable with values of 26.6% and 40.8%, respectively.
We could not compare our results with a control group. As mentioned earlier, it is not possible to compare prospectively hypothermic HIE patients with non‐hypothermic HIE patients, as controlled hypothermia is the standard of care. Furthermore, comparison with a historic control group will not lead to a better evaluation of the PK properties of gentamicin as the clinical characteristics of these controls are not completely comparable with our cohort of cases due to changed treatment and admission criteria after introduction of the hypothermia protocol.
In conclusion, this study shows that the PK profile of gentamicin in asphyxiated patients treated with controlled hypothermia was best described by a two compartment model with GA and BW as the primary factors of gentamicin CL. CL was 29% higher in the normothermic phase compared with the preceding hypothermic and rewarming phases, suggesting a delay in normalization of CL after rewarming has occurred. Based on simulations we recommend an empiric dose of 5 mg kg−1 every 36 h or every 24 h for patients with GA 36–40 weeks and GA 42 weeks, respectively, followed by TDM using Bayesian forecasting before the second dose in this specific patient population.
Competing Interests
All authors have completed the Unified Competing Interest form at http://www.icmje.org/coi_disclosure.pdf (available on request from the corresponding author) and declare no support from any organization for the submitted work, no financial relationships with any organizations that might have an interest in the submitted work in the previous 3 years and no other relationships or activities that could appear to have influenced the submitted work.
Funding for this study has been received by the Dutch Government (ZonMw Grant number: 40–41 500‐98‐9002). The authors thank Irmgard Corten of the Clinical Research Unit Academic medical Centre (CRU) for her contributions with regard to the data management.
Contributors
Wrote manuscript: Yuma A. Bijleveld, Timo R. de Haan, Ron A.A. Mathot.
Designed research: Yuma A. Bijleveld, Timo R. de Haan, Debbie H.G.M. Nuytemans, Anton H. van Kaam, Ron A.A. Mathot, Hanneke J. H. van der Lee, Floris Groenendaal, Rogier C.J. de Jonge.
Performed research: Timo R. de Haan, Debbie H.G.M. Nuytemans, Anton H. van Kaam, Hanneke J. H. van der Lee, Floris Groenendaal, Peter H. Dijk, Arno van Heijst, Rogier C.J. de Jonge, Koen P. Dijkman, Henrica L.M. van Straaten, Monique Rijken, Inge A. Zonnenberg, Filip Cools, Alexandra Zecic.
Analyzed data: Yuma A. Bijleveld, Timo R. de Haan, Ron A.A. Mathot.
Contributed new reagents/analytical tools: Yuma A. Bijleveld, Timo R. de Haan, Ron A.A. Mathot.
Bijleveld, Y. A. , de Haan, T. R. , van der Lee, H. J. H. , Groenendaal, F. , Dijk, P. H. , van Heijst, A. , de Jonge, R. C. J. , Dijkman, K. P. , van Straaten, H. L. M. , Rijken, M. , Zonnenberg, I. A. , Cools, F. , Zecic, A. , Nuytemans, D. H. G. M. , van Kaam, A. H. , Mathot, R. A. A. , and for the PharmaCool study group (2016) Altered gentamicin pharmacokinetics in term neonates undergoing controlled hypothermia. Br J Clin Pharmacol, 81: 1067–1077. doi: 10.1111/bcp.12883.
References
- 1. Groenendaal F, Casaer A, Dijkman KP, Gavilanes AW, de Haan TR, ter Horst HJ, Laroche S, Naulaers G, Rijken M, van Straaten HL, Steiner K, Swarte RM, Zecic A, Zonnenberg IA. Introduction of hypothermia for neonates with perinatal asphyxia in The Netherlands and Flanders. Neonatology 2013; 104: 15–21. [DOI] [PubMed] [Google Scholar]
- 2. Jacobs SE, Berg M, Hunt R, Tarnow‐Mordi WO, Inder TE, Davis PG. Cooling for newborns with hypoxic ischaemic encephalopathy. Cochrane Database Syst Rev 2013; 1: CD003311. [DOI] [PMC free article] [PubMed] [Google Scholar]
- 3. Guignard JP, Gillieron P. Effect of modest hypothermia on the immature kidney. Acta Paediatr 1997; 86: 1040–1. [DOI] [PubMed] [Google Scholar]
- 4. Smit E, Liu X, Gill H, Sabir H, Jary S, Thoresen M. Factors associated with permanent hearing impairment in infants treated with therapeutic hypothermia. J Pediatr 2013; 163: 995–1000. [DOI] [PubMed] [Google Scholar]
- 5. Liu X, Borooah M, Stone J, Chakkarapani E, Thoresen M. Serum gentamicin concentrations in encephalopathic infants are not affected by therapeutic hypothermia. Pediatrics 2009; 124: 310–5. [DOI] [PubMed] [Google Scholar]
- 6. Mark LF, Solomon A, Northington FJ, Lee CK. Gentamicin pharmacokinetics in neonates undergoing therapeutic hypothermia. Ther Drug Monit 2013; 35: 217–22. [DOI] [PMC free article] [PubMed] [Google Scholar]
- 7. Frymoyer A, Meng L, Bonifacio SL, Verotta D, Guglielmo BJ. Gentamicin pharmacokinetics and dosing in neonates with hypoxic ischemic encephalopathy receiving hypothermia. Pharmacotherapy 2013; 33: 718–26. [DOI] [PMC free article] [PubMed] [Google Scholar]
- 8. de Haan TR, Bijleveld YA, van der Lee JH, Groenendaal F, van den Broek MP, Rademaker CM, van Straaten HL, van Weissenbruch MM, Vermeulen JR, Dijk PH, Dudink J, Rijken M, van HA , Dijkman KP, Gavilanes D, van Kaam AH, Offringa M, Mathot RA. Pharmacokinetics and pharmacodynamics of medication in asphyxiated newborns during controlled hypothermia. The PharmaCool multicenter study. BMC Pediatr 2012; 12: 45. [DOI] [PMC free article] [PubMed] [Google Scholar]
- 9. Stichting Nederlands Kenniscentrum voor Farmacotherapie bij Kinderen (NKFK): Het Kinderformularium; 2015.
- 10. Bijleveld Y, de HT , Toersche J, Jorjani S, van der Lee J, Groenendaal F, Dijk P, van HA , Gavilanes AW, Dijkman KP, van SH , Rijken M, Zonnenberg I, Cools F, Nuytemans D, Mathot R. A simple quantitative method analysing amikacin, gentamicin, and vancomycin levels in human newborn plasma using ion‐pair liquid chromatography/tandem mass spectrometry and its applicability to a clinical study. J Chromatogr B Analyt Technol Biomed Life Sci 2014; 951‐952: 110–8. [DOI] [PubMed] [Google Scholar]
- 11. Jonsson EN, Karlsson MO. Xpose–an S‐PLUS based population pharmacokinetic/pharmacodynamic model building aid for NONMEM. Comput Methods Programs Biomed 1999; 58: 51–64. [DOI] [PubMed] [Google Scholar]
- 12. Lindbom L, Pihlgren P, Jonsson EN. PsN‐toolkit–a collection of computer intensive statistical methods for non‐linear mixed effect modeling using NONMEM. Comput Methods Programs Biomed 2005; 79: 241–57. [DOI] [PubMed] [Google Scholar]
- 13. Mould DR, Upton RN. Basic concepts in population modeling, simulation, and model‐based drug development‐part 2: introduction to pharmacokinetic modeling methods. CPT Pharmacometrics Syst Pharmacol 2013; 2: e38. [DOI] [PMC free article] [PubMed] [Google Scholar]
- 14. Holford NH. A size standard for pharmacokinetics. Clin Pharmacokinet 1996; 30: 329–32. [DOI] [PubMed] [Google Scholar]
- 15. Savic RM, Karlsson MO. Importance of shrinkage in empirical bayes estimates for diagnostics: problems and solutions. AAPS J 2009; 11: 558–69. [DOI] [PMC free article] [PubMed] [Google Scholar]
- 16. Shah PS, Beyene J, To T, Ohlsson A, Perlman M. Postasphyxial hypoxic–ischemic encephalopathy in neonates: outcome prediction rule within 4 hours of birth. Arch Pediatr Adolesc Med 2006; 160: 729–36. [DOI] [PubMed] [Google Scholar]
- 17. Rhodin MM, Anderson BJ, Peters AM, Coulthard MG, Wilkins B, Cole M, Chatelut E, Grubb A, Veal GJ, Keir MJ, Holford NH. Human renal function maturation: a quantitative description using weight and postmenstrual age. Pediatr Nephrol 2009; 24: 67–76. [DOI] [PubMed] [Google Scholar]
- 18. Holford N, Heo YA, Anderson B. A pharmacokinetic standard for babies and adults. J Pharm Sci 2013; 102: 2941–52. [DOI] [PubMed] [Google Scholar]
- 19. Brendel K, Comets E, Laffont C, Laveille C, Mentre F. Metrics for external model evaluation with an application to the population pharmacokinetics of gliclazide. Pharm Res 2006; 23: 2036–49. [DOI] [PMC free article] [PubMed] [Google Scholar]
- 20. Moore RD, Lietman PS, Smith CR. Clinical response to aminoglycoside therapy: importance of the ratio of peak concentration to minimal inhibitory concentration. J Infect Dis 1987; 155: 93–9. [DOI] [PubMed] [Google Scholar]
- 21. Bastone EB, Li SC, Ioannides‐Demos LL, Spicer WJ, McLean AJ. Kill kinetics and regrowth patterns of Escherichia coli exposed to gentamicin concentration‐time profiles simulating in vivo bolus and infusion dosing. Antimicrob Agents Chemother 1993; 37: 914–7. [DOI] [PMC free article] [PubMed] [Google Scholar]
- 22. Allegaert K, Anderson BJ, van den Anker JN, Vanhaesebrouck S, de ZF . Renal drug clearance in preterm neonates: relation to prenatal growth. Ther Drug Monit 2007; 29: 284–91. [DOI] [PubMed] [Google Scholar]
- 23. Leake RD, Trygstad CW, Oh W. Inulin clearance in the newborn infant: relationship to gestational and postnatal age. Pediatr Res 1976; 10: 759–62. [DOI] [PubMed] [Google Scholar]
- 24. Fuchs A, Guidi M, Giannoni E, Werner D, Buclin T, Widmer N, Csajka C. Population pharmacokinetic study of gentamicin in a large cohort of premature and term neonates. Br J Clin Pharmacol 2014; 78: 1090–101. [DOI] [PMC free article] [PubMed] [Google Scholar]
- 25. Nielsen EI, Sandstrom M, Honore PH, Ewald U, Friberg LE. Developmental pharmacokinetics of gentamicin in preterm and term neonates: population modelling of a prospective study. Clin Pharmacokinet 2009; 48: 253–63. [DOI] [PubMed] [Google Scholar]
- 26. De Cock RF, Allegaert K, Sherwin CM, Nielsen EI, de HM , van den Anker JN, Danhof M, Knibbe CA. A neonatal amikacin covariate model can be used to predict ontogeny of other drugs eliminated through glomerular filtration in neonates. Pharm Res 2014; 31: 754–67. [DOI] [PMC free article] [PubMed] [Google Scholar]
- 27. De Cock RF, Allegaert K, Schreuder MF, Sherwin CM, de HM , van den Anker JN, Danhof M, Knibbe CA. Maturation of the glomerular filtration rate in neonates, as reflected by amikacin clearance. Clin Pharmacokinet 2012; 51: 105–17. [DOI] [PubMed] [Google Scholar]
- 28. Lanao JM, Calvo MV, Mesa JA, Martin‐Suarez A, Carbajosa MT, Miguelez F, Dominguez‐Gil A. Pharmacokinetic basis for the use of extended interval dosage regimens of gentamicin in neonates. J Antimicrob Chemother 2004; 54: 193–8. [DOI] [PubMed] [Google Scholar]
- 29. Stolk LM, Degraeuwe PL, Nieman FH, de Wolf MC, de BA . Population pharmacokinetics and relationship between demographic and clinical variables and pharmacokinetics of gentamicin in neonates. Ther Drug Monit 2002; 24: 527–31. [DOI] [PubMed] [Google Scholar]
- 30. DiCenzo R, Forrest A, Slish JC, Cole C, Guillet R. A gentamicin pharmacokinetic population model and once‐daily dosing algorithm for neonates. Pharmacotherapy 2003; 23: 585–91. [DOI] [PubMed] [Google Scholar]
- 31. Frymoyer A, Lee S, Bonifacio SL, Meng L, Lucas SS, Guglielmo BJ, Sun Y, Verotta D. Every 36‐h gentamicin dosing in neonates with hypoxic–ischemic encephalopathy receiving hypothermia. J Perinatol 2013; 33: 778–82. [DOI] [PMC free article] [PubMed] [Google Scholar]