

Abstract
Purpose
Induction chemotherapy (IC) before radiotherapy lowers distant failure (DF) rates in locally advanced squamous cell carcinoma of the head and neck (SCCHN). The goal of this phase III trial was to determine whether IC before chemoradiotherapy (CRT) further improves survival compared with CRT alone in patients with N2 or N3 disease.
Patients and Methods
Treatment-naive patients with nonmetastatic N2 or N3 SCCHN were randomly assigned to CRT alone (CRT arm; docetaxel, fluorouracil, and hydroxyurea plus radiotherapy 0.15 Gy twice per day every other week) versus two 21-day cycles of IC (docetaxel 75 mg/m2 on day 1, cisplatin 75 mg/m2 on day 1, and fluorouracil 750 mg/m2 on days 1 to 5) followed by the same CRT regimen (IC + CRT arm). The primary end point was overall survival (OS). Secondary end points included DF-free survival, failure pattern, and recurrence-free survival (RFS).
Results
A total of 285 patients were randomly assigned. The most common grade 3 to 4 toxicities during IC were febrile neutropenia (11%) and mucositis (9%); during CRT (both arms combined), they were mucositis (49%), dermatitis (21%), and leukopenia (18%). Serious adverse events were more common in the IC arm (47% v 28%; P = .002). With a minimum follow-up of 30 months, there were no statistically significant differences in OS (hazard ratio, 0.91; 95% CI, 0.59 to 1.41), RFS, or DF-free survival.
Conclusion
IC did not translate into improved OS compared with CRT alone. However, the study was underpowered because it did not meet the planned accrual target, and OS was higher than predicted in both arms. IC cannot be recommended routinely in patients with N2 or N3 locally advanced SCCHN.
INTRODUCTION
The majority of patients with squamous cell carcinoma of the head and neck (SCCHN) will present with locally or locoregionally advanced disease. Despite treatment aimed at eradicating the disease,1 cure rates remain modest, especially in tumors not associated with human papillomavirus (HPV). Concurrent chemoradiotherapy (CRT), supported by a meta-analysis demonstrating an improvement in overall survival (OS) over radiotherapy (RT) alone,2 has become a standard of care in these patients. Moreover, high objective response rates to neoadjuvant chemotherapy are often observed in these patients. Despite this, the same meta-analysis demonstrated only a 2.4% improvement in 5-year OS in studies assessing neoadjuvant chemotherapy (hazard ratio [HR], 0.96; 95% CI, 0.9 to 1.02; P = .18), although there was a greater benefit with cisplatin plus infusional fluorouracil regimens.2
Interest in neoadjuvant, or induction, chemotherapy has been renewed with the demonstrated efficacy of a three-drug regimen consisting of docetaxel, cisplatin, and fluorouracil (TPF)3–5 and a consistent reduction in distant failure.6 We hypothesized that induction chemotherapy (IC) would more likely demonstrate an improvement in survival if two other conditions were met: use of a CRT regimen achieving high rates of locoregional control and treatment of patients at greatest risk for distant recurrence. Therefore, we designed a phase III randomized study of IC followed by concurrent CRT compared with concurrent chemotherapy alone in patients with N2 or N3 disease (DeCIDE [Docetaxel-Based Chemotherapy Plus or Minus IC to Decrease Events in Head and Neck Cancer]). The concurrent CRT regimen was adapted from prior approaches,7–9 whereas IC consisted of a TPF regimen adapted from a prior study.4
PATIENTS AND METHODS
Eligibility
Eligible patients were age ≥ 18 years with a confirmed diagnosis of N2 or N3 (American Joint Committee on Cancer, sixth edition) SCCHN, performance status ≥ 70%, and normal organ and marrow function (hemoglobin > 8.0 g/dL, absolute neutrophil count ≥ 1,500/μL, platelet count ≥ 100,000/μL, and total bilirubin within normal institutional limits). Metastatic disease, existing symptomatic peripheral neuropathy, or prior therapy excluded participation. Prior organ-sparing surgical procedures were allowed. The institutional review board at each site approved the study, and all patients were required to provide informed consent. A data and safety monitoring board consisting of a medical oncologist, radiation oncologist, and statistician reviewed the data independently.
Treatment
Before starting therapy, patients were required to undergo endoscopy, radiographic studies (ie, computed tomography or magnetic resonance imaging of head and neck, computed tomography of chest, and bone scan [if indicated] within 4 weeks of starting therapy), complete blood count, and complete metabolic profile. Patients were randomly assigned using the permuted-block method, stratified by clinical site, in a nonblinded manner to receive IC followed by CRT (IC + CRT arm) or CRT (CRT arm). IC consisted of two cycles of TPF as previously described4 and was not allowed to exceed 8 weeks in duration. WBC growth factor support was administered with each cycle of IC. CRT was administered as previously described,7 consisting of docetaxel, fluorouracil, and hydroxyurea (DFHX) with concurrent, twice-daily RT (three-dimensional conformal RT or intensity-modulated radiation therapy [IMRT]; Appendix Fig A1, online only). Total radiation dose guidelines included 74 to 75 Gy to gross, 54 Gy to high-risk microscopic, and 39 Gy to low-risk microscopic disease. The dose limit to the spinal cord was 40 Gy with three-dimensional RT and 45 Gy with IMRT. Treatment-planning documentation and completed treatment records for US patients were submitted to the Quality Assurance Review Center (Lincoln, RI) for evaluation of volumes and delivered doses. Major deviations were defined as > 10% deviation in total dose, fractionation not consistent with protocol requirements, or targeted tumor as defined by the protocol not fully encompassed in the treatment volume. Minor deviations included 6% to 10% deviation from the total dose or dose uniformity across the target volume exceeding the protocol requirements.
End Points
OS was the primary end point, defined as the time from random assignment to death resulting from any cause. Distant failure–free survival (time to distant failure or death resulting from any cause) and recurrence-free survival (time to locoregional or distant failure or death resulting from any cause) were secondary end points. Response was assessed using RECIST. Toxicity was graded using Common Toxicity Criteria for Adverse Events (version 3.0). HPV status was determined in an unplanned retrospective analysis. p16 immunohistochemical staining was performed and interpreted as positive if ≥ 70% of tumor cells showed strong immunoreactivity.
Statistical Considerations
Survival rates were estimated by the Kaplan-Meier10 method and compared between the two treatment groups using the log-rank test.11 All patients randomly assigned in the study were included in the analysis, with the exception of six patients who withdrew consent before receiving treatment and one patient who was found to have been ineligible (Fig 1). One site was also excluded after it was determined that the radiation oncologist had elected not to participate in the trial. Cox12 proportional hazards regression models were fitted to assess and adjust for the effects of covariates. Multiple imputation was applied to maintain efficiency in the presence of missing covariate data.13 Mean life restricted to 6 years was estimated by the area under the survival curve up to 6 years.14 Competing risk analyses were also conducted.15,16 Response rates after CRT were compared between the two treatment arms using a χ2 test. Adverse event (AE) rates are summarized by type and grade and compared between groups using χ2 or Fisher's exact test as appropriate.
Fig 1.
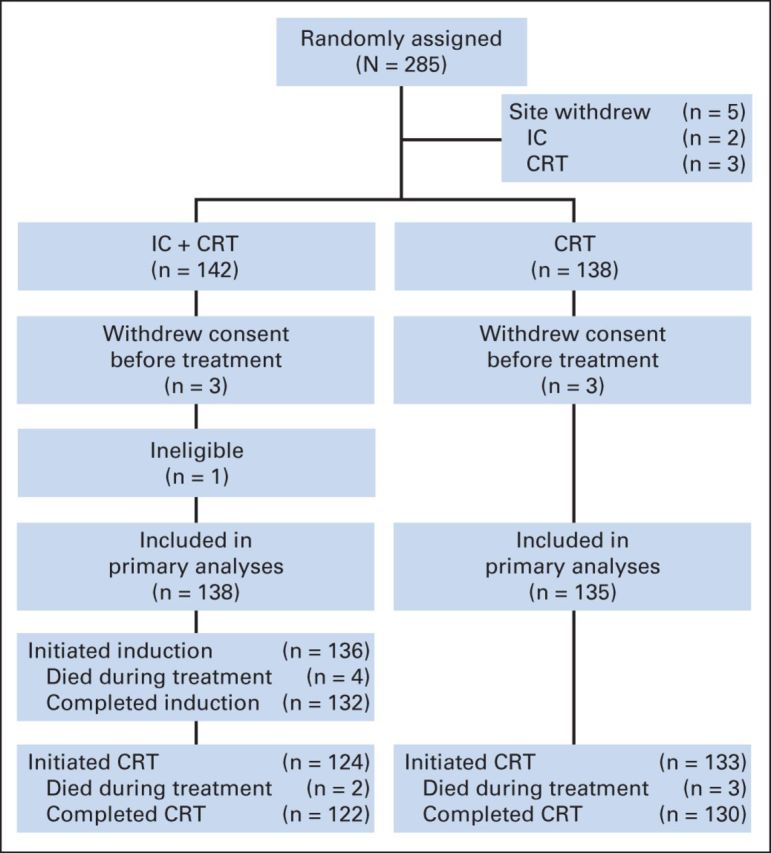
CONSORT diagram. Five patients' treatment deviated substantially from protocol at a single center, and all patients enrolled at that center were excluded from analysis. Six patients withdrew consent before receiving treatment, and one patient was determined to have been ineligible because of lung metastasis. CRT, chemoradiotherapy; IC, induction chemotherapy.
The sample size for the trial was derived from previous single-arm clinical trials of FHX without9,17–19 or with8,20,21 IC among patients with N2 or N3 disease. Assuming a true 3-year survival rate of 50% with CRT and 65% with IC + CRT, corresponding to an HR of 0.625 (under exponential survival), a sample size of 400 patients was determined to provide 88% statistical power.22 This assumed a 2.5-year recruitment period and subsequent 2.5-year follow-up period, for total study duration of 5 years. On the basis of these assumptions, 175 deaths were projected. An O'Brien-Fleming23 type of monitoring bound was used as a guideline for early stopping. Four interim analyses and one final analysis were preplanned for the primary end point after 35, 70, 105, 140, and 175 deaths had occurred, respectively. To preserve the overall type I error rate at the nominal 5% level, the O'Brien-Fleming boundary required z values of 4.55, 3.22, 2.63, and 2.28, respectively, for early stopping and 2.04 for the final analysis. The trial was initiated in December 2004. By September 2008, it had become apparent that accrual would remain slower than anticipated. On the basis of the observed overall event rate at that time, the accrual goal was amended to 280 patients, and duration of follow-up was extended to July 2011, which would have provided 80% power to detect the original HR of 0.625. However, by the end of the study, because of lower-than-projected event rates and smaller sample size, the power to detect the original HR of 0.625 was only 56%.
RESULTS
Patient Characteristics
From December 2004 to May 2009, 285 patients were randomly assigned (Fig 1) from 20 sites in five countries. The data cutoff was December 2011. The primary analysis is based on 138 and 135 patients randomly assigned to IC + CRT and CRT arms, respectively. Baseline characteristics were well balanced between the two groups (Table 1). Organ-preserving surgery was performed before therapy in 11 and six patients in the IC + CRT and CRT arms, respectively.
Table 1.
Baseline Patient Demographic and Clinical Characteristics by Treatment Group
| Characteristic | IC + CRT Arm (n = 138) |
CRT Arm (n = 135) |
||
|---|---|---|---|---|
| No. | % | No. | % | |
| Age, years | ||||
| Mean | 56.7 | 56.9 | ||
| SD | 7.9 | 8.0 | ||
| Range | 31-75 | 38-82 | ||
| Sex | ||||
| Male | 113 | 81.9 | 118 | 87.4 |
| Female | 25 | 18.1 | 17 | 12.6 |
| Race | ||||
| African American | 20 | 14.6 | 19 | 14.2 |
| White | 115 | 83.9 | 114 | 85.1 |
| Other | 2 | 1.5 | 1 | 0.8 |
| Missing | 1 | 1 | ||
| Smoking history, pack-years | ||||
| Nonsmoker | 24 | 18.2 | 20 | 15.5 |
| Pipe or cigar only | 3 | 2.3 | 4 | 3.1 |
| < 20 | 30 | 22.7 | 29 | 22.5 |
| 20-39 | 36 | 27.3 | 32 | 24.8 |
| ≥ 40 | 39 | 29.5 | 44 | 34.1 |
| Missing | 6 | 6 | ||
| History of alcohol use | ||||
| Nondrinker | 18 | 14.0 | 12 | 9.3 |
| Infrequent | 9 | 7.0 | 16 | 12.4 |
| Light | 36 | 27.9 | 25 | 19.4 |
| Moderate | 38 | 29.5 | 48 | 37.2 |
| Heavy | 28 | 21.7 | 28 | 21.7 |
| Missing | 9 | 6 | ||
| KPS | ||||
| 70-80 | 17 | 12.6 | 20 | 15.2 |
| 90 | 53 | 39.3 | 55 | 41.7 |
| 100 | 65 | 48.1 | 57 | 43.2 |
| Missing | 3 | 3 | ||
| Country of enrollment | ||||
| Croatia | 5 | 3.6 | 4 | 3.0 |
| France | 4 | 2.9 | 3 | 2.2 |
| Russia | 8 | 5.8 | 5 | 3.7 |
| Spain | 1 | 0.7 | 0 | 0.0 |
| United States | 120 | 87.0 | 123 | 91.1 |
| Histology | ||||
| Squamous cell | 131 | 100.0 | 130 | 100.0 |
| Missing | 7 | 5 | ||
| Primary tumor site | ||||
| Oral cavity | 21 | 15.3 | 18 | 13.3 |
| Oropharynx | 84 | 61.3 | 75 | 55.6 |
| Larynx | 17 | 12.4 | 20 | 14.8 |
| Other | 4 | 2.9 | 7 | 5.2 |
| Unknown | 11 | 8.0 | 15 | 11.1 |
| Missing | 1 | 0 | ||
| T stage | ||||
| 0 | 1 | 0.7 | 0 | 0.0 |
| 1 | 27 | 19.9 | 17 | 12.7 |
| 2 | 42 | 30.9 | 36 | 26.9 |
| 3 | 29 | 21.3 | 32 | 23.9 |
| 4 | 26 | 19.1 | 33 | 24.6 |
| X | 11 | 8.1 | 16 | 11.9 |
| Missing | 2 | 1 | ||
| N stage | ||||
| 2* | 20 | 14.7 | 15 | 11.2 |
| 2a | 12 | 8.8 | 10 | 7.5 |
| 2b | 58 | 42.3 | 60 | 44.8 |
| 2c | 32 | 23.5 | 34 | 25.4 |
| 3 | 15 | 11.0 | 15 | 11.2 |
| Missing | 1 | 1 | ||
| AJCC stage | ||||
| IVa | 110 | 87.3 | 103 | 85.8 |
| IVb | 16 | 12.7 | 17 | 14.2 |
| Missing | 12 | 15 | ||
| Comorbidity | ||||
| Diabetes† | 10 | 7.5 | 6 | 4.6 |
| History of MI† | 8 | 6.0 | 7 | 5.3 |
| Chronic pulmonary disease‡ | 10 | 7.5 | 8 | 6.1 |
| Liver disease† | 3 | 2.2 | 4 | 3.0 |
| Anemia (HgB < 12 mg/dL) | 18 | 13.0 | 16 | 11.8 |
Abbreviations: AJCC, American Joint Committee on Cancer; CRT, chemoradiotherapy; HgB, hemoglobin; IC, induction chemotherapy; KPS, Karnofsky performance score; MI, myocardial infarction; SD, standard deviation.
Substaging not provided.
Four and three patient cases missing from IC + CRT and CRT groups, respectively.
Five and three patient cases missing from IC + CRT and CRT groups, respectively.
Treatment Delivery
The majority of patients (79%) received all intended doses of IC (Fig 2A). Delivery rates of CRT were also high in both arms (Fig 2B), but the proportion of patients in the IC + CRT arm who received the target dose was lower in each cycle. These differences were statistically significant for hydroxyurea, docetaxel, and RT (P < .06 for all cycles) but mostly resulted from the difference in the number of patients who never started CRT between the two arms (Fig 1).
Fig 2.

Treatment delivery. (A) Induction chemotherapy delivery; percentage of patients receiving target dose and < 90% of target dose during cycles one and two. (B) Chemoradiotherapy delivery; percentage of patients in each treatment arm receiving target dose, > 110% of target dose, and < 90% of target dose during cycles one to five. CRT, chemoradiotherapy; IC, induction chemotherapy.
In both arms, > 90% of patients received IMRT. Median total radiation dose to gross, high-risk microscopic, and low-risk microscopic disease reached the intended targets in both arms without any statistical differences. The proportion of patients receiving the target RT dose was lower among patients in the IC + CRT arm in cycles one to three (P = .037, .067, and .049, respectively). RT quality was reviewed for 211 (82%) of 257 patients who received at least one fraction (19 patients had missing data or were unevaluable). Major deviations occurred in six patients in each arm, and minor deviations occurred in nine and seven patients in the IC + CRT and CRT groups, respectively. Approximately 20% of patients in each arm (19 and 24, respectively) had spinal cord deviations without reported sequelae.
Toxicity
AEs during IC were consistent with TPF toxicity (Appendix Table A1, online only), with myelosuppression being most common. Grade ≥ 2 mucositis occurred in nearly one third of patients, with fatigue, alopecia, dehydration, and nausea occurring in approximately one quarter. Four patients died during IC as a result of treatment-related toxicity: three as a result of septic shock after neutropenia and one as a result of atrial fibrillation with rapid ventricular response. During CRT, the most common toxicities were mucositis and dermatitis, with similar rates in both arms (Appendix Table A2, online only); however, the rates of alopecia, neutropenia, leukopenia, anemia, and hypomagnesemia were significantly greater in the IC + CRT arm. Five patients died during CRT: two in the IC + CRT arm and three in the CRT group; one of the two deaths in the IC + CRT arm was treatment related (neutropenic sepsis), whereas none of the three deaths in the CRT arm were deemed treatment related. Sixty-five patients (47%) in the IC + CRT arm experienced a serious AE at some point in time, compared with 38 (28%) in the CRT arm (P = .002); this was mainly because of serious AEs occurring during induction and longer treatment duration. Serious AE rates during the CRT phase were similar in both arms (26% v 28%).
Efficacy
Of the 138 patients assigned to IC, 114 were assessable for response (11 patients underwent resection before enrollment and thus had nonmeasurable disease, and 13 had missing or inconsistent data). Overall response rate to IC was 64% (10 complete responses and 63 partial responses; 95% CI, 55% to 73%). Twenty-six patients (23%) had stable disease, five patients (4.4%) had progressive disease, six patients (5.3%) underwent resection, and four patients (3.5%) died during IC. After CRT, rates of neck dissection were similar in the two arms (31% v 35%; P = .59); residual disease at the primary site was present in 10 (11%) of 89 patients in the induction arm compared with 18 (20%) of 91 patients in the CRT arm (P = .15). Overall response rates after CRT were 79% in the IC + CRT arm versus 74% in the CRT arm (P = .45; Appendix Table A3, online only). The percentage of patients with clinical disease remaining in any lesion was similar between the IC + CRT and CRT arms (37% v 47%, respectively; P = .26).
At the close of the study, a total of 81 patients had died. Twenty-nine patients—16 in the IC + CRT group and 13 in the CRT arm—were last known alive before May 1, 2011, and declared lost to follow-up. Mortality rates were similar in the two arms: 39 (28%) in the IC + CRT group and 42 (31%) in the CRT arm (P = .69). A majority of deaths (47 of 81; 58%) were attributed to SCCHN, whereas seven were attributed to pneumonia, one to pulmonary embolism, five to drug toxicity, three to other cancers, and eight to other causes; cause of death was unknown in 10 patients (Appendix Table A4, online only). Fewer distant recurrences occurred in the IC + CRT group, but the difference was not statistically significant (19 v 29; P = .11). Kaplan-Meier curves for OS, distant failure–free survival, and recurrence-free survival are shown in Figures 3A to 3C, with log-rank P values of .68, .37, and .16, respectively. Mean lifetime restricted to 6 years (± standard error) was 4.59 ± 0.19 in the IC + CRT group versus 4.51 ± 0.20 in the CRT arm (P = .76).
Fig 3.
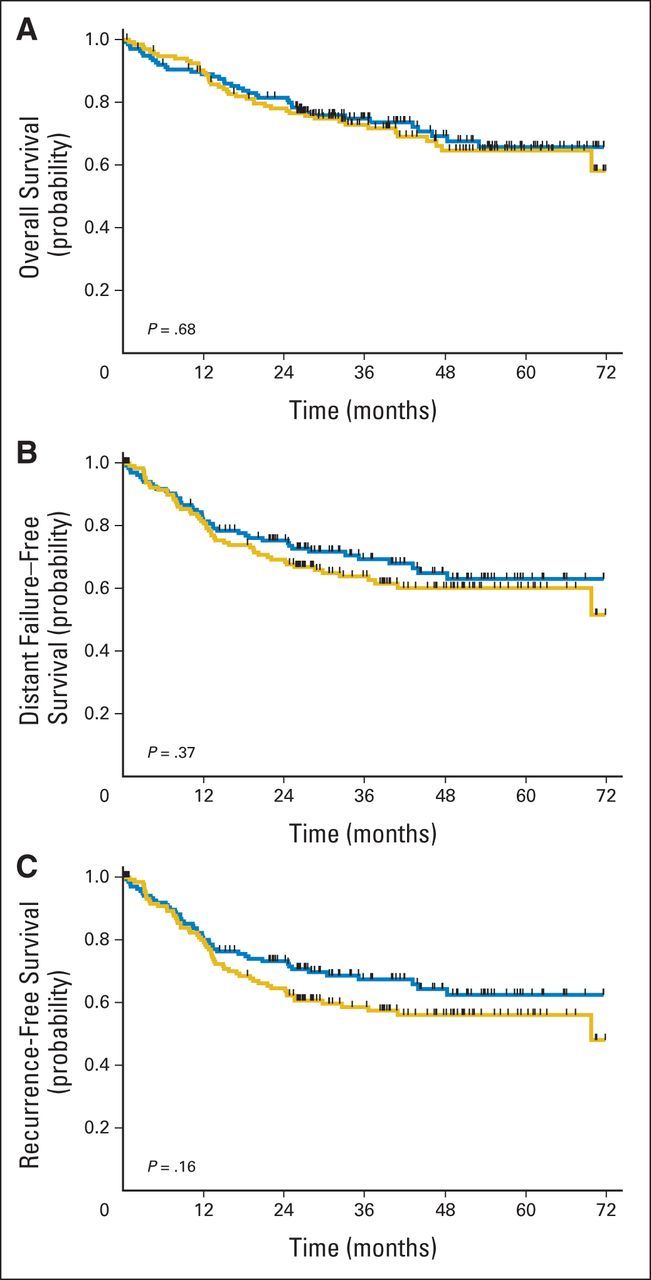
Survival by treatment arm and corresponding P values. (A) Overall, (B) distant failure–free, and (C) recurrence-free survival. Blue lines indicate induction followed by concurrent chemoradiotherapy arm; gold lines indicate concurrent chemoradiotherapy arm.
Cox regression analyses (both unadjusted and adjusted for age, Karnofsky performance score, and stage) for OS, distant failure–free survival, and recurrence-free survival were performed comparing the two treatment arms. Results are listed in Appendix Table A5 (online only). Of note, the unadjusted HR for OS was 0.91, but the 95% CI was fairly broad, ranging from 0.59 to 1.41. Unadjusted HRs for distant failure–free and recurrence-free survival were 0.83 (95% CI, 0.55 to 1.25) and 0.76 (95% CI, 0.51 to 1.12), respectively. Older age at diagnosis, lower Karnofsky performance score, and higher stage were associated with worse outcomes. For example, the hazard rate for mortality increased 1.7-fold per 10-year increase in age (P < .001); it was 2.8-fold higher for Karnofsky score < 90 versus ≥ 90 (P < .001) and 2.2-fold higher in patients with stage IVb versus IVa disease (P = .004). Additional analyses indicated that there were no statistically significant interactions between these factors and treatment arm.
Two sets of competing risk analyses were performed. The first set analyzed deaths resulting from SCCHN, with deaths resulting from all other causes as a competing risk. The IC + CRT arm had a trend for a lower cumulative incidence of SCCHN-related deaths, but this was offset by a higher incidence of death resulting from other causes; in neither case was the difference statistically significant (Figs 4A and 4B). The second set partitioned recurrence-free survival into three components: locoregional recurrence as first event, distant recurrence as first event, and death absent any prior recurrence as first event (Figs 4C to 4E). The cumulative incidence of locoregional recurrence was not significantly different between the two treatment arms. However, there was a statistically significant difference in favor of IC + CRT in the cumulative incidence of distant recurrence without prior locoregional recurrence (P = .043).
Fig 4.

Competing risk analysis. Cumulative incidence of (A) death resulting from squamous cell carcinoma of head and neck (SCCHN), (B) death resulting from causes other than SCCHN, (C) locoregional recurrence without prior distant recurrence, (D) distant recurrence without prior locoregional recurrence, and (E) death without prior locoregional or distant recurrence. CRT, chemoradiotherapy; IC, induction chemotherapy.
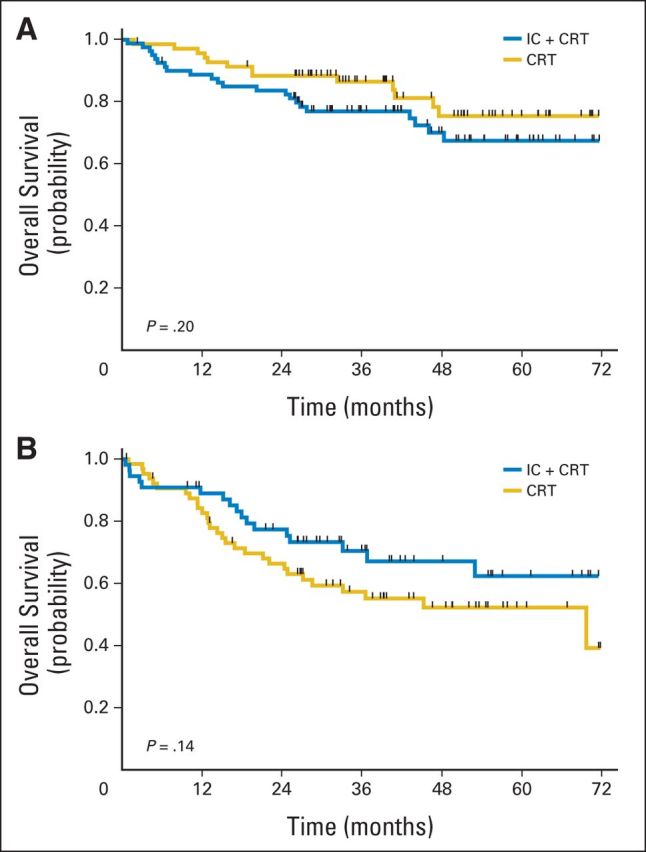
Subset analysis was performed to determine if there were specific patient cohorts benefitting from IC (Figs 5A to 5E). HPV status for oropharynx cancers was available for 49 patients (31%; 28 in IC + CRT arm and 21 in CRT arm), and a majority were HPV positive (89% in IC + CRT arm and 81% in CRT arm). OS was not significantly different between treatment groups in HPV-positive patients (P = .37). There were no significant differences in OS between the two treatment arms in patients whose disease was located in the oropharynx (P = .51) or nonoropharynx (P = .77), nor among patients with stage N2a or N2b disease (P = .52). In patients with N2c or N3 disease, there was no statistically significant difference in survival (P = .19), but the power to demonstrate a difference in this subgroup was low. Subset analysis by T stage did not reveal significant differences (Appendix Figs A2A and A2B, online only).
Fig 5.

Subset analysis of overall survival for patients with (A) human papillomavirus, (B) oropharyngeal disease, (C) nonoropharyngeal disease, (D) N2a or N2b disease, and (E) N2c or N3 disease. CRT, chemoradiotherapy; IC, induction chemotherapy.
Landmark analyses were performed to compare survival outcomes in responders to IC versus nonresponders, conditional on survival to the end of induction. There was no statistically significant difference in survival in patients who responded to IC compared with nonresponders (P = .23; Fig 6).
Fig 6.

Landmark analysis of survival based on response; overall survival by response to induction chemotherapy. P value is for comparison of responders versus nonresponders.
DISCUSSION
This study examined the effect of adding IC to an effective CRT regimen in a subset of patients with locoregionally advanced SCCHN. We hypothesized that patients with N2 or N3 disease, at highest risk for distant metastasis,24 would benefit from IC, because response rates have been historically high in this disease, with an expected improvement in distant failure rates. From a clinical perspective, the design sought to achieve a difference that would be viewed as meaningful, although a 15% absolute difference between the two arms was ambitious. These results are similar to those of a contemporaneously conducted randomized trial assessing the benefit of IC in patients with locally advanced SCCHN.25 The PARADIGM study administered three cycles of TPF before concurrent CRT and did not find a statistically significant survival difference between the two arms, although it was terminated early because of poor accrual.
Realizing that an improvement in survival required shifting the natural history of locally advanced SCCHN, locoregional control in both arms became paramount to reduce mortality resulting from locoregional failure. Excellent locoregional control (87% to 90%) was achieved with DFHX in both arms, confirming that this is an effective regimen. The other critical assumption was that the 3-year survival rate in the control arm would be 50%, derived from historical data of patients with N2 or N3 disease.24 However, in a recent analysis, T4 and N3 HPV-related oropharynx cancers carried the highest risk of distant failure (24%),19 and therefore, including patients with lower T and N stage disease in this study may have diluted the benefit of IC. Moreover, the study was underpowered to demonstrate a statistically significant difference in survival, given the smaller sample size (280 rather than 400 patients) and lower mortality rates observed. This was offset to some extent by the longer follow-up period, but with one half of the number of deaths originally projected, the power to detect the originally specified HR of 0.625 was only 56%. A nominally statistically significant difference in favor of IC in the cumulative incidence of distant recurrence without prior locoregional recurrence was found (P = .043); however, given the multiplicity of analyses conducted, this finding should be interpreted guardedly because of the potential for inflating type I error.
Toxicity, as measured by total serious AEs, was greater in the IC arm. Some prior studies have administered three to four cycles of IC in the hope of maximizing response rates. Our study administered two cycles of TPF, with dosing similar to that in the TAX323 study.4 Given the toxicity observed, especially that related to myelosuppression, the increase in early noncancer deaths in the IC arm, and the fact that three cycles of TPF were administered in the PARADIGM study without demonstration of a survival benefit, it is likely that additional cycles would negatively affect treatment delivery without providing benefit.
On the basis of the statistically nonsignificant findings of this trial, induction chemotherapy before concomitant CRT cannot be routinely recommended for patients with locally advanced SCCHN. Nonetheless, there may be specific subgroups where further investigation seems indicated. For instance, it would be interesting to test induction chemotherapy in patients with N2c or N3 disease. Moreover, and consistent with prior research, response to induction chemotherapy may serve as a prognostic tool with potential to alter subsequent therapy based on response. This concept is currently being tested in clinical trials (eg, NCT01084083 and NCT01133678).
Supplementary Material
Acknowledgment
We thank Sarah Rumler, Brandon Hatch, Sarah Spencer, and Mary Littler for data management; Nicholas Sarlis for protocol support; and the data and safety monitoring committee during the conduct of this study: Merrill Kies, MD (chair), Theodore Chung, MD, and Jason Fine, PhD.
Glossary Terms
- neoadjuvant therapy:
the administration of chemotherapy prior to surgery. Induction chemotherapy is generally designed to decrease the size of the tumor prior to resection and to increase the rate of complete (R0) resections.
- overall survival:
the duration between random assignment and death.
Appendix
Table A1.
Toxicity During Induction Phase (IC + CRT arm; n = 136)*
| AE | Grade 1 |
Grade 2 |
Grade ≥ 3 |
|||
|---|---|---|---|---|---|---|
| No. | % | No. | % | No. | % | |
| Fatigue | 63 | 46 | 28 | 21 | 10 | 7.4 |
| Hair loss | 29 | 21 | 25 | 18 | ||
| Anorexia | 30 | 22 | 19 | 14 | 10 | 7.4 |
| Dehydration | 6 | 4.4 | 28 | 21 | 6 | 4.4 |
| Diarrhea | 28 | 21 | 17 | 12 | 7 | 5.1 |
| Dysphagia | 17 | 12 | 7 | 5.1 | 4 | 2.9 |
| Mucositis | ||||||
| Clinical | 29 | 21 | 28 | 21 | 12 | 8.8 |
| Functional | 31 | 23 | 22 | 16 | 9 | 6.6 |
| Nausea | 48 | 35 | 32 | 24 | 5 | 3.7 |
| Vomiting | 23 | 17 | 15 | 11 | 3 | 2.2 |
| Neutropenia | 3 | 2.2 | 0 | 0.0 | 15 | 11 |
| Infection | 7 | 5.1 | 8 | 5.9 | 4 | 2.9 |
| Tumor pain | 24 | 18 | 11 | 8.0 | 4 | 2.9 |
| Pain NOS | 21 | 15 | 7 | 5.1 | 2 | 1.5 |
| ANC | 6 | 4.4 | 20 | 15 | 49 | 36 |
| HgB | 80 | 59 | 35 | 26 | 1 | 0.7 |
| Platelets | 34 | 25 | 6 | 4.4 | 4 | 2.9 |
| Hyperglycemia | 63 | 46 | 30 | 22 | 10 | 7.4 |
| WBC | 18 | 13 | 40 | 29 | 38 | 28 |
| Creatinine | 20 | 15 | 9 | 6.7 | 1 | 0.7 |
| Hypokalaemia | 14 | 10 | 1 | 0.7 | 7 | 5.1 |
| Hypocalcaemia | 10 | 7.4 | 5 | 3.7 | 2 | 1.5 |
| Hyponatraemia | 8 | 5.9 | 0 | 0.0 | 7 | 5.1 |
Abbreviations: AE, adverse event; ANC, absolute neutrophil count; CRT, chemoradiotherapy; HgB, hemoglobin; IC, induction chemotherapy; NOS, not otherwise specified.
Excludes two patients who never started induction therapy.
Table A2.
Toxicity During CRT Phase Occurring in ≥ 5% of Patients in Either Treatment Arm
| AE | IC + CRT Arm (n = 124)* |
CRT Arm (n = 133)† |
P | ||||||||||
|---|---|---|---|---|---|---|---|---|---|---|---|---|---|
| Grade 1 |
Grade 2 |
Grade ≥ 3 |
Grade 1 |
Grade 2 |
Grade ≥ 3 |
||||||||
| No. | % | No. | % | No. | % | No. | % | No. | % | No. | % | ||
| Fatigue | 63 | 51 | 32 | 26 | 6 | 4.8 | 59 | 44 | 33 | 25 | 4 | 3.0 | .32 |
| Fever | 17 | 14 | 5 | 4.0 | 4 | 3.2 | 23 | 17 | 6 | 4.5 | 1 | 0.8 | .46 |
| Hair loss | 18 | 15 | 32 | 26 | 27 | 20 | 8 | 6.0 | < .001 | ||||
| Dermatitis | 35 | 28 | 46 | 37 | 22 | 18 | 29 | 22 | 52 | 39 | 32 | 24 | .48 |
| Hand foot | 7 | 5.6 | 5 | 4.0 | 2 | 1.6 | 8 | 6.0 | 5 | 3.8 | 1 | 0.8 | .93 |
| Anorexia | 31 | 25 | 21 | 17 | 14 | 11 | 39 | 29 | 20 | 15 | 18 | 14 | .76 |
| Constipation | 33 | 27 | 7 | 5.6 | 0 | 0.0 | 37 | 28 | 18 | 14 | 2 | 1.5 | .067 |
| Dehydration | 8 | 6.5 | 22 | 18 | 12 | 9.7 | 9 | 6.8 | 19 | 14 | 9 | 6.8 | .68 |
| Diarrhea | 21 | 17 | 3 | 2.4 | 0 | 0.0 | 19 | 14 | 8 | 6.0 | 4 | 3.0 | .11 |
| Dysphagia | 13 | 10 | 29 | 23 | 15 | 12 | 10 | 7.5 | 32 | 24 | 20 | 15 | .79 |
| Mucositis | |||||||||||||
| Clinical | 7 | 5.6 | 34 | 27 | 63 | 51 | 9 | 6.8 | 46 | 35 | 63 | 47 | .48 |
| Functional | 10 | 8.1 | 35 | 28 | 58 | 47 | 5 | 3.8 | 43 | 32 | 56 | 42 | .32 |
| Nausea | 34 | 27 | 17 | 14 | 7 | 5.6 | 54 | 41 | 13 | 9.8 | 6 | 4.5 | .16 |
| Vomiting | 23 | 19 | 8 | 6.5 | 4 | 3.2 | 29 | 22 | 9 | 6.8 | 3 | 2.3 | .89 |
| Neutropenia | 0 | 0.0 | 3 | 2.4 | 4 | 3.2 | 0 | 0.0 | 0 | 0.0 | 2 | 1.5 | .13 |
| Infection | 4 | 3.2 | 16 | 13 | 14 | 11 | 3 | 2.3 | 12 | 9.0 | 19 | 14 | .66 |
| Tumor pain | 8 | 6.5 | 20 | 16 | 6 | 4.8 | 20 | 15 | 18 | 14 | 8 | 6.0 | .15 |
| Pain NOS | 16 | 13 | 24 | 19 | 13 | 10 | 25 | 19 | 31 | 23 | 8 | 6.0 | .29 |
| ANC | 8 | 6.5 | 20 | 16 | 17 | 14 | 11 | 8.3 | 21 | 16 | 5 | 3.8 | .039 |
| HgB | 53 | 43 | 61 | 49 | 8 | 6.5 | 72 | 54 | 49 | 37 | 4 | 3.0 | .032 |
| Platelets | 27 | 22 | 4 | 3.2 | 4 | 3.2 | 29 | 22 | 3 | 2.3 | 2 | 1.5 | .78 |
| Hyperglycemia | 60 | 48 | 34 | 27 | 10 | 8.1 | 71 | 53 | 36 | 27 | 7 | 5.3 | .75 |
| Hypoglycemia | 8 | 6.5 | 6 | 4.8 | 2 | 1.6 | 10 | 7.5 | 2 | 1.5 | 1 | 0.8 | .41 |
| WBC | 17 | 14 | 38 | 31 | 32 | 26 | 27 | 20 | 48 | 36 | 15 | 11 | .021 |
| AST | 26 | 21 | 5 | 4.0 | 2 | 1.6 | 33 | 25 | 8 | 6.0 | 4 | 3.0 | .59 |
| ALT | 33 | 27 | 2 | 1.6 | 3 | 2.4 | 44 | 33 | 9 | 6.8 | 6 | 4.5 | .055 |
| Weight loss | 11 | 8.6 | 18 | 14 | 2 | 1.6 | 6 | 4.5 | 17 | 13 | 5 | 3.8 | .41 |
| Dry mouth | 11 | 8.6 | 10 | 7.8 | 1 | 0.8 | 16 | 12 | 10 | 7.5 | 0 | 0.0 | .67 |
| Hypoalbuminemia | 8 | 6.2 | 13 | 10 | 1 | 0.8 | 4 | 3.0 | 7 | 5.3 | 2 | 1.5 | .22 |
| Hypomagnesemia | 12 | 9.4 | 6 | 4.7 | 1 | 0.8 | 9 | 6.8 | 0 | 0.0 | 0 | 0.0 | .018 |
| Hypocalcemia | 4 | 3.1 | 11 | 8.6 | 1 | 0.8 | 9 | 6.8 | 7 | 5.3 | 1 | 0.8 | .39 |
| Oral pain | 0 | 0.0 | 6 | 4.7 | 7 | 5.5 | 0 | 0.0 | 8 | 6.0 | 3 | 2.3 | .35 |
| Stomatitis | 3 | 2.3 | 4 | 3.1 | 5 | 3.9 | 3 | 2.3 | 1 | 0.8 | 2 | 1.5 | .35 |
| Lymphopenia | 0 | 0.0 | 0 | 0.0 | 7 | 5.5 | 1 | 0.8 | 2 | 1.5 | 6 | 4.5 | .60 |
| Dysgeusia | 8 | 6.2 | 4 | 3.1 | 0 | 0.0 | 5 | 3.8 | 8 | 6.0 | 0 | 0.0 | .39 |
Abbreviations: AE, adverse event; ANC, absolute neutrophil count; CRT, chemoradiotherapy; HgB, hemoglobin; IC, induction chemotherapy; NOS, not otherwise specified.
Excludes two patients who never started induction or CRT therapy, four patients who died during induction therapy, and eight patients who never started CRT.
Excludes two patients who never started CRT.
Table A3.
Post-CRT Response Rates by Treatment Group
| Response | IC + CRT Arm (n = 138) |
CRT Arm (n = 135) |
||
|---|---|---|---|---|
| No. | % | No. | % | |
| CR | 30 | 26 | 26 | 21 |
| PR | 62 | 53 | 64 | 52 |
| SD | 5 | 4.3 | 10 | 8.2 |
| PD | 5 | 4.3 | 8 | 6.6 |
| Resected | 6 | 5.1 | 10 | 8.2 |
| Died | 9 | 7.7 | 4 | 3.3 |
| Nonmeasurable | 11 | 6 | ||
| Missing/inconsistent | 10 | 7 | ||
Abbreviations: CR, complete response; CRT, chemoradiotherapy; IC, induction chemotherapy; PD, progressive disease; PR, partial response; SD, stable disease.
Table A4.
Mortality and Recurrence Rates by Treatment Group
| Mortality or Recurrence | IC + CRT Arm (n = 138) |
CRT Arm (n = 135) |
P | ||
|---|---|---|---|---|---|
| No. | % | No. | % | ||
| Total mortality | 39 | 28 | 42 | 31 | .69 |
| Head and neck cancer | 19 | 14 | 28 | 21 | .15 |
| Pneumonia | 1 | 0.7 | 6 | 4.4 | .064 |
| Pulmonary embolism | 1 | 0.7 | 0 | 0.0 | 1.00 |
| Drug toxicity | 5 | 3.6 | 0 | 0.0 | .060 |
| Other cancer | 2 | 1.4 | 1 | 0.7 | 1.00 |
| Other | 6 | 4.3 | 2 | 1.5 | .28 |
| Unknown | 5 | 3.6 | 5 | 3.7 | 1.00 |
| Locoregional recurrence | 14 | 10 | 17 | 13 | .57 |
| Distant recurrence | 19 | 14 | 29 | 21 | .11 |
| Distant failure or death | 43 | 31 | 50 | 37 | .31 |
| Any recurrence or death | 45 | 33 | 56 | 41 | .14 |
Abbreviations: CRT, chemoradiotherapy; IC, induction chemotherapy.
Table A5.
Cox Regression Analyses
| Covariate | Estimate | SE | HR | 95% CI | P |
|---|---|---|---|---|---|
| OS | |||||
| M1 treatment* | −0.0917 | 0.2224 | 0.91 | 0.59 to 1.41 | .68 |
| M2 treatment* | −0.0797 | 0.2236 | 0.92 | 0.60 to 1.43 | .72 |
| Age† | 0.5415 | 0.1559 | 1.72 | 1.27 to 2.33 | .001 |
| KPS‡ | 1.0136 | 0.2619 | 2.76 | 1.65 to 4.60 | < .001 |
| Stage§ | 0.8050 | 0.2814 | 2.24 | 1.29 to 3.88 | .004 |
| DFFS | |||||
| M1 treatment* | −0.1879 | 0.2080 | 0.83 | 0.55 to 1.25 | .37 |
| M2 treatment* | −0.1447 | 0.2094 | 0.86 | 0.57 to 1.30 | .49 |
| Age† | 0.4741 | 0.1441 | 1.61 | 1.21 to 2.13 | .001 |
| KPS‡ | 0.9493 | 0.2506 | 2.58 | 1.58 to 4.22 | < .001 |
| Stage§ | 0.6505 | 0.2689 | 1.92 | 1.13 to 3.25 | .016 |
| RFS | |||||
| M1 treatment* | −0.2781 | 0.2002 | 0.76 | 0.51 to 1.12 | .16 |
| M2 treatment* | −0.2463 | 0.2018 | 0.78 | 0.53 to 1.16 | .22 |
| Age† | 0.4738 | 0.1387 | 1.61 | 1.22 to 2.11 | .001 |
| KPS‡ | 0.8127 | 0.2463 | 2.25 | 1.39 to 3.65 | .001 |
| Stage§ | 0.6165 | 0.2612 | 1.85 | 1.11 to 3.09 | .018 |
NOTE. M1: unadjusted. M2: adjusted for age, KPS, and stage.
Abbreviations: DFFS, distant failure–free survival; HR, hazard ratio; KPS, Karnofsky performance score; M1, model one; M2, model two; OS, overall survival; RFS, recurrence-free survival.
IC + CRT versus CRT.
Per decade.
< 90 versus ≥ 90.
Stage IVb versus IVa.
Fig A1.

Study schema. Patients randomly assigned to induction chemotherapy received docetaxel 75 mg/m2 (D), cisplatin 75 mg/m2 (P), and fluorouracil 750 mg/m2 (F). Chemoradiotherapy in all patients consisted of D, F, hydroxyurea, and radiation (DFHX).
Fig A2.
Overall survival analysis by T stage. Patients with (A) TX/0/1/2 tumors and (B) T3/4 tumors. CRT, chemoradiotherapy; IC, induction chemotherapy.
Footnotes
See accompanying editorial on page 2685
Supported by sanofi-aventis and the Robert and Valda Svendsen Foundation.
Terms in blue are defined in the glossary, found at the end of this article and online at www.jco.org.
Presented at the 48th Annual Meeting of the American Society of Clinical Oncology, Chicago, IL, June 1-5, 2012.
Authors' disclosures of potential conflicts of interest and author contributions are found at the end of this article.
Clinical trial information: NCT00117572.
AUTHORS' DISCLOSURES OF POTENTIAL CONFLICTS OF INTEREST
Although all authors completed the disclosure declaration, the following author(s) and/or an author's immediate family member(s) indicated a financial or other interest that is relevant to the subject matter under consideration in this article. Certain relationships marked with a “U” are those for which no compensation was received; those relationships marked with a “C” were compensated. For a detailed description of the disclosure categories, or for more information about ASCO's conflict of interest policy, please refer to the Author Disclosure Declaration and the Disclosures of Potential Conflicts of Interest section in Information for Contributors.
Employment or Leadership Position: Ranee Mehra, GlaxoSmithKline (C) Consultant or Advisory Role: Ranee Mehra, Novartis (C), Bristol-Myers Squibb (C); Everett E. Vokes, Amgen (C), Bayer (C), Bristol-Myers Squibb (C), Boehringer Ingelheim (C), Clovis Oncology (C), Synta (C), VentiRx (C) Stock Ownership: None Honoraria: None Research Funding: Chao H. Huang, sanofi-aventis; Luis E. Raez, sanofi-aventis, Roche/Genentech, Pfizer, Novartis, Eli Lilly, Boehringer Ingelheim Expert Testimony: None Patents, Royalties, and Licenses: None Other Remuneration: None
AUTHOR CONTRIBUTIONS
Conception and design: Ezra E.W. Cohen, Bruce E. Brockstein, Daniel J. Haraf, Everett E. Vokes
Administrative support: Bettina Braegas, Robyn Egan
Provision of study materials or patients: Ezra E.W. Cohen, Chao H. Huang, Bruce E. Brockstein, Mark B. Agulnik, Bharat B. Mittal, Furhan Yunus, Sandeep Samant, Luis E. Raez, Ranee Mehra, Priya Kumar, Frank Ondrey, Tanguy Y. Seiwert, Victoria M. Villaflor, Daniel J. Haraf, Everett E. Vokes
Collection and assembly of data: Ezra E.W. Cohen, Robyn Egan, Chao H. Huang, Sandeep Samant, Frank Ondrey, Patrice Marchand, Bettina Braegas, Tanguy Y. Seiwert, Daniel J. Haraf, Everett E. Vokes
Data analysis and interpretation: Ezra E.W. Cohen, Theodore G. Karrison, Masha Kocherginsky, Jeffrey Mueller, Chao H. Huang, Bruce E. Brockstein, Mark B. Agulnik, Bharat B. Mittal, Furhan Yunus, Sandeep Samant, Luis E. Raez, Ranee Mehra, Priya Kumar, Frank Ondrey, Tanguy Y. Seiwert, Victoria M. Villaflor, Daniel J. Haraf, Everett E. Vokes
Manuscript writing: All authors
Final approval of manuscript: All authors
REFERENCES
- 1.Saloura V, Langerman A, Rudra S, et al. Multidisciplinary care of the patient with head and neck cancer. Surg Oncol Clin N Am. 2013;22:179–215. doi: 10.1016/j.soc.2012.12.001. [DOI] [PubMed] [Google Scholar]
- 2.Pignon JP, le Maître A, Maillard E, et al. Meta-analysis of chemotherapy in head and neck cancer (MACH-NC): An update on 93 randomised trials and 17,346 patients. Radiother Oncol. 2009;92:4–14. doi: 10.1016/j.radonc.2009.04.014. [DOI] [PubMed] [Google Scholar]
- 3.Posner MR, Hershock DM, Blajman CR, et al. Cisplatin and fluorouracil alone or with docetaxel in head and neck cancer. N Engl J Med. 2007;357:1705–1715. doi: 10.1056/NEJMoa070956. [DOI] [PubMed] [Google Scholar]
- 4.Vermorken JB, Remenar E, van Herpen C, et al. Cisplatin, fluorouracil, and docetaxel in unresectable head and neck cancer. N Engl J Med. 2007;357:1695–1704. doi: 10.1056/NEJMoa071028. [DOI] [PubMed] [Google Scholar]
- 5.Blanchard P, Bourhis J, Lacas B, et al. Taxane-cisplatin-fluorouracil as induction chemotherapy in locally advanced head and neck cancers: An individual patient data meta-analysis of the meta-analysis of chemotherapy in head and neck cancer group. J Clin Oncol. 2013;31:2854–2860. doi: 10.1200/JCO.2012.47.7802. [DOI] [PubMed] [Google Scholar]
- 6.Ma J, Liu Y, Huang XL, et al. Induction chemotherapy decreases the rate of distant metastasis in patients with head and neck squamous cell carcinoma but does not improve survival or locoregional control: A meta-analysis. Oral Oncol. 2012;48:1076–1084. doi: 10.1016/j.oraloncology.2012.06.014. [DOI] [PubMed] [Google Scholar]
- 7.Seiwert TY, Cohen EE, Haraf DJ, et al. A phase I trial of docetaxel based induction and concomitant chemotherapy in patients with locally advanced head and neck cancer. Cancer Invest. 2007;25:435–444. doi: 10.1080/07357900701357993. [DOI] [PubMed] [Google Scholar]
- 8.Salama JK, Stenson KM, Kistner EO, et al. Induction chemotherapy and concurrent chemoradiotherapy for locoregionally advanced head and neck cancer: A multi-institutional phase II trial investigating three radiotherapy dose levels. Ann Oncol. 2008;19:1787–1794. doi: 10.1093/annonc/mdn364. [DOI] [PubMed] [Google Scholar]
- 9.Brockstein B, Haraf DJ, Stenson K, et al. A phase I-II study of concomitant chemoradiotherapy with paclitaxel (one-hour infusion), 5-fluorouracil and hydroxyurea with granulocyte colony stimulating factor support for patients with poor prognosis head and neck cancer. Ann Oncol. 2000;11:721–728. doi: 10.1023/a:1008324131519. [DOI] [PubMed] [Google Scholar]
- 10.Kaplan EL, Meier P. Nonparametric estimation from incomplete observations. J Am Stat Assoc. 1958;53:457–481. [Google Scholar]
- 11.Peto R, Pike MC, Armitage P, et al. Design and analysis of randomized clinical trials requiring prolonged observation of each patient: II. Analysis and examples. Br J Cancer. 1977;35:1–38. doi: 10.1038/bjc.1977.1. [DOI] [PMC free article] [PubMed] [Google Scholar]
- 12.Cox DR. Regression models and life-tables. J R Stat Soc Series B Stat Methodol. 1972;34:187–220. [Google Scholar]
- 13.White IR, Royston P. Imputing missing covariate values for the Cox model. Stat Med. 2009;28:1982–1998. doi: 10.1002/sim.3618. [DOI] [PMC free article] [PubMed] [Google Scholar]
- 14.Karrison TG. Use of Irwin's restricted mean as an index for comparing survival in different treatment groups: Interpretation and power considerations. Control Clin Trials. 1997;18:151–167. doi: 10.1016/s0197-2456(96)00089-x. [DOI] [PubMed] [Google Scholar]
- 15.Gooley TA, Leisenring W, Crowley J, et al. Estimation of failure probabilities in the presence of competing risks: New representations of old estimators. Stat Med. 1999;18:695–706. doi: 10.1002/(sici)1097-0258(19990330)18:6<695::aid-sim60>3.0.co;2-o. [DOI] [PubMed] [Google Scholar]
- 16.Fine JP, Gray RJ. A proportional hazards model for the subdistribution of a competing risk. J Am Stat Assoc. 1999;94:496–509. [Google Scholar]
- 17.Brockstein B, Haraf DJ, Stenson K, et al. Phase I study of concomitant chemoradiotherapy with paclitaxel, fluorouracil, and hydroxyurea with granulocyte colony-stimulating factor support for patients with poor-prognosis cancer of the head and neck. J Clin Oncol. 1998;16:735–744. doi: 10.1200/JCO.1998.16.2.735. [DOI] [PubMed] [Google Scholar]
- 18.Kies MS, Haraf DJ, Rosen F, et al. Concomitant infusional paclitaxel and fluorouracil, oral hydroxyurea, and hyperfractionated radiation for locally advanced squamous head and neck cancer. J Clin Oncol. 2001;19:1961–1969. doi: 10.1200/JCO.2001.19.7.1961. [DOI] [PubMed] [Google Scholar]
- 19.O'Sullivan B, Huang SH, Siu LL, et al. Deintensification candidate subgroups in human papillomavirus–related oropharyngeal cancer according to minimal risk of distant metastasis. J Clin Oncol. 2013;31:543–550. doi: 10.1200/JCO.2012.44.0164. [DOI] [PubMed] [Google Scholar]
- 20.Cohen EE, Haraf DJ, Kunnavakkam R, et al. Epidermal growth factor receptor inhibitor gefitinib added to chemoradiotherapy in locally advanced head and neck cancer. J Clin Oncol. 2010;28:3336–3343. doi: 10.1200/JCO.2009.27.0397. [DOI] [PMC free article] [PubMed] [Google Scholar]
- 21.Vokes EE, Stenson K, Rosen FR, et al. Weekly carboplatin and paclitaxel followed by concomitant paclitaxel, fluorouracil, and hydroxyurea chemoradiotherapy: Curative and organ-preserving therapy for advanced head and neck cancer. J Clin Oncol. 2003;21:320–326. doi: 10.1200/JCO.2003.06.006. [DOI] [PubMed] [Google Scholar]
- 22.Schoenfeld DA. Sample-size formula for the proportional-hazards regression model. Biometrics. 1983;39:499–503. [PubMed] [Google Scholar]
- 23.O'Brien PC, Fleming TR. Multiple testing procedure for clinical trials. Biometrics. 1979;35:549–556. [PubMed] [Google Scholar]
- 24.Brockstein B, Haraf DJ, Rademaker AW, et al. Patterns of failure, prognostic factors and survival in locoregionally advanced head and neck cancer treated with concomitant chemoradiotherapy: A 9-year, 337-patient, multi-institutional experience. Ann Oncol. 2004;15:1179–1186. doi: 10.1093/annonc/mdh308. [DOI] [PubMed] [Google Scholar]
- 25.Haddad R, O'Neill A, Rabinowits G, et al. Induction chemotherapy followed by concurrent chemoradiotherapy (sequential chemoradiotherapy) versus concurrent chemoradiotherapy alone in locally advanced head and neck cancer (PARADIGM): A randomised phase 3 trial. Lancet Oncol. 2013;14:257–264. doi: 10.1016/S1470-2045(13)70011-1. [DOI] [PubMed] [Google Scholar]
Associated Data
This section collects any data citations, data availability statements, or supplementary materials included in this article.