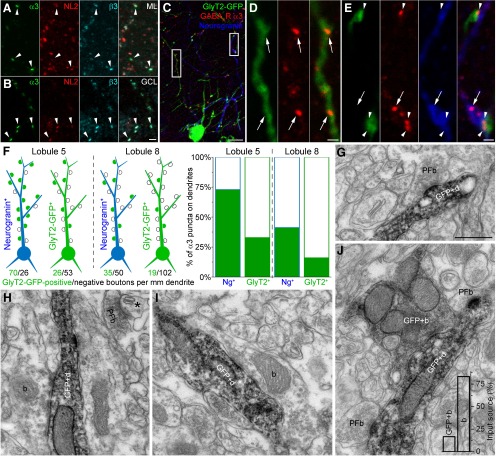
Figure 3.
GlyT2-GFP-expressing GoC dendrites in the ML are sparsely innervated by GlyT2-GFP-expressing axons. A, B, Immunofluorescent labeling for the GABAAR α3 subunit (α3, green) in the ML (A) and GCL (B) of WT mice is sparse, but overlaps with neuroligin-2-immunopositive (NL2; red) and β3 subunit-immunopositive (β3; cyan) puncta, indicating their synaptic enrichment. Maximum intensity projections of two (A) or four (B) confocal images at 1 μm separation. Scale bars: A, B, 2 µm. C, Immunofluorescent labeling for the GABAAR α3 subunit (red) in the ML of GlyT2-GFP mice is evident as multiple puncta, many of which are associated with GlyT2-GFP-expressing (green) or neurogranin-immunoreactive (blue) dendrites. Scale bar, 10 µm. D, Maximum intensity projection (five confocal sections at 1 μm separation) of the left-hand boxed region in C at a higher magnification showing α3 subunit-immunoreactive puncta (arrows) associated with a GlyT2-GFP-expressing dendrite, but lacking a presynaptic GlyT2-GFP-expressing bouton. Scale bar, 1 µm. E, Maximum intensity projection (five confocal sections at 1 μm separation) of the right-hand boxed region in C at a higher magnification showing intersections between GlyT2-GFP-expressing axons (arrowheads) and a neurogranin-immunoreactive dendrite. Note the presence of additional GABAAR α3 subunit-immunoreactive puncta not associated with a presynaptic GlyT2-GFP-expressing bouton (arrow). Scale bar, 1 µm. F, Schematic proportional representation of α3 subunit-immunoreactive puncta present on GoCs in lobule 5 (left) and lobule 8 (center), categorized as expressing neurogranin (Ng+, blue cells) or only GlyT2-GFP (GlyT2+, green cells). Each punctum was categorized as either facing a presynaptic, GlyT2-GFP-expressing (green) or GlyT2-GFP negative (hollow) axonal bouton, and total puncta density per millimeter GoC dendrite for each GoC type is indicated below each cell. The graph (right) shows the percentage of GlyT2-GFP-positive (green) and -negative (hollow) boutons contacting α3-positive clusters for each type of GoC in the two lobules. G, Electron micrograph showing an asymmetric synapse made by a parallel fiber bouton (PFb) onto a GlyT2-GFP-DAB-labeled dendrite (GFP+d). Scale bar: G (for G–J), 500 nm. H, I, Electron micrographs showing symmetrical synapses formed by unlabeled boutons (b) onto GlyT2-GFP-DAB-labeled dendrites. J, Electron micrograph showing a symmetrical synapse formed by a GlyT2-GFP-DAB-labeled bouton (GFP+b) onto a GFP+d. Two PFbs forming asymmetric synapses onto the same dendrite are also visible. Bar graph shows the percentage of symmetrical synapses formed onto GFP+d by GFP-positive (GFP+b) and GFP-negative (b) boutons.

