

Abstract
At least 30% of human proteins are thought to contain intrinsically disordered regions, which lack stable structural conformation. Despite lacking enzymatic functions and having few protein domains, disordered regions are functionally important for protein regulation and contain short linear motifs (short peptide sequences involved in protein-protein interactions), but in most disordered regions, the functional amino acid residues remain unknown. We searched for evolutionarily conserved sequences within disordered regions according to the hypothesis that conservation would indicate functional residues. Using a phylogenetic hidden Markov model (phylo-HMM), we made accurate, specific predictions of functional elements in disordered regions even when these elements are only two or three amino acids long. Among the conserved sequences that we identified were previously known and newly identified short linear motifs, and we experimentally verified key examples, including a motif that may mediate interaction between protein kinase Cbk1 and its substrates. We also observed that hub proteins, which interact with many partners in a protein interaction network, are highly enriched in these conserved sequences. Our analysis enabled the systematic identification of the functional residues in disordered regions and suggested that at least 5% of amino acids in disordered regions are important for function.
Introduction
Intrinsically disordered regions are regions that lack stable secondary or tertiary conformation, and 30% of the human proteins are thought to contain large contiguous disordered regions (1). These regions are found in many disease-associated proteins, such as the tumor suppressor and transcriptional regulator p53, the DNA repair protein BRCA1, and the chloride channel cystic fibrosis transmembrane conductance regulator (CFTR) (2–4). Although some of these regions contain recognizable domains or become ordered upon binding (5, 6), most of these regions apparently lack enzymatic activity or conserved protein domains that adopt regular structures (7). Several models have been proposed for their function, including that they are important for (i) protein-protein interactions (8), (ii) protein degradation (9), or (iii) posttranslational modifications that control protein function (10). Indeed, disordered (or unstructured) regions are particularly prevalent in proteins that exhibit many physical interactions (11) and have been associated with the sites of posttranslational modifications (12) [reviewed in (13)]. Despite the importance of these disordered regions, it is currently difficult to accurately identify which residues within a disordered region might be important.
Many of the proposed functions of disordered regions are mediated by short linear motifs (14), which are specific peptides of 2 to 10 amino acids that physically contact modifying enzymes or binding partners. We tested whether we could systematically identify short linear motifs in disordered regions by using the guiding principle of “comparative genomics”—that critical functional sequences would be preferentially preserved over evolution (15, 16). One approach to systematically identifying short linear motifs is to combine in vitro peptide binding data, protein interaction data, and bioinformatic searches (17—19). Another approach is to search for matches to a motif pattern derived from sets of co-regulated proteins (20, 21). Despite their wide applicability, many of these systematic approaches cannot provide evidence regarding the functional importance of a particular short peptide in vivo. On the other hand, the comparative genomics approach can provide evidence that a particular short sequence is important to the organism. Comparative approaches that use only evolutionary conservation are unbiased in that they do not require information about protein function or whether the short linear motif has been previously associated with a specific function. This is in contrast to other approaches (17–21) that take advantage of high-throughput in vitro and in vivo experimental information.
We applied a comparative genomic approach based on a phylogenetic hidden Markov model (phylo-HMM) (22) to identify short protein sequences in the proteome of the yeast Saccharomyces cerevisiae. The phylo-HMM approach has been used previously to discover conserved elements in DNA (22) by exploiting the pattern of nucleotide substitutions. We modified this phylo-HMM approach to include the pattern of insertion and deletion events, as well as substitutions, within a protein sequence, and with this method, we identified on average 1.44 short sequences per protein that were highly conserved and found within intrinsically disordered regions— these included 30% of previously identified short linear motifs in disordered regions.
When our highly conserved sequences matched known consensuses of short linear motifs, such as the FG motif for interaction with karyopherins, the cyclin-dependent kinase (CDK) consensus phosphorylation site motif, and the KEN box for ubiquitin-mediated protein degradation, we found statistically significant enrichment of proteins known to be regulated by these short linear motifs. We experimentally verified a previously unknown KEN box in the yeast protein Spt21. Furthermore, unsupervised clustering of our conserved sequences on the basis of sequence similarity identified hundreds of motif clusters, many of which were enriched for functional annotations. Of the top clusters we examined about 60% corresponded to known patterns of short linear motifs, whereas the others represent putative newly identified patterns. We identified one such cluster that was enriched for interacting proteins of the kinase Cbk1, which is a member of the nuclear dumbbell forming 2 (Dbf2)–related (NDR) subfamily of the large tumor suppressor (LATS) family of kinases, and showed that the predicted motif mediated a physical interaction with that kinase. Finally, we analyzed hub proteins and showed that they contain a higher density of short conserved sequences when compared to the rest of the genome, suggesting that their centrality in protein interaction networks may be facilitated by an overabundance of short linear motifs.
Results
A phylo-HMM approach can identify short conserved sequences in proteins
Posttranslational regulation of protein activity is often mediated through short linear motifs that are often present within disordered regions (12, 23). Although these motifs share a common pattern or consensus that is important for their function, they are frequently short and may contain positions that have highly flexible amino acid preference. Thus, pattern matches are expected to occur frequently in random protein sequences, with most matches not corresponding to biologically relevant motifs. It has been suggested that correspondence with biological function can be improved by searching for motifs that are also conserved over evolution (24, 25). For our analysis of the S. cerevisiae proteome, we chose related species that have syntenic gene orthologs and are thought to have diverged 100 million to 200 million years ago (26).
We developed a phylo-HMM-based computational framework to systematically detect conserved short linear motifs in unstructured regions in multiple sequence alignments (Fig. 1A). We hypothesize that functionally important short linear motifs will be preferentially conserved such that substitutions and insertions or deletions will occur more frequently adjacent to the motif than within it (27). It therefore follows that the amino acids in each multiple sequence alignment column fall into two classes: the conserved class and the background class. The conserved class represents those amino acids with a slow rate of evolution corresponding to the preferentially conserved motif (Fig. 1B and fig. S1, “Conserved,” rate = αc), and the background class represents those with a faster rate of evolution, corresponding to divergent, functionally less important sequences (Fig. 1B and fig. S1, “Background,” rate = αW). We compared the substitution and insertion or deletion rate in each column with the overall rate in a window of surrounding amino acids (Fig. 1B). We then used a statistical approach based on a phylo-HMM to compute the probability (the posterior probability) that each multiple sequence alignment column (Fig. 1B, framed in green) is within the preferentially conserved class. The posterior probability approaches 1 as segments increase in relative conservation or as the number of consecutively conserved residues increases. When the phylo-HMM approach was previously applied to analyze DNA conservation, only substitutions were considered. Because insertion and deletion events are common in disordered regions, we have modified the phylo-HMM approach to include these events as well (Fig. 1B, vertical black bars separating gray highlights; see Materials and Methods).
Fig. 1.

Schematic of the phylo-HMM approach. (A) Flowchart of the computational framework to detect conserved short linear motifs in disordered regions of multiple sequence alignments. (B) The rate of evolution for an alignment column (framed in green) is compared to a rate of evolution over a window (w) adjacent to the column. The probability that the column is within the preferentially conserved class is computed. The framework takes advantage of the amino acid substitutions inferred in columns of the alignment and the pattern of insertions and deletions (illustrated as gray highlights) in blocks of the multiple sequence alignment (separated by vertical black lines). (C) A posterior probability trace of the region 1 to 110 in the alignment of Sic1 (corresponding to amino acid positions 1 to 100 in S. cerevisiae). Four strongly conserved segments are detected by the phylo-HMM approach and these overlap with experimentally reported phosphorylation sites in Sic1 (indicated by stars), which are required for Cdc4 binding. The intensity of the red color represents the posterior probability of the conserved state.
To illustrate this method we plotted the posterior probability as a function of alignment position (a “probability trace”) for the disordered N terminus of Sic1, which contains experimentally verified phosphorylation sites necessary for binding to the E3 ubiquitin ligase adaptor protein Cdc4 (28, 29). The probability trace showed clear and specific peaks in the N terminus of Sic1 (Fig. 1C), and these peaks corresponded to five of the six known phosphorylation sites (28). In sequences lacking known motifs, such as a segment of the transcription factor Swi5, the posterior trace often was flat, despite variation in the local rate of protein evolution (fig. S2).
Short conserved sequences predicted by the phylo-HMM contain known motifs
Using the phylo-HMM, we performed a proteome-wide prediction of short conserved sequences in S. cerevisiae and identified on average 1.44 short conserved sequences passing our threshold per protein (see Materials and Methods, Fig. 1A, and table S1). To assess whether these short conserved sequences were biologically relevant, we analyzed a set of 352 literature-curated short linear motifs found in disordered regions (table S2; see Materials and Methods for criteria). Although the phylo-HMM predicted short conserved sequences for only ∼5% of residues in disordered regions, 104 (30%) of the literature-curated short linear motifs were among the predictions.
We searched our conserved sequences for matches to known patterns of short linear motifs. In an in vitro kinase assay, of the 695 proteins with at least one Cdc28 phosphorylation site matching the consensus sequence ([ST]Px[RK]), only 185 were phosphorylated by an analog-sensitive mutant of Cdc28, a CDK (30). (Note that in motif sequences, letters in brackets represent preferred residues for a particular position, and x represents any amino acid.) Thus, simply having a consensus phosphorylation site is not sufficient to predict Cdc28 substrates. Our phylo-HMM identified 40 proteins containing a short conserved sequence that matched the Cdc28 consensus pattern, and 32 of these were positive in the in vitro kinase assay (30), which is a significant enrichment (32 of 40 versus 185 of 695, P = 1.4 × 10⁻¹¹, Fisher's test; table S3). Of the 8 remaining proteins identified by the phylo-HMM, 1 of those (Cdc15) includes consensus sites phosphorylated in vivo (31), and 2 are targets of kinases that can phosphorylate the canonical Cdc28 consensus sequence—Rim15 phosphorylated by Pho85 (32) and Fus2 phosphorylated by Fus3 (33). Thus, 80% of the proteins identified by the phylo-HMM as containing conserved sequences matching the canonical Cdc28 consensus pattern are likely to be substrates of this kinase or other kinases that recognize the same or similar consensus sequences.
The FG motif pattern (Phe-Gly), which is a canonical motif of common nuclear pore complex (NPC) proteins and may be important for trafficking of proteins through the nuclear pore (34), is found in unstructured regions of these proteins (34). Thirteen components of the NPC have been reported to contain FG repeats (33), seven of which can be further classified into variants including the FxFG and GLFG motifs (34). Using the phylo-HMM, we found 59 proteins in the yeast proteome with at least one conserved FG dipeptide. These included 12 of the previously known FG-containing NPC proteins. Because FG consensus matches are found in 3438 yeast proteins, this is a significant enrichment (12 of 59 versus 13 of 3438, P = 7.21 × 10⁻¹⁶, Fisher's test; table S3). Searches in the yeast proteome for the more specific variants (FxFG and GLFG) yielded six of seven nucleoporins that contain these variant FG motifs.
Of the 59 proteins identified as having a conserved FG dipeptide by the phylo-HMM, one of these was Ndc1, which is localized to the nuclear envelope and required for nuclear pore assembly (35, 36), but had not previously been recognized as having an FG motif. The remaining 46 proteins identified by the phylo-HMM analysis are not components of the NPC but nevertheless contain a short conserved sequence that matches the minimal FG motif pattern. Because the motif occurred either within known repeat sequences or in proteins that have roles in protein transport and sorting, we believe that the conserved sequences containing an FG dipeptide in the remaining 46 proteins are likely functional. For example, we identified both Sla1 and Pan1, members of the actin cytoskeleton-regulatory complex, as having the FG motif, and the motif in Sla1 is within the functionally important C-terminal repeat region (37). Other proteins related to protein transport and sorting that we identified as having the conserved FG dipeptide included Vps15, Ede1, Ent3, Ent5, Pga2, and Glo3. Thus, rather than being limited to nuclear transport, the FG dipeptide motif may function more broadly in protein transport.
We also identified proteins in the S. cerevisiae proteome with a conserved KEN box [a degradation signal that is recognized by the anaphase-promoting complex/cyclosome (APC/C)] (38). The KEN box acts as a binding site for the APC/C and marks target proteins for degradation in different phases of the cell cycle. The phylo-HMM analysis identified only 10 proteins with a conserved KEN sequence (table S3). Eight of those contained an experimentally verified KEN degradation signal (39, 40), were characterized targets of the APC/C (41, 42), or were cyclins, including Clb2, which contains a verified KEN sequence (43). The two remaining motifs matching the KEN signal are found in Spt21 and Sgd1, neither of which has been associated with the APC or reported to exhibit cell cycle– regulated degradation (table S3). We noticed that the conserved KEN box in Spt21 was followed by a conserved proline, which is also conserved following the KEN motif in Clb2 (Fig. 2A) and Mad3 (40), suggesting that the proline may confer additional binding specificity beyond the KEN residues. The presence of a proline after the KEN motif has been reported to mediate more efficient APC/C-mediated degradation of mammalian proteins with KEN boxes (44).
Fig. 2.
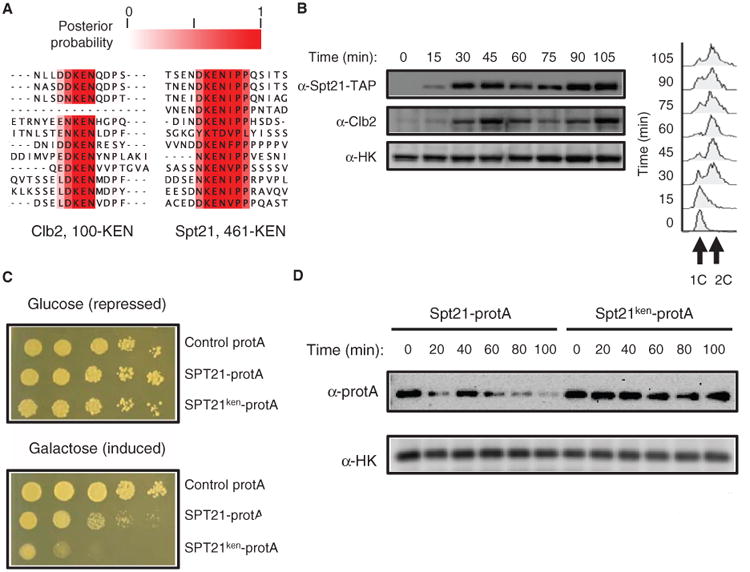
A KEN box identified by the phylo-HMM approach in Spt21 mediates protein degradation. (A) Alignments of the previously characterized Clb2 KEN box degradation signal alongside the predicted KEN box in Spt21. Numbers indicate residue position within the S. cerevisiae protein sequence. (B) Left panel is a Western blot showing that the amount of SPT21-TAP varies within the cell cycle and, like Clb2, is absent in G1. Endogenous hexokinase (HK) served as the loading control. Pearson correlation coefficient between the normalized amount of Spt21 and the normalized amount of Clb2 was 0.89 and 0.87, respectively, in two independent experiments. Right panel shows FACS analysis as additional validation of cell cycle progression. (C) Spotted serial dilutions of strains overexpressing protA-tagged wild-type (SPT21) or KEN box mutant (SPT21ken) show a stronger fitness defect with overexpression of the KEN box mutant. (D) Western blot analysis shows that mutation of the KEN box stabilizes Spt21. Wild-type (SPT21) and KEN box mutant (SPT21ken) expression was induced in galactose medium for 4 hours. Glucose was added to attenuate protein expression, and protein synthesis was abolished through the addition of cycloheximide. HK was used as a loading control. Results shown are a representative blot from three independent experiments (two with the protA tag and one with the GST tag). The time points after 60 min had P values <0.05 (t test, n = 3) when comparing the normalized abundance of the wild-type to the KEN box mutant.
To confirm the in silico analyses, we experimentally tested whether the identified KEN sequence in Spt21 served as a degradation signal (Fig. 2A). Spt21 is a protein that promotes transcription of the genes encoding the HTA2 and HTB2 histones, and transcription of the gene encoding Spt21 is cell cycle–regulated (45). We found that the amount of Spt21 coincided with the amount of Clb2, a protein that exhibits changes in abundance during the cell cycle (Fig. 2B), which indicated that, as at the level of mRNA (46), Spt21 protein abundance varied over the cell cycle.
Many proteins have multiple means of regulation, and degradation by the APC/C may act as an additional layer of control, especially because overexpression of Spt21 is deleterious (47). Given this cell cycle regulation and the toxicity of overexpression, we reasoned that if the KEN sequence is a biologically relevant degradation signal, then overexpression of a KEN mutant form of Spt21 would be more toxic than a wild-type form. We mutated the three consecutive KEN amino acids to alanines (Spt21ken) and performed serial spot dilution assay to assess growth fitness. Growth was more severely impaired by Spt21ken overexpression than by overexpression of the corresponding Spt21 control (Fig. 2C). To confirm that the KEN box served as a degradation signal, we assayed changes in protein abundance of Spt21 and Spt21ken through the cell cycle by overexpressing the proteins with the GAL promoter followed by shutting off both transcription and translation (see Materials and Methods). The abundance of the KEN mutant form remained high, whereas the abundance of wild-type Spt1 decreased over time (Fig. 2D). These results suggested that the conserved KEN sequence in Spt21 is important for the cell cycle–dependent degradation of this protein.
The evaluation of the KEN box, FG motif, and Cdc28 phosphorylation consensus sites provided evidence that the phylo-HMM approach can predict biologically relevant, short conserved sequences. However, it is possible that many of the remaining predicted motifs in the yeast proteome were identified by the phylo-HMM because they have not sufficiently diverged or because alignment errors led to overestimation of the conservation of residues. To address the possibility of these computational artifacts, we performed extensive simulations of protein evolution (see Materials and Methods), which indicated that such artifacts occurred in alignments of disordered regions at a rate of 1 in 9000 amino acids (fewer than 1 in every 50 proteins examined). Another possible source of error in our classification of disordered regions may be the inclusion of larger protein domains within our disordered regions. However, 63% of the predicted short conserved sequences are within regions of at least 50 disordered amino acids, which are unlikely to be protein domains. Along with the strong enrichment of functional Cdc28 consensus sites, FG motifs, and KEN boxes, this low rate of computational artifacts indicated that short conserved sequences identified by the phylo-HMM likely represent functional elements within unstructured regions.
Known and previously unknown sequence patterns are uncovered by clustering the short conserved segments by sequence similarity
We found that many proteins contained short conserved segments that did not match any known sequence patterns, and thus, these may represent previously unknown short linear motifs. Conservation in distantly related species would support the biological relevance of these previously unknown motifs and would indicate that these are not computational artifacts and are biologically important.
For example, we found a previously unknown motif in the C terminus of the Dbp6 putative adenosine triphosphate (ATP)-dependent DEAD box RNA helicase (48) that is conserved in plants, yeasts, and humans (Fig. 3A). If this short conserved sequence is part of a biologically relevant, previously unidentified motif pattern, we reasoned that similar short conserved sequences should also be found in other proteins, possibly with shared functions. Dbp6 is required for ribosome biogenesis, and we identified a similar highly conserved short segment in the yeast protein Utp25, which is a DEAD box RNA helicase-like protein also related to ribosome biogenesis (49). These sequences all match the pattern YxxxLxxL, and the motif is conserved in distant orthologs for these proteins (Fig. 3B); therefore, we speculate that YxxxLxxL may represent an essential short linear motif pattern found in the unstructured regions of proteins involved in ribosome biogenesis.
Fig. 3.

Predicted motifs are conserved in distant species. (A) Alignment region of the predicted YxxxLxxL motif in Dbp6 shows conservation of the motif among eukaryotic orthologs. Distant species comparison is shown with a phylogenetic tree. Branch lengths are not to scale. (B) Alignment of the predicted YxxxLxxL motif in Utp25 with its human ortholog.
To determine whether other previously unknown patterns were identifiable in our data set, we used an unsupervised graph-clustering algorithm [MCODE (50)] to group conserved sequences into motif patterns on the basis of their sequence similarity without regard as to which protein contained these motifs (see Materials and Methods). This type of analysis can be visualized by a graph in which conserved sequences are represented as nodes, edges correspond to sequence distance, and groups of highly interconnected nodes (detected by the graph-clustering algorithm) correspond to motif patterns (Fig. 4A).
Fig. 4.
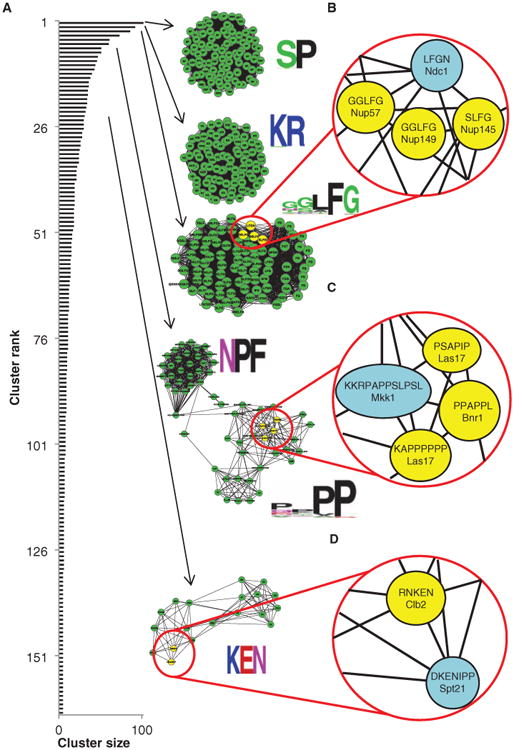
Known short linear motif patterns are recovered by cluster analysis. (A) Distribution of cluster sizes (black bars) and examples of highly interconnected motifs identified in the cluster analysis that represent known sequence patterns (green clusters). Beside each cluster is a graphical representation of the specificity of the motif. (B) A close-up representation of the FG motif cluster shows interconnection between known FG motifs in nuclear pore proteins (highlighted in yellow) and an uncharacterized FG motif in Ndc1 (highlighted in blue). (C) A close-up representation of the P-rich motif cluster shows interconnection between a putative SH3-binding peptide (in Mkk1, highlighted in blue) and known SH3-binding peptides (in Las17 and Bnr1, highlighted in yellow). (D) A close-up representation of the KEN motif cluster shows connection between the previously uncharacterized KEN motif in Spt21 (highlighted in blue) and an experimentally verified KEN motif in Clb2 (highlighted in yellow). See table S4 for a complete list of the proteins identified in each highlighted cluster.
For one set of clustering parameters, this procedure yielded 282 clusters covering 41% of the predicted sequences, with 38 large clusters containing at least 20 short conserved sequences, representing 21% of the predicted sequences, and 45 smaller clusters containing between 10 and 20 conserved sequences, each representing ∼9% of the predicted sequences (Fig. 4 and tables S4 and S5). As expected, this uncovered previously described consensus sequences for short linear motifs, such as an SP/TP cluster (proline-directed kinase consensus), a GLFG cluster, and a KEN cluster (Fig. 4). These three motifs corresponded to the patterns described above, and the proteins containing these motifs were enriched in the expected function (see Materials and Methods). For example, the GLFG cluster was enriched in proteins having a nuclear pore subcellular localization (9 nuclear pore–localized proteins of 16 proteins in cluster versus 46 nuclear pore–localized proteins of 5884 proteins in the yeast proteome, P = 2.9 × 10⁻¹⁵, Fisher's test), whereas the proteins in the SP cluster were enriched for cell cycle process (32 of 88 versus 520 of 5884, P = 2.4 × 10⁻¹ 2, Fisher's test). The SP cluster was the largest identified in our analysis (Fig. 4A and table S4), likely containing phosphorylation sites for many different proline-directed kinases (including the cell cycle kinases Cdc28 and Pho85), which suggested that the most frequently observed conserved short sequences in disordered regions in yeast are consensus phosphorylation sites.
Other clusters matching known consensus sequences included the NPF cluster, a motif found in EH domain interacting proteins (51), which was enriched in endocytosis-related proteins (7 of 20 versus 59 of 5884, P = 1.09 × 10⁻⁹, Fisher's test); a KR cluster, which is a signature of nuclear localization signals (52, 53) and was enriched in proteins identified in the nuclear compartment (70 of 88 versus 2077 of 5884, P = 4.3 × 10⁻¹⁷, Fisher's test); and a cluster of proline-rich sequences that resemble binding sites for peptide-binding domains, such as SH3 (Src homology 3) and WW (54). This cluster contained known SH3-binding proteins, such as Las17 (55), and predicted the presence of an uncharacterized proline-rich binding site in the mitogen-activated protein kinase kinase Mkk1.
We repeated the cluster analysis with different parameter settings (see Materials and Methods and tables S4 and S5) and searched for clusters representing motif patterns that to our knowledge are uncharacterized but had strong enrichment in functional annotations (Fig. 5, A to C). With this analysis, we identified an NPY cluster, which may be related to the NPF motif and was enriched in vesicle and nuclear membrane proteins and enriched in proteins associated with protein transport process (7 of 12 versus 419 of 5884, P = 5.64 × 10⁻⁶, Fisher's test). We also identified an FxDSF[RK]R motif, which was present in many amino acid permeases (6 of 8 versus 36 of 5884, P = 2.5 × 10⁻¹², Fisher's test), and those permeases that contained this motif also had a C-terminal palmitoylation motif, FWC (56). Finally, we identified a [YF][KQ]FP motif (also referred to as FxFP), which was found in Cbk1-interacting proteins (57, 58) (4 of 6 versus 27 of 5884, P = 9.4 × 10⁻⁹, Fisher's test).
Fig. 5.
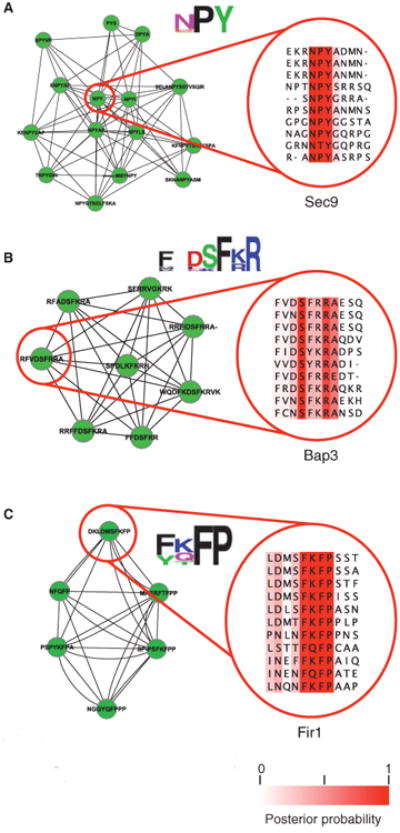
Previously unknown short linear motif patterns are predicted by cluster analysis. This figure shows representative examples of highly interconnected motifs that represent uncharacterized sequence patterns. (A) The NPY motif cluster consists of proteins enriched in vesicle and nuclear membrane proteins related to protein transport. We show an example aligned segment from Sec9 at positions 231 to 234. (B) The FxDSF[KR]R motif cluster consists of proteins enriched in amino acid permease function. We show an example aligned segment from Bap3 at positions 56 to 61. (C) The FxFP motif cluster consists of proteins enriched in Cbk1 kinase targets. We show an example aligned segment from Fir1 at positions 416 to 419. See table S4 for a complete list of the proteins identified in each cluster.
Of these uncharacterized putative consensus sequences, we focused on the [YF][KQ]FP motif (Fig. 5C). This cluster was enriched for proteins that interact with the kinase Cbk1 (57, 58) and contained two known Cbk1 substrates, Ssd1 and Ace2 (59, 60) (Table 1). The [YF][QK]FP pattern is not similar to the known Cbk1 phosphorylation site consensus (60) but is similar to the reported kinase docking motif (FxFP) for the extracellular signal–regulated kinases (ERKs) in mammals (61). This docking motif facilitates kinase-substrate recognition by specific binding of the substrate to a docking site on the kinase domain that is distinct from the catalytic site (62). Therefore, we hypothesized that this motif was important for the physical interaction of the kinase with its substrates. To test this, we fused fragments containing the conserved sequences to maltose-binding protein (MBP) and assayed binding to Cbk1 in a pull-down assay (see Materials and Methods). We detected reproducible binding with five of six tested peptides (Fig. 6), indicating that the peptide fragments containing the newly identified [YF][KQ]FP motif interacted with Cbk1.
Table 1.
Members of the FxFP cluster. Unsupervised clustering of the conserved sequences revealed a cluster enriched for Cbk1 inter-actors and contained two known Cbk1 kinase targets (underlined). ORF, open reading frame.
| ORF | Gene name | Start | Stop | Sequence |
|---|---|---|---|---|
| YLR131C | ACE2 | 280 | 288 | NGGYQFPPP |
| YNL042W | BOP3 | 152 | 159 | PSPYKFPA |
| YER075C | PTP3 | 371 | 375 | NFQFP |
| YDR293C | SSD1 | 231 | 239 | SPPSFKFPP |
| YER032W | FIR1 | 410 | 419 | DKLDMSFKFP |
| YIL129C | TAO3 | 1 | 9 | MASRFTFPP |
Fig. 6.
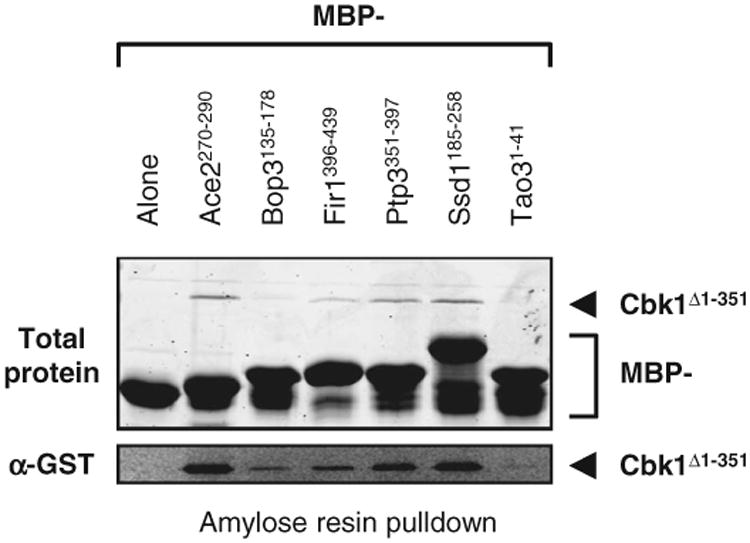
FxFP peptides interact with the Cbk1 kinase domain. Fragments from proteins identified in the FxFP cluster were expressed as MBP fusions and immobilized on amylose resin. The beads were assayed for binding to GST-tagged Cbk1 (Cbk1Δ1-351) in a pull-down assay. Binding was detected by Western blot for all six protein fragments tested, while MBP alone could not pull down Cbk1 (lower panel). Shown is a representative blot from three independent experiments. See fig. S6 for a shorter exposure of the blot that shows the loading control.
Protein hubs show higher density of short linear motifs
One hypothesis for the existence of unstructured regions is that they serve as regulatory hubs where multiple regulatory motifs can act in a concerted way to finely regulate function and interaction (11, 12). This model is consistent with the idea that unstructured regions can undergo multiple different transient structural configurations to accommodate the multiple regulatory sequences (5). Proteome-wide analyses of protein-protein interactions (63, 64) have revealed a small number of “hub” proteins that interact with many partners (65). Because protein-protein interactions are often mediated by short linear motifs, we analyzed the short conserved sequences in a high-confidence set of hub proteins (66).
Using our definition of unstructured regions, we found consistent with previous studies (11, 67), that hub proteins had significantly more large segments (≥30 amino acids) of disordered amino acids (13% increase, P = 0.0009, Poisson distribution, Fig. 7A). Thus, relative to the entire proteome, hub proteins should contain more predicted short linear motifs per protein because they have more disordered regions. Indeed hub proteins contained significantly more predicted short conserved sequences per protein (46% increase, P = 2.8 × 10⁻¹², Poisson distribution). However, the increase in short conserved sequences was not due only to the fact that hub proteins contained more large segments of disordered amino acids: We found that hub proteins had a significantly higher density of short conserved sequences per amino acid (29% increase in disordered regions of ≥30, P = 1.83 × 10⁻¹², Poisson distribution; Fig. 7B), indicating that these short conserved sequences may mediate their high degree of connectivity. Thus, the centrality of hub proteins to interaction networks may, in part, be due to their high prevalence of short linear motifs.
Fig. 7.

Hub proteins are enriched in short conserved sequences. (A) The frequency of long regions of disordered amino acids (AA) (≥30) for hub proteins is higher than for the rest of the genome. (B) The number of predicted conserved sequences per amino acid that are present in long regions of disordered amino acids (≥30) is higher for hubs than the genome. Error bars represent the 95% confidence interval obtained by nonparametric bootstrapping.
Discussion
Although unstructured regions are ubiquitous in eukaryotic proteomes, it is difficult to identify the critical functional residues within them. For example, despite detailed characterization of Utp25 (49), using the phylo-HMM approach, we identified a short sequence in disordered regions of this protein. This sequence was conserved in all eukaryotes but had not been previously characterized. Systematic application of the phylo-HMM approach to the yeast proteome identified on average 1.44 short conserved sequences per protein, totaling about 5% of the unstructured amino acids. Proteins containing known sequences showed strong functional enrichment, suggesting that the conserved sequences are involved in specific biological functions. Because the false-positive rate was 1 in 9000 unstructured amino acids, we only expect about <1% or 70 of the thousands of identified short sequences to be false positives, resulting from computational artifacts. However, in many individual cases, we are confident that the identified sequences are important, because the motif is conserved across divergent species, representing a long evolutionary period. For example, the previously uncharacterized KEN motif in Spt21 is conserved in its orthologs within the Candida clade, and the Cbk1-interacting motifs in Ssd1p are conserved even further within the Ascomycetes (fig. S3). Although many short linear motifs are well conserved, other functional sequence segments may be species-specific, or they may not have been captured by our analysis (for example, the phylo-HMM approach that we used does not detect motifs embedded in large conserved protein fragments because these large regions are excluded from the analysis). Consequently, the short linear motifs predicted in this study only provide a lower bound of the number and frequency of these motifs in unstructured regions. Because 30% of the known characterized short linear motifs in disordered regions in our data set were predicted by the phylo-HMM, and because our phylo-HMM identified short conserved sequences totaling about 5% of the unstructured amino acids, we estimate that short linear motifs correspond to roughly 17% of the unstructured amino acids in yeast proteins.
Our approach for identifying short linear motifs is different from other computational methods designed for this goal (68). Two other bioinformatic approaches involve either the classification of matches to a known consensus (69) or the prediction of a consensus given known co-regulation (20, 70–73), both of which rely on previously obtained experimental data. Other structure-based methods, such as ANCHOR (74), identify disordered regions that have the propensity to become ordered upon binding. Our phylo-HMM approach requires only the evolutionary relationship between genes and that regulatory function is preserved in most of the species considered. Therefore, our study is complementary to previous methods and opens the framework of phylogenetic footprinting (75, 76) (a method to identify functional elements in noncoding DNA by exploiting evolutionary conservation) to protein sequences. Because this analysis requires only sequence information from orthologous proteins, it can be applied in many clades for which these data are now available (77, 78). However, the success of the phylo-HMM approach is directly related to the choice of species and their evolutionary distance. Computational artifacts increase at short evolutionary distances (fig. S4D), whereas biologically relevant motifs may no longer be conserved at the same position at very long evolutionary distances and, therefore, will not be detected (fig. S5). In general, the performance of the phylo-HMM approach can be assessed by simulations of molecular evolution where conserved motifs have been inserted and by analysis of previously characterized short linear motifs. Another important issue concerning the performance of the phylo-HMM approach is that the posterior probability output depends on both the length of the conserved segment and its relative conservation compared with the background evolutionary rate. Therefore, the predictions with the highest posterior probability tend to be longer regions (more than five amino acids), which we speculate may be high-specificity biomolecular binding sites. Equally important short linear motifs may be very short (about two amino acids) and will tend to have lower posterior probabilities.
Because our analysis is independent of functional data, it led to the discovery of important elements from the sequence data without attaching any specific function to the results. Although we could propose functions for some previously unknown motif patterns through enrichment analysis for biological processes, in other cases we also observed clusters that matched known sequence patterns but were not present in proteins enriched in the expected function. For example, we identified the well-characterized acidic dileucine ([DE]xxxL[LI]) motif (table S5) found in transmembrane proteins of endosomes and lysosomes in metazoans or in yeast vacuolar proteins (79) in one of our clusters. However, the proteins forming this cluster were not significantly enriched for any particular compartment, even though it includes the experimentally verified acidic dileucine motif from Vam3, a vacuolar t-SNARE (80). We speculate that the conserved motifs in this cluster likely serve other functions. Even when functional enrichment of a cluster can be found, the function of the motif cannot always be ascertained. Despite these potential difficulties in assigning functional relationships, our unbiased methods (prediction of conserved sequences and the clustering analysis) were successful in discovering an interaction motif for the NDR/LATS kinase member Cbk1. We speculate that some sequence patterns, such as the newly identified motif for Cbk1 interaction, are associated with only one function, whereas others such as the acidic dileucine motif and the FG dipeptide are involved in multiple processes.
Our analysis suggested that intrinsically disordered regions contain large numbers of functional sequences that are involved in protein regulation and interaction, and this may partly explain the prevalence of disordered regions. Consistent with the hypothesis that the functional sequences may contribute to protein interactions, we observed a higher density of predicted short linear motifs in hub proteins, which is consistent with previous reports that the disordered regions in hub proteins are particularly important for their interactions (11, 66). The observation that the increase in conserved sequence density (29%) (Fig. 7B) is greater than the increase in disordered segments (13%) (Fig. 7A) suggests that the conserved sequences identified by the phylo-HMM approach are more indicative of hub functions than the presence of disordered regions alone. We found no differences in the types of conserved motifs in disordered regions of hub proteins when compared to the rest of the genome, indicating that there are no specific “hub motifs,” nor any differences in conserved sequence density between “date” and “party” hubs (66) (date hubs, 1.535; party hubs, 1.520, per 100 amino acids in disordered regions ≥30 amino acids). Instead, these highly connected proteins simply have more functional sequences within their disordered regions than do proteins that are not hubs. Given the importance of protein regulation and interaction to cellular physiology (14) and an increasing appreciation of its importance in evolution (81, 82), disordered regions seem poised to play a critical role in these contexts.
Materials and Methods
Alignment of related species of yeasts
Protein sequences from 13 related species of yeasts [S. cerevisiae, Saccharomyces paradoxus, Saccharomyces mikatae, Saccharomyces bayanus, Candida glabrata, Saccharomyces castellii (now renamed to Naumovia castellii), Kluyveromyces polysporus (now renamed to Vanderwaltozyma polyspora), Zygosaccharomyces rouxii, Kluyveromyces lactis, Ashbya gossypii, Kluyveromyces waltii (now renamed Lachancea waltii), Kluyveromyces thermotolerans (now renamed Lachancea thermotolerans) and Saccharomyces kluyveri (now renamed Lachancea kluyveri)] were obtained from the Saccharomyces Genome Database (SGD) (83) and the Yeast Genome Order Browser (26). These species were chosen because of the high quality of the sequence information and of the annotation associated with each gene or protein. Orthologous genes were aligned with MAFFT (84) at automatic settings. Branch lengths for the species tree (26) were obtained by 10 replicates of 50 random concatenations of orthologous genes and analyzed with PAML v3.15 (85). Analysis showed that the expected substitution per site for these alignments was 3.189. We aligned 5121 proteins from S. cerevisiae to at least one of the related species.
Conservation of motifs over more distantly related orthologs was performed with sequences from the Fungal Orthogroup Repository (86) and the Princeton Protein Orthology Database (87) or with BLASTP (88) on the uniref90 database (89). Other species analyzed were Candida lusitaniae, Debaryomyces hansenii, Candida guillermondii, Candida tropicalis, Candida albicans, Candida parapsilosis, Lodderomyces elongisporus, Pichia stipitis, Yarrowia lipolytica, Uncinocarpus reesii, Aspergillus niger, Penicillium chrysogenum, Sclerotinia sclerotiorum, Schizosaccharomyces pombe, Caenorhabditis elegans, Drosophila melanogaster, Danio rerio, Gallus gallus, Mus musculus, Rattus rattus, Homo sapiens, Dictyostelium discoideum, and Arabidopsis thaliana.
Creation of a two-state phylo-HMM
Our two-state phylo-HMM (fig. S1) has a rate parameter associated with each state: one for the background (αw = background rate of evolution) and one for the conserved segment (αC = conserved rate). The local rate of evolution is the maximum likelihood estimate within a window (w = 21), which was obtained by gradient ascent. The conserved rate of evolution was set to be the smaller of (i) one-third of the local rate of evolution or (ii) the maximum likelihood rate estimate at that column. These rates are then used to obtain the likelihood of the data under specific models of protein evolution, and the phylo-HMM then outputs a posterior probability of the conserved state at a particular column.
We used Felsenstein's algorithm (90, 91) to calculate the likelihood of the data [P(data|tree)] with an empirical amino acid substitution matrix obtained from the four closest related species of yeasts: S. cerevisiae, S. paradoxus, S. mikatae, and S. bayanus. The tree used was the species tree described above (fig. S7), where the branch lengths were scaled by the rate of evolution for each HMM state. The likelihood of the substitution process is therefore
where m is the number of alignment columns and the tree indicates the phylogenetic relationship between species (fig. S7). α is the rate of evolution, which scales the branch lengths, and x represents the amino acid sequences in the alignment.
One of the assumptions of the traditional probabilistic approaches to protein evolution (such as the phylo-HMM) is that every amino acid column in an alignment can be treated as independent (90). Because insertions or deletions do not follow this assumption (they can span multiple residues), most current phylogenetic models account only for residue substitutions (90, 92). Gaps are usually ignored in phylogenetic analyses. Because short linear motifs occur often in unstructured regions that tend to create gapped regions in alignments, ignoring gaps would be a considerable problem in our analysis. Probabilistic models accounting for gaps have been proposed (92), but their complexity and incompleteness have motivated us to create another simpler model. In our protein evolution model, blocks of gaps (illustrated as vertical black lines in Fig. 1B) are treated as insertion or deletion events. We consider a gap process that operates on one block at a time, contrasting with the substitution process that operates on one column of an amino acid alignment at a time. The two processes are considered independently and combined at the end. Having assigned each insertion or deletion as a contiguous block, we can obtain the likelihood of the gap process:
where b is the number of blocks and k the length of each block, which follows an empirically derived power law distribution (93). In this likelihood, the substitution matrix consists of only two characters (gap or amino acids) and is calculated similarly as before (fig. S1). Therefore, yj• represents the pattern of gap characters and amino acid characters of the jth block in the alignment.
The total likelihood of an alignment can then be written as
The HMM requires a likelihood for each alignment column. Therefore, we distributed uniformly the gap likelihood of each block to its alignment columns (xi is within yj). The likelihood of a single alignment column is therefore
To find regions in alignments that are conserved we then computed the posterior probability of the conserved state with the likelihood of single columns and the forward and backward algorithm (90). Because the insertion or deletion lengths do not depend on the evolutionary rate, the likelihoods given by the empirically derived power law distribution are canceled in the calculation of the posterior probability. This means that, for our method the appearance and disappearance of insertions and deletions over the phylogenetic tree modeled as “blocks” are the sole contributor of insertion and deletion likelihoods in the final posterior probability. Transition frequencies between states were obtained with the expectation-maximization procedure described by Baum-Welch (90).
We used multiple heuristics on the posterior probability to find peaks corresponding to short conserved residues. First, the analysis ignored the first three residues of the alignment because the conserved methionine is usually aligned by MAFFT. Second, peaks were found by initially finding regions above a threshold of 0.2. These peaks were later pruned if the maximal posterior threshold within the region was lower than 0.6 or if they did not fit the desired size (2 to 20 amino acids). Although peaks longer than 20 amino acids were rare because we calculated the local rate of evolution with a window of size 21, we excluded these signals because we did not consider them representative of typical short linear motifs.
We visualized the alignments with Jalview (94); red color intensity represented the posterior probability, and full color intensity indicated a posterior probability of 1.
Defining unstructured regions
To find functional segments in unstructured regions of proteins, we used several filters to select regions of interest (unstructured regions) and to remove regions that may be conserved due to chance or as a property of the alignment program. We used DISOPRED2 (95) to remove structured regions from proteins, as well as pFilt (96) for coiled coils. Large repetitive regions were removed with the SEG algorithm (97). If long domains were interspersed with short highly degenerate sequences, these were not captured by any of the above filters, so we also removed regions of high conservation that were longer than 20 amino acids. Overall, of the total length of yeast proteins with orthologs, 24% of the amino acids passed all our filters.
Analysis of literature-curated short linear motifs
To estimate the effectiveness of our approach in identifying previously known short linear motifs, we identified 526 characterized short linear motifs in budding yeast by performing literature searches for known post-translational regulatory proteins and detailed reading of the primary literature and determined how many of these were correctly identified by the phylo-HMM. The modifications were mostly phosphorylation sites but also included degradation signals, localization signals, interaction motifs, and SUMOylation sites (table S2). Of these, 352 were found in regions that passed our filters for classification as disordered and of these 352 (346 that did not overlap with another motif), we considered 123 (119 that did not overlap with another motif) conserved such that they could be identified (by consensus sequences within a window of six amino acids or by eye for localization signals) in at least 90% of the orthologous proteins.
Our phylo-HMM approach predicted 104 (or 30% of the 346 motifs that were classified as disordered) of the motifs present in disordered regions. However, because the underlying assumption of the phylo-HMM is that the motifs are fully conserved we do not expect this method to find a large portion of the regulatory elements that may diverge over long evolutionary distances. Consistent with this, the phylo-HMM predicts 75 (or 63% of the 119 motifs that were classified as disordered and conserved) of the conserved motifs (table S2 and fig. S5).
Simulations of protein evolution
To address the issue of computational artifacts resulting from misalignment in distant species and to low sequence divergence, we performed simulations of protein evolution. In our simulations, an ancestral protein is randomly generated and evolved through point mutations, insertions, and deletions according to the desired phylogenetic tree. Proteins contained three regions (see fig. S4A for an example): the first region (on average, 75 amino acids) and third region (on average, 87.5 amino acids) evolved at a “background” rate (the average rate of yeast proteins) or at 70 or 130% of this rate. The first region contained a single simulated short sequence (two to nine amino acids) that evolved at a slow rate that we varied between 2.5 and 100% of the background rate. The second region (on average, 75 amino acids) evolved slowly to simulate a conserved protein domain. Because unstructured regions often include gaps from insertions and deletions, we modeled the simulations such that the evolved proteins also evolved insertions or deletions of various sizes (k) following an empirically derived power law distribution with z = 1.5 (93) in
We aligned the simulated protein sequences with MAFFT (84) (fig. S4A). We performed 100 simulations per data point.
We assessed alignment and prediction accuracy with simulations performed with different background rates of evolution. We plotted the accuracy of the alignment (fig. S4B, fraction of simulated motifs with correct motif alignment), sensitivity of the phylo-HMM (fig. S4C, fraction of simulated motifs that were predicted by the phylo-HMM), and rate of computational artifacts (fig. S4D, number of predictions that do not correspond to a simulated motif per 100 unstructured amino acids).
To estimate the rate at which the phylo-HMM identified motifs that were truly conserved we compared the number of simulated motifs that were correctly aligned with the number of simulated motifs identified by the phylo-HMM. We found that 95% of the simulated artificial motifs were correctly aligned even when the surrounding region had minimal sequence similarity (at motif evolution rate 10% of the background rate, fig. S4B). At the same motif evolution rate, 93% of the simulated motifs were correctly identified and the fraction of simulated motifs that were predicted by the phylo-HMM was dependent on the relative rate of evolution of the motif to the background (fig. S4C). The difference of the simulation results (93% correct predictions) with results from literature-curated conserved motifs (63% correct predictions) is likely due to an oversimplification of the evolution of disordered regions in our simulations. We also addressed the prediction of computational artifacts with the simulations. Because we know the location of the true motifs in the simulations, any other motifs identified by the phylo-HMM are false predictions. For yeast proteins evolving at the background rate, the phylo-HMM predicted about 1 false conserved motif every 9000 rapidly evolving amino acids; however, this was dependent on the background rate of evolution (fig. S4D).
To calculate the proportion of unstructured regions that contain short functional sequences, we first estimated the fraction of our predicted conserved sequences that are computational artifacts (1/9000 times 636,409 unstructured amino acids divided by 7361 predicted motifs = ∼0.95%). To estimate the fraction of unstructured amino acids that are biologically important, we divided the number of amino acids in predicted conserved sequences by the total number of unstructured amino acids in the yeast proteome (33,626 divided by 636,904 = 5.3%) and multiplied by 99.05% (100% – 0.95%) to take into account the expected number of predicted computational artifacts, which yields our estimate of 5.2%.
Motif clustering, alignment, and enrichment
We performed an all-by-all pairwise comparison and alignment of each sequence alignment to another with the Smith-Waterman algorithm (90, 98). In the initial distance metric, we divided the alignment score by the square root of the length of the alignment and corrected for the initial length of the sequence. This was done so that poor but long alignments would not score as well as short but strong alignments. We also performed another clustering with the same distance metric, but first the sequences were extended by five amino acids on each side, and the positions with an information content lower than 1 (positions with high sequence diversity) were eliminated from the beginning and end of the extended sequences. To easily identify sub-clusters, we tried clustering by finding the top 10 “partners” of each sequence, removing hits between paralogs and within the same gene. For this final cluster, we first extended the sequences by five amino acids; however, we did not divide by the square root of the length of the alignment. Alignments that passed a threshold (as described in table S5) were then plotted as an interaction network with Cytoscape (99), and we used the MCODE's (50) k-core clustering algorithm to form similarity clusters. MCODE often links multiple clusters by a single node and therefore forms “subclusters.” We analyzed either the whole clusters or these subclusters by creating sequence logos and functional enrichment as described below (see table S5 for the top 20 predictions of each clustering analysis with annotation and more details).
Enrichment in protein function or interaction was performed with data from the MIPS functional catalog with FunSpec (100) and with data from the Gene Ontology (GO) Slim Mapper at the SGD (83) for GO. Statistical significance was assessed at a P value of <0.05.
Motif patterns are represented as sequence logos (101,102), which were obtained from a heuristic multiple alignment of the S. cerevisiae representative of each motif.
Strains, plasmids, and primers
We used an endogenously tagged SPT21 strain from the TAP-fusion library (103) to assess Spt21 stability throughout the cell cycle. SPT21 overexpression plasmids were obtained from the MORF (104) and GAL-ORF-GST (105) libraries. Mutagenesis was performed with the QuikChange Site-Directed Mutagenesis System developed by Stratagene. For the KEN box, all three codons were mutated to the alanine coding GCTwith oligos SPT21kenbox1-FP 5′-GATATCTTTAACTAGTGAAAATGATGCTGCTGCTATTCCACCCCA-AAGCATAACTAGTA and SPT21kenbox1-RP 5′-TACTAGTTATGCTT-TGGGGTGGAATAGCAGCAGCATCAT TTTCACTAGTTAAAGATATC. The desired mutations were confirmed by sequence analysis. B Y4741 or isogenic derivatives were used for all of our experiments.
Cell cycle induction of SPT21
Yeast cells expressing Spt21-TAP from its endogenous promoter were grown to early log phase in YEPD (1% yeast extract, 2% bactopeptone, and 2% glucose) and then arrested in G1 with α factor. After 2 hours (>95% cells arrested), the cells were washed twice with fresh medium and samples were taken every 15 min. Both fluorescence-activated cell sorting (FACS) analysis and the amount of Clb2 protein were used to follow cell cycle progression. Hexokinase was used as the loading control for the Western blot. Spt21 or Clb2 abundance was quantified, and significance was assessed by Pearson correlation coefficient.
Pulse-chase assay
Cells carrying galactose-inducible overexpression plasmids were grown in synthetic dextrose medium lacking uracil overnight. Spt21 and Spt21ken expression was induced by culturing cells in galactose-containing medium (2% concentration) for 4 hours. Glucose was subsequently added to a final concentration of 2% to attenuate protein expression, and protein synthesis was abolished through the addition of cycloheximide (100 mg/ml final). Cells were collected at 20-min time intervals. To ensure reproducibility, we performed pulse-chase experiments on both the glutathione S-transferase (GST)– and the protA-tagged version of the Spt21 and corresponding KEN box mutant. Protein abundance was quantified and analyzed for significant changes in abundance by t test.
Protein extracts and Western blotting
Protein extracts were prepared by trichloroacetic acid and separated by SDS– polyacrylamide gel electrophoresis (SDS-PAGE) on 8% polyacrylamide gels. Western blotting was performed with anti-protA antibody (peroxidase anti-peroxidase soluble complex, Sigma) for detection of SPT21-protA. Clb2 and hexokinase detection was performed with a-Clb2 [Santa Cruz Biotechnology, Clb2 (y-180)] and α-hexokinase (yeast) (Rockland Immunochemicals Inc.), respectively. For data requiring quantification, we quantified the amount of protein with images of the Western blots obtained from the VersaDoc MP System (Bio-Rad Laboratories Inc.). Mean band intensities of the relevant proteins were normalized to the mean intensity of the hexokinase band with ImageJ (106).
In vitro pull-down assays
A GST-tagged Cbk1 fragment containing the kinase domain and the C-terminal extension (∼76 kD) was expressed in Escherichia coli Rosetta(DE3)pLysS, purified on Ni-NTA resin (Qiagen) and glutathione-Sepharose (GE Biosciences), and dialyzed into 20 mM tris, 150 mM NaCl, and 2 mM dithiothreitol (DTT) (pH 8.0). Purified Cbk1 was flash-frozen in liquid nitrogen and stored at −80°C. Fragments containing putative interaction motifs were expressed as MBP fusions in BL21(DE3)RIL. Cell lysates containing the interaction motif constructs were incubated with amylose resin (New England Biolabs) on a rotator at 4°C for 15 min, and the beads were washed with phosphate-buffered saline [137 mM NaCl, 2.7 mM KCl, 4.3 mM Na2HPO4, 1.4 mM KH2PO4 (pH 7.3)] + 2 mM DTT. Washed amylose beads (about 50 mg of MBP fusions) were incubated with 1 mM purified Cbk1 (∼3.8 μg) for 15 min at 4°C (total volume 50 μl) and then washed with TBST [50 mM tris, 150 mM NaCl, 0.1% Tween 20 (pH 7.5)] and resuspended in SDS-PAGE loading buffer. A third of the reactions were loaded on SDS-PAGE gels, which were directly stained by GelCode Blue (Pierce) or transferred to nitrocellulose for Western blotting. Cbk1 was detected with a GST primary antibody (Santa Cruz Biotechnology), followed by an IRDye800 anti-mouse (Rockland) secondary antibodies. Blots were visualized with a Li-Cor Odyssey system.
Supplementary Material
Fig. S1. Schematic of the phylo-HMM approach.
Fig. S2. Regions with no conserved segments are not detected by the phylo-HMM approach.
Fig. S3. Newly identified KEN box in Spt21 and Cbk1 interaction motif in Ssd1 are conserved in further yeast species.
Fig. S4. Simulation of protein evolution.
Fig. S5. Performance of the phylo-HMM approach on literature-curated short linear motifs.
Fig. S6. Binding of FxFP peptides to Cbk1.
Fig. S7. Phylogenetic tree of species used for this study.
Table S1. Predictions on the yeast proteome by the phylo-HMM approach. Short conserved sequences were predicted on the yeast proteome using our phylo-HMM approach. Each motif is represented by a unique identifier, as well as the gene that contains it (systematic name), its position and sequence within the S. cerevisiae protein.)
Table S2. Literature-curated characterized short linear motifs. A set of short linear motifs in yeast proteins was curated from the literature. Each short linear motif is defined by the gene that contains it (standard name and systematic name), the reported function of the motif within the gene, the regulator that interacts with the motif, its position within the protein and the sequence of amino acids reported. The reference for this information is included for each short linear motif. The following columns indicate whether the motif is found in unstructured regions (by our definition) and whether the motif was predicted by the phylo-HMM. If the motif could be defined by a consensus sequence and was found in unstructured regions, the fraction of species that contained this consensus sequence is shown. For short linear motifs that matched a known consensus, if this fraction was above 90%, we considered the consensus sequence to be conserved. For short linear motifs that did not match a known consensus, in some cases we inspected the alignment by eye and indicated these as ‘considered conserved’ if we could identify them in many species.Table S3. Enrichment analysis of motifs matching known consensus sequences. (Excel file)
Table S3. Enrichment analysis of motifs matching known KEN-box mediated APC/C degradation consensus sequences
Table S4. Clusters of similar short conserved sequences. Three tables show the results from three different cluster analyses that used different metrics to assign sequence similarity between motifs. The first table describes the results using an all-by-all pairwise distance measure (described in Methods) between the predicted segments. The second table describes the results after first extending either side of the motifs by five residues before applying the all-by-all distance measure. Using the same extended motifs, the third table describes the results considering only the top 10 most similar motifs as similar. Each motif is represented by its identifier as in Table S1, the sequence that was used in the cluster analysis, the gene that contains the motif, its position within the S. cerevisiae protein, and the cluster where it is found.
Acknowledgments
We thank P. Kim, N. Provart, J. Parkinson, and members of the Moses lab for discussions. We also thank an anonymous reviewer for suggestions on hub proteins analysis.
Funding: A.N.N.B. is supported by an Ontario Graduate Scholarship and a postgraduate scholarship from the Natural Sciences and Engineering Research Council of Canada. B.J.Y. was a Damon Runyon Fellow supported by the Damon Runyon Cancer Research Foundation (DRG-1976-08). Research in E.L.W.'s laboratory is supported by an NIH–National Institute of General Medical Sciences grant (GM-084223). A.R.D. is supported by Canadian Institutes of Health Research (grant MOP-13609). A.M.M. is supported by a Natural Sciences and Engineering Research Council of Canada Discovery grant and Canadian Institutes of Health research (grant MOP-119579). This research was supported by infrastructure grants from the Canadian Foundation for Innovation to A.M.M. and B.J.A. The funders had no role in study design, data collection and analysis, decision to publish, or preparation of the manuscript.
Footnotes
Author contributions: A.N.N.B. designed and performed the computational and SPT21-related experiments, identified characterized short linear motifs, and wrote the paper. B.J.Y. designed and performed the pull-down assays for the Cbk1 interaction motif and edited the paper. D.v.D. designed and performed the SPT21-related experiments and edited the paper. A.R.D. designed the computational experiment and edited the paper. B.J.A. provided research supervision. E.L.W. designed the Cbk1 interaction motif experiments and edited the paper. A.M.M. designed the computational and SPT21-related experiments and wrote the paper.
Competing interests: The authors declare that they have no competing interests.
Data and materials availability: All strains and source code used for this study are available upon request. A browser and the data sets produced are available on our Web site: http://www.moseslab.csb.utoronto.ca/phylo_HMM/.
References
- 1.Ward JJ, Sodhi JS, McGuffin LJ, Buxton BF, Jones DT. Prediction and functional analysis of native disorder in proteins from the three kingdoms of life. J Mol Biol. 2004;337:635–645. doi: 10.1016/j.jmb.2004.02.002. [DOI] [PubMed] [Google Scholar]
- 2.Wells M, Tidow H, Rutherford TJ, Markwick P, Jensen MR, Mylonas E, Svergun DI, Blackledge M, Fersht AR. Structure of tumor suppressor p53 and its intrinsically disordered N-terminal transactivation domain. Proc Natl Acad Sci USA. 2008;105:5762–5767. doi: 10.1073/pnas.0801353105. [DOI] [PMC free article] [PubMed] [Google Scholar]
- 3.Uversky VN, Oldfield CJ, Dunker AK. Intrinsically disordered proteins in human diseases: Introducing the D2 concept. Annu Rev Biophys. 2008;37:215–246. doi: 10.1146/annurev.biophys.37.032807.125924. [DOI] [PubMed] [Google Scholar]
- 4.Ostedgaard LS, Baldursson O, Vermeer DW, Welsh MJ, Robertson AD. A functional R domain from cystic fibrosis transmembrane conductance regulator is predominantly unstructured in solution. Proc Natl Acad Sci USA. 2000;97:5657–5662. doi: 10.1073/pnas.100588797. [DOI] [PMC free article] [PubMed] [Google Scholar]
- 5.Wright PE, Dyson HJ. Intrinsically unstructured proteins: Re-assessing the protein structure-function paradigm. J Mol Biol. 1999;293:321–331. doi: 10.1006/jmbi.1999.3110. [DOI] [PubMed] [Google Scholar]
- 6.Fong JH, Shoemaker BA, Garbuzynskiy SO, Lobanov MY, Galzitskaya OV, Panchenko AR. Intrinsic disorder in protein interactions: Insights from a comprehensive structural analysis. PLoS Comput Biol. 2009;5:e1000316. doi: 10.1371/journal.pcbi.1000316. [DOI] [PMC free article] [PubMed] [Google Scholar]
- 7.Sigalov AB, Zhuravleva AV, Orekhov VY. Binding of intrinsically disordered proteins is not necessarily accompanied by a structural transition to a folded form. Biochimie. 2007;89:419–421. doi: 10.1016/j.biochi.2006.11.003. [DOI] [PMC free article] [PubMed] [Google Scholar]
- 8.Dunker AK, Lawson JD, Brown CJ, Williams RM, Romero P, Oh JS, Oldfield CJ, Campen AM, Ratliff CM, Hipps KW, Ausio J, Nissen MS, Reeves R, Kang C, Kissinger CR, Bailey RW, Griswold MD, Chiu W, Garner EC, Obradovic Z. Intrinsically disordered protein. J Mol Graph Model. 2001;19:26–59. doi: 10.1016/s1093-3263(00)00138-8. [DOI] [PubMed] [Google Scholar]
- 9.Brocca S, Samalíková M, Uversky VN, Lotti M, Vanoni M, Alberghina L, Grandori R. Order propensity of an intrinsically disordered protein, the cyclin-dependent-kinase inhibitor Sic1. Proteins. 2009;76:731–746. doi: 10.1002/prot.22385. [DOI] [PMC free article] [PubMed] [Google Scholar]
- 10.Dunker AK, Brown CJ, Lawson JD, Iakoucheva LM, Obradović Z. Intrinsic disorder and protein function. Biochemistry. 2002;41:6573–6582. doi: 10.1021/bi012159+. [DOI] [PubMed] [Google Scholar]
- 11.Dunker AK, Cortese MS, Romero P, Iakoucheva LM, Uversky VN. Flexible nets. The roles of intrinsic disorder in protein interaction networks. FEBS J. 2005;272:5129–5148. doi: 10.1111/j.1742-4658.2005.04948.x. [DOI] [PubMed] [Google Scholar]
- 12.Iakoucheva LM, Radivojac P, Brown CJ, O'Connor TR, Sikes JG, Obradovic Z, Dunker AK. The importance of intrinsic disorder for protein phosphorylation. Nucleic Acids Res. 2004;32:1037–1049. doi: 10.1093/nar/gkh253. [DOI] [PMC free article] [PubMed] [Google Scholar]
- 13.Dyson HJ, Wright PE. Intrinsically unstructured proteins and their functions. Nat Rev Mol Cell Biol. 2005;6:197–208. doi: 10.1038/nrm1589. [DOI] [PubMed] [Google Scholar]
- 14.Gould CM, Diella F, Via A, Puntervoll P, Gemümd C, Chabanis-Davidson S, Michael S, Sayadi A, Bryne JC, Chica C, Seiler M, Davey NE, Haslam N, Weatheritt RJ, Budd A, Hughes T, Pas J, Rychlewski L, Travé G, Aasland R, Helmer-Citterich M, Linding R, Gibson TJ. ELM: The status of the 2010 eukaryotic linear motif resource. Nucleic Acids Res. 2010;38:D167–D180. doi: 10.1093/nar/gkp1016. [DOI] [PMC free article] [PubMed] [Google Scholar]
- 15.Ureta-Vidal A, Ettwiller L, Birney E. Comparative genomics: Genome-wide analysis in metazoan eukaryotes. Nat Rev Genet. 2003;4:251–262. doi: 10.1038/nrg1043. [DOI] [PubMed] [Google Scholar]
- 16.Beltrao P, Serrano L. Comparative genomics and disorder prediction identify biologically relevant SH3 protein interactions. PLoS Comput Biol. 2005;1:e26. doi: 10.1371/journal.pcbi.0010026. [DOI] [PMC free article] [PubMed] [Google Scholar]
- 17.Mok J, Kim PM, Lam HYK, Piccirillo S, Zhou X, Jeschke GR, Sheridan DL, Parker SA, Desai V, Jwa M, Cameroni E, Niu H, Good M, Remenyi A, Ma JLN, Sheu YJ, Sassi HE, Sopko R, Chan CSM, De Virgilio C, Hollingsworth NM, Lim WA, Stern DF, Stillman B, Andrews BJ, Gerstein MB, Snyder M, Turk BE. Deciphering protein kinase specificity through large-scale analysis of yeast phosphorylation site motifs. Sci Signal. 2010;3:ra12. doi: 10.1126/scisignal.2000482. [DOI] [PMC free article] [PubMed] [Google Scholar]
- 18.Linding R, Jensen LJ, Ostheimer GJ, van Vugt MATM, Jørgensen C, Miron IM, Diella F, Colwill K, Taylor L, Elder K, Metalnikov P, Nguyen V, Pasculescu A, Jin J, Park JG, Samson LD, Woodgett JR, Russell RB, Bork P, Yaffe MB, Pawson T. Systematic discovery of in vivo phosphorylation networks. Cell. 2007;129:1415–1426. doi: 10.1016/j.cell.2007.05.052. [DOI] [PMC free article] [PubMed] [Google Scholar]
- 19.Tonikian R, Xin X, Toret CP, Gfeller D, Landgraf C, Panni S, Paoluzi S, Castagnoli L, Currell B, Seshagiri S, Yu H, Winsor B, Vidal M, Gerstein MB, Bader GD, Volkmer R, Cesareni G, Drubin DG, Kim PM, Sidhu SS, Boone C. Bayesian modeling of the yeast SH3 domain interactome predicts spatiotemporal dynamics of endocytosis proteins. PLoS Biol. 2009;7:e1000218. doi: 10.1371/journal.pbio.1000218. [DOI] [PMC free article] [PubMed] [Google Scholar]
- 20.Lieber DS, Elemento O, Tavazoie S. Large-scale discovery and characterization of protein regulatory motifs in eukaryotes. PLoS One. 2010;5:e14444. doi: 10.1371/journal.pone.0014444. [DOI] [PMC free article] [PubMed] [Google Scholar]
- 21.Neduva V, Linding R, Su-Angrand I, Stark A, de Masi F, Gibson TJ, Lewis J, Serrano L, Russell RB. Systematic discovery of new recognition peptides mediating protein interaction networks. PLoS Biol. 2005;3:e405. doi: 10.1371/journal.pbio.0030405. [DOI] [PMC free article] [PubMed] [Google Scholar]
- 22.Siepel A, Bejerano G, Pedersen JS, Hinrichs AS, Hou M, Rosenbloom K, Clawson H, Spieth J, Hillier LW, Richards S, Weinstock GM, Wilson RK, Gibbs RA, Kent WJ, Miller W, Haussler D. Evolutionarily conserved elements in vertebrate, insect, worm, and yeast genomes. Genome Res. 2005;15:1034–1050. doi: 10.1101/gr.3715005. [DOI] [PMC free article] [PubMed] [Google Scholar]
- 23.Linding R, Jensen LJ, Diella F, Bork P, Gibson TJ, Russell RB. Protein disorder prediction: Implications for structural proteomics. Structure. 2003;11:1453–1459. doi: 10.1016/j.str.2003.10.002. [DOI] [PubMed] [Google Scholar]
- 24.Nguyen Ba AN, Moses AM. Evolution of characterized phosphorylation sites in budding yeast. Mol Biol Evol. 2010;27:2027–2037. doi: 10.1093/molbev/msq090. [DOI] [PubMed] [Google Scholar]
- 25.Chica C, Labarga A, Gould CM, López R, Gibson TJ. A tree-based conservation scoring method for short linear motifs in multiple alignments of protein sequences. BMC Bioinformatics. 2008;9:229. doi: 10.1186/1471-2105-9-229. [DOI] [PMC free article] [PubMed] [Google Scholar]
- 26.Gordon JL, Byrne KP, Wolfe KH. Additions, losses, and rearrangements on the evolutionary route from a reconstructed ancestor to the modern Saccharomyces cerevisiae genome. PLoS Genet. 2009;5:e1000485. doi: 10.1371/journal.pgen.1000485. [DOI] [PMC free article] [PubMed] [Google Scholar]
- 27.Ren S, Uversky VN, Chen Z, Dunker AK, Obradovic Z. Short linear motifs recognized by SH2, SH3 and Ser/Thr kinase domains are conserved in disordered protein regions. BMC Genomics. 2008;9(Suppl. 2):S26. doi: 10.1186/1471-2164-9-S2-S26. [DOI] [PMC free article] [PubMed] [Google Scholar]
- 28.Nash P, Tang X, Orlicky S, Chen Q, Gertler FB, Mendenhall MD, Sicheri F, Pawson T, Tyers M. Multisite phosphorylation of a CDK inhibitor sets a threshold for the onset of DNA replication. Nature. 2001;414:514–521. doi: 10.1038/35107009. [DOI] [PubMed] [Google Scholar]
- 29.Mittag T, Orlicky S, Choy WY, Tang X, Lin H, Sicheri F, Kay LE, Tyers M, Forman-Kay JD. Dynamic equilibrium engagement of a polyvalent ligand with a single-site receptor. Proc Natl Acad Sci USA. 2008;105:17772–17777. doi: 10.1073/pnas.0809222105. [DOI] [PMC free article] [PubMed] [Google Scholar]
- 30.Ubersax JA, Woodbury EL, Quang PN, Paraz M, Blethrow JD, Shah K, Shokat KM, Morgan DO. Targets of the cyclin-dependent kinase Cdk1. Nature. 2003;425:859–864. doi: 10.1038/nature02062. [DOI] [PubMed] [Google Scholar]
- 31.Jaspersen SL, Morgan DO. Cdc14 activates cdc15 to promote mitotic exit in budding yeast. Curr Biol. 2000;10:615–618. doi: 10.1016/s0960-9822(00)00491-7. [DOI] [PubMed] [Google Scholar]
- 32.Wanke V, Pedruzzi I, Cameroni E, Dubouloz F, De Virgilio C. Regulation of G0 entry by the Pho80–Pho85 cyclin–CDK complex. EMBO J. 2005;24:4271–4278. doi: 10.1038/sj.emboj.7600889. [DOI] [PMC free article] [PubMed] [Google Scholar]
- 33.Ydenberg CA, Rose MD. Antagonistic regulation of Fus2p nuclear localization by pheromone signaling and the cell cycle. J Cell Biol. 2009;184:409–422. doi: 10.1083/jcb.200809066. [DOI] [PMC free article] [PubMed] [Google Scholar]
- 34.Denning DP, Patel SS, Uversky V, Fink AL, Rexach M. Disorder in the nuclear pore complex: The FG repeat regions of nucleoporins are natively unfolded. Proc Natl Acad Sci USA. 2003;100:2450–2455. doi: 10.1073/pnas.0437902100. [DOI] [PMC free article] [PubMed] [Google Scholar]
- 35.Lau CK, Giddings TH, Jr, Winey M. A novel allele of Saccharomyces cerevisiae NDC1 reveals a potential role for the spindle pole body component Ndc1p in nuclear pore assembly. Eukaryot Cell. 2004;3:447–458. doi: 10.1128/EC.3.2.447-458.2004. [DOI] [PMC free article] [PubMed] [Google Scholar]
- 36.Chial HJ, Rout MP, Giddings TH, Winey M. Saccharomyces cerevisiae Ndc1p is a shared component of nuclear pore complexes and spindle pole bodies. J Cell Biol. 1998;143:1789–1800. doi: 10.1083/jcb.143.7.1789. [DOI] [PMC free article] [PubMed] [Google Scholar]
- 37.Warren DT, Andrews PD, Gourlay CW, Ayscough KR. Sla1p couples the yeast endocytic machinery to proteins regulating actin dynamics. J Cell Sci. 2002;115:1703–1715. doi: 10.1242/jcs.115.8.1703. [DOI] [PubMed] [Google Scholar]
- 38.Buschhorn BA, Peters JM. How APC/C orders destruction. Nat Cell Biol. 2006;8:209–211. doi: 10.1038/ncb0306-209. [DOI] [PubMed] [Google Scholar]
- 39.Choi E, Dial JM, Jeong DE, Hall MC. Unique D box and KEN box sequences limit ubiquitination of Acm1 and promote pseudosubstrate inhibition of the anaphase-promoting complex. J Biol Chem. 2008;283:23701–23710. doi: 10.1074/jbc.M803695200. [DOI] [PMC free article] [PubMed] [Google Scholar]
- 40.King EMJ, van der Sar SJA, Hardwick KG. Mad3 KEN boxes mediate both Cdc20 and Mad3 turnover, and are critical for the spindle checkpoint. PLoS One. 2007;2:e342. doi: 10.1371/journal.pone.0000342. [DOI] [PMC free article] [PubMed] [Google Scholar]
- 41.Cohen-Fix O, Peters JM, Kirschner MW, Koshland D. Anaphase initiation in Saccharomyces cerevisiae is controlled by the APC-dependent degradation of the anaphase inhibitor Pds1p. Genes Dev. 1996;10:3081–3093. doi: 10.1101/gad.10.24.3081. [DOI] [PubMed] [Google Scholar]
- 42.Juang YL, Huang J, Peters JM, McLaughlin ME, Tai CY, Pellman D. APC-mediated proteolysis of Ase1 and the morphogenesis of the mitotic spindle. Science. 1997;275:1311–1314. doi: 10.1126/science.275.5304.1311. [DOI] [PubMed] [Google Scholar]
- 43.Hendrickson C, Meyn MA, III, Morabito L, Holloway SL. The KEN box regulates Clb2 proteolysis in G1 and at the metaphase-to-anaphase transition. Curr Biol. 2001;11:1781–1787. doi: 10.1016/s0960-9822(01)00564-4. [DOI] [PubMed] [Google Scholar]
- 44.Feine O, Zur A, Mahbubani H, Brandeis M. Human Kid is degraded by the APC/C(Cdh1) but not by the APC/C(Cdc20) Cell Cycle. 2007;6:2516–2523. doi: 10.4161/cc.6.20.4791. [DOI] [PubMed] [Google Scholar]
- 45.Chang JS, Winston F. Spt10 and Spt21 are required for transcriptional silencing in Saccharomyces cerevisiae. Eukaryot Cell. 2011;10:118–129. doi: 10.1128/EC.00246-10. [DOI] [PMC free article] [PubMed] [Google Scholar]
- 46.Spellman PT, Sherlock G, Zhang MQ, Iyer VR, Anders K, Eisen MB, Brown PO, Botstein D, Futcher B. Comprehensive identification of cell cycle-regulated genes of the yeast Saccharomyces cerevisiae by microarray hybridization. Mol Biol Cell. 1998;9:3273–3297. doi: 10.1091/mbc.9.12.3273. [DOI] [PMC free article] [PubMed] [Google Scholar]
- 47.Sopko R, Huang D, Preston N, Chua G, Papp B, Kafadar K, Snyder M, Oliver SG, Cyert M, Hughes TR, Boone C, Andrews B. Mapping pathways and phenotypes by systematic gene overexpression. Mol Cell. 2006;21:319–330. doi: 10.1016/j.molcel.2005.12.011. [DOI] [PubMed] [Google Scholar]
- 48.Kressler D, de la Cruz J, Rojo M, Linder P. Dbp6p is an essential putative ATP-dependent RNA helicase required for 60S-ribosomal-subunit assembly in Saccharomyces cerevisiae. Mol Cell Biol. 1998;18:1855–1865. doi: 10.1128/mcb.18.4.1855. [DOI] [PMC free article] [PubMed] [Google Scholar]
- 49.Charette JM, Baserga SJ. The DEAD-box RNA helicase-like Utp25 is an SSU processome component. RNA. 2010;16:2156–2169. doi: 10.1261/rna.2359810. [DOI] [PMC free article] [PubMed] [Google Scholar]
- 50.Bader GD, Hogue CWV. An automated method for finding molecular complexes in large protein interaction networks. BMC Bioinformatics. 2003;4:2. doi: 10.1186/1471-2105-4-2. [DOI] [PMC free article] [PubMed] [Google Scholar]
- 51.de Beer T, Hoofnagle AN, Enmon JL, Bowers RC, Yamabhai M, Kay BK, Overduin M. Molecular mechanism of NPF recognition by EH domains. Nat Struct Biol. 2000;7:1018–1022. doi: 10.1038/80924. [DOI] [PubMed] [Google Scholar]
- 52.Nguyen Ba AN, Pogoutse A, Provart N, Moses AM, Stradamus NL. A simple hidden Markov model for nuclear localization signal prediction. BMC Bioinformatics. 2009;10:202. doi: 10.1186/1471-2105-10-202. [DOI] [PMC free article] [PubMed] [Google Scholar]
- 53.Lange A, Mills RE, Lange CJ, Stewart M, Devine SE, Corbett AH. Classical nuclear localization signals: Definition, function, and interaction with importin a. J Biol Chem. 2007;282:5101–5105. doi: 10.1074/jbc.R600026200. [DOI] [PMC free article] [PubMed] [Google Scholar]
- 54.Macias MJ, Wiesner S, Sudol M. WW and SH3 domains, two different scaffolds to recognize proline-rich ligands. FEBS Lett. 2002;513:30–37. doi: 10.1016/s0014-5793(01)03290-2. [DOI] [PubMed] [Google Scholar]
- 55.Rodal AA, Manning AL, Goode BL, Drubin DG. Negative regulation of yeast WASp by two SH3 domain-containing proteins. Curr Biol. 2003;13:1000–1008. doi: 10.1016/s0960-9822(03)00383-x. [DOI] [PubMed] [Google Scholar]
- 56.Roth AF, Wan J, Bailey AO, Sun B, Kuchar JA, Green WN, Phinney BS, Yates JR, III, Davis NG. Global analysis of protein palmitoylation in yeast. Cell. 2006;125:1003–1013. doi: 10.1016/j.cell.2006.03.042. [DOI] [PMC free article] [PubMed] [Google Scholar]
- 57.Ho Y, Gruhler A, Heilbut A, Bader GD, Moore L, Adams SL, Millar A, Taylor P, Bennett K, Boutilier K, Yang L, Wolting C, Donaldson I, Schandorff S, Shewnarane J, Vo M, Taggart J, Goudreault M, Muskat B, Alfarano C, Dewar D, Lin Z, Michalickova K, Willems AR, Sassi H, Nielsen PA, Rasmussen KJ, Andersen JR, Johansen LE, Hansen LH, Jespersen H, Podtelejnikov A, Nielsen E, Crawford J, Poulsen V, Sørensen BD, Matthiesen J, Hendrickson RC, Gleeson F, Pawson T, Moran MF, Durocher D, Mann M, Hogue CWV, Figeys D, Tyers M. Systematic identification of protein complexes in Saccharomyces cerevisiae by mass spectrometry. Nature. 2002;415:180–183. doi: 10.1038/415180a. [DOI] [PubMed] [Google Scholar]
- 58.Breitkreutz A, Choi H, Sharom JR, Boucher L, Neduva V, Larsen B, Lin ZY, Breitkreutz BJ, Stark C, Liu G, Ahn J, Dewar-Darch D, Reguly T, Tang X, Almeida R, Qin ZS, Pawson T, Gingras AC, Nesvizhskii AI, Tyers M. A global protein kinase and phosphatase interaction network in yeast. Science. 2010;328:1043–1046. doi: 10.1126/science.1176495. [DOI] [PMC free article] [PubMed] [Google Scholar]
- 59.Jansen JM, Wanless AG, Seidel CW, Weiss EL. Cbk1 regulation of the RNA-binding protein Ssd1 integrates cell fate with translational control. Curr Biol. 2009;19:2114–2120. doi: 10.1016/j.cub.2009.10.071. [DOI] [PMC free article] [PubMed] [Google Scholar]
- 60.Mazanka E, Alexander J, Yeh BJ, Charoenpong P, Lowery DM, Yaffe M, Weiss EL. The NDR/LATS family kinase Cbk1 directly controls transcriptional asymmetry. PLoS Biol. 2008;6:e203. doi: 10.1371/journal.pbio.0060203. [DOI] [PMC free article] [PubMed] [Google Scholar]
- 61.Jacobs D, Glossip D, Xing H, Muslin AJ, Kornfeld K. Multiple docking sites on substrate proteins form a modular system that mediates recognition by ERK MAP kinase. Genes Dev. 1999;13:163–175. [PMC free article] [PubMed] [Google Scholar]
- 62.Reményi A, Good MC, Lim WA. Docking interactions in protein kinase and phosphatase networks. Curr Opin Struct Biol. 2006;16:676–685. doi: 10.1016/j.sbi.2006.10.008. [DOI] [PubMed] [Google Scholar]
- 63.Uetz P, Giot L, Cagney G, Mansfield TA, Judson RS, Knight JR, Lockshon D, Narayan V, Srinivasan M, Pochart P, Qureshi-Emili A, Li Y, Godwin B, Conover D, Kalbfleisch T, Vijayadamodar G, Yang M, Johnston M, Fields S, Rothberg JM. A comprehensive analysis of protein–protein interactions in Saccharomyces cerevisiae. Nature. 2000;403:623–627. doi: 10.1038/35001009. [DOI] [PubMed] [Google Scholar]
- 64.Ito T, Chiba T, Ozawa R, Yoshida M, Hattori M, Sakaki Y. A comprehensive two-hybrid analysis to explore the yeast protein interactome. Proc Natl Acad Sci USA. 2001;98:4569–4574. doi: 10.1073/pnas.061034498. [DOI] [PMC free article] [PubMed] [Google Scholar]
- 65.Jeong H, Mason SP, Barabási AL, Oltvai ZN. Lethality and centrality in protein networks. Nature. 2001;411:41–42. doi: 10.1038/35075138. [DOI] [PubMed] [Google Scholar]
- 66.Bertin N, Simonis N, Dupuy D, Cusick ME, Han JDJ, Fraser HB, Roth FP, Vidal M. Confirmation of organized modularity in the yeast interactome. PLoS Biol. 2007;5:e153. doi: 10.1371/journal.pbio.0050153. [DOI] [PMC free article] [PubMed] [Google Scholar]
- 67.Haynes C, Oldfield CJ, Ji F, Klitgord N, Cusick ME, Radivojac P, Uversky VN, Vidal M, Iakoucheva LM. Intrinsic disorder is a common feature of hub proteins from four eukaryotic interactomes. PLoS Comput Biol. 2006;2:e100. doi: 10.1371/journal.pcbi.0020100. [DOI] [PMC free article] [PubMed] [Google Scholar]
- 68.Davey NE, Edwards RJ, Shields DC. Computational identification and analysis of protein short linear motifs. Front. Biosci. 2010;15:801–825. doi: 10.2741/3647. [DOI] [PubMed] [Google Scholar]
- 69.Obenauer JC, Cantley LC, Yaffe MB. Scansite 2.0: Proteome-wide prediction of cell signaling interactions using short sequence motifs. Nucleic Acids Res. 2003;31:3635–3641. doi: 10.1093/nar/gkg584. [DOI] [PMC free article] [PubMed] [Google Scholar]
- 70.Bailey TL, Elkan C. Fitting a mixture model by expectation maximization to discover motifs in biopolymers. Proc. Int. Conf. Intell Syst Mol Biol. 1994;2:28–36. [PubMed] [Google Scholar]
- 71.Davey NE, Shields DC, Edwards RJ. SLiMDisc: Short, linear motif discovery, correcting for common evolutionary descent. Nucleic Acids Res. 2006;34:3546–3554. doi: 10.1093/nar/gkl486. [DOI] [PMC free article] [PubMed] [Google Scholar]
- 72.Edwards RJ, Davey NE, Shields DC. SLiMFinder:A probabilistic method for identifying over-represented, convergently evolved, short linear motifs in proteins. PLoS One. 2007;2:e967. doi: 10.1371/journal.pone.0000967. [DOI] [PMC free article] [PubMed] [Google Scholar]
- 73.Neduva V, Russell RB. DILIMOT:Discovery of linear motifs in proteins. Nucleic Acids Res. 2006;34:W350–W355. doi: 10.1093/nar/gkl159. [DOI] [PMC free article] [PubMed] [Google Scholar]
- 74.Mészáros B, Simon I, Dosztányi Z. Prediction of protein binding regions in disordered proteins. PLoS Comput Biol. 2009;5:e1000376. doi: 10.1371/journal.pcbi.1000376. [DOI] [PMC free article] [PubMed] [Google Scholar]
- 75.Tagle DA, Koop BF, Goodman M, Slightom JL, Hess DL, Jones RT. Embryonic e and g globin genes of a prosimian primate (Galago crassicaudatus). Nucleotide and amino acid sequences, developmental regulation and phylogenetic footprints. J Mol Biol. 1988;203:439–455. doi: 10.1016/0022-2836(88)90011-3. [DOI] [PubMed] [Google Scholar]
- 76.Cliften P, Sudarsanam P, Desikan A, Fulton L, Fulton B, Majors J, Waterston R, Cohen BA, Johnston M. Finding functional features in Saccharomyces genomes by phylogenetic footprinting. Science. 2003;301:71–76. doi: 10.1126/science.1084337. [DOI] [PubMed] [Google Scholar]
- 77.Kent WJ, Sugnet CW, Furey TS, Roskin KM, Pringle TH, Zahler AM, Haussler D. The human genome browser at UCSC. Genome Res. 2002;12:996–1006. doi: 10.1101/gr.229102. [DOI] [PMC free article] [PubMed] [Google Scholar]
- 78.Flicek P, Amode MR, Barrell D, Beal K, Brent S, Chen Y, Clapham P, Coates G, Fairley S, Fitzgerald S, Gordon L, Hendrix M, Hourlier T, Johnson N, Kähäri A, Keefe D, Keenan S, Kinsella R, Kokocinski F, Kulesha E, Larsson P, Longden I, McLaren W, Overduin B, Pritchard B, Riat HS, Rios D, Ritchie GRS, Ruffier M, Schuster M, Sobral D, Spudich G, Tang YA, Trevanion S, Vandrovcova J, Vilella AJ, White S, Wilder SP, Zadissa A, Zamora J, Aken BL, Birney E, Cunningham F, Dunham I, Durbin R, Fernández-Suarez XM, Herrero J, Hubbard TJP, Parker A, Proctor G, Vogel J, Searle SMJ. Ensembl 2011. Nucleic Acids Res. 2011;39:D800–D806. doi: 10.1093/nar/gkq1064. [DOI] [PMC free article] [PubMed] [Google Scholar]
- 79.Bonifacino JS, Traub LM. Signals for sorting of transmembrane proteins to endosomes and lysosomes. Annu Rev Biochem. 2003;72:395–447. doi: 10.1146/annurev.biochem.72.121801.161800. [DOI] [PubMed] [Google Scholar]
- 80.Darsow T, Burd CG, Emr SD. Acidic dileucine motif essential for AP-3–dependent sorting and restriction of the functional specificity of the Vam3p vacuolar t-SNARE. J Cell Biol. 1998;142:913–922. doi: 10.1083/jcb.142.4.913. [DOI] [PMC free article] [PubMed] [Google Scholar]
- 81.Moses AM, Landry CR. Moving from transcriptional to phospho-evolution: Generalizing regulatory evolution? Trends Genet. 2010;26:462–467. doi: 10.1016/j.tig.2010.08.002. [DOI] [PubMed] [Google Scholar]
- 82.Jensen LJ, Jensen TS, de Lichtenberg U, Brunak S, Bork P. Co-evolution of transcriptional and post-translational cell-cycle regulation. Nature. 2006;443:594–597. doi: 10.1038/nature05186. [DOI] [PubMed] [Google Scholar]
- 83.SGD Project. Saccharomyces Genome Database. http://www.yeastgenome.org/
- 84.Katoh K, Misawa K, Kuma K, Miyata T. MAFFT: A novel method for rapid multiple sequence alignment based on fast Fourier transform. Nucleic Acids Res. 2002;30:3059–3066. doi: 10.1093/nar/gkf436. [DOI] [PMC free article] [PubMed] [Google Scholar]
- 85.Yang Z. PAML 4: Phylogenetic analysis by maximum likelihood. Mol Biol Evol. 2007;24:1586–1591. doi: 10.1093/molbev/msm088. [DOI] [PubMed] [Google Scholar]
- 86.Wapinski I, Pfeffer A, Friedman N, Regev A. Natural history and evolutionary principles of gene duplication in fungi. Nature. 2007;449:54–61. doi: 10.1038/nature06107. [DOI] [PubMed] [Google Scholar]
- 87.Heinicke S, Livstone MS, Lu C, Oughtred R, Kang F, Angiuoli SV, White O, Botstein D, Dolinski K. The Princeton Protein Orthology Database (P-POD): A comparative genomics analysis tool for biologists. PLoS One. 2007;2:e766. doi: 10.1371/journal.pone.0000766. [DOI] [PMC free article] [PubMed] [Google Scholar]
- 88.Altschul SF, Madden TL, Schäffer AA, Zhang J, Zhang Z, Miller W, Lipman DJ. Gapped BLAST and PSI-BLAST: A new generation of protein database search programs. Nucleic Acids Res. 1997;25:3389–3402. doi: 10.1093/nar/25.17.3389. [DOI] [PMC free article] [PubMed] [Google Scholar]
- 89.Suzek BE, Huang H, Mc Garvey P, Mazumder R, Wu CH, Uni Ref Comprehensive and non-redundant UniProt reference clusters. Bioinformatics. 2007;23:1282–1288. doi: 10.1093/bioinformatics/btm098. [DOI] [PubMed] [Google Scholar]
- 90.Durbin R, Eddy SR, Krogh A, Mitchison G. Biological Sequence Analysis: Probabilistic Models of Proteins and Nucleic Acids. Cambridge University Press; Cambridge, UK: 1998. [Google Scholar]
- 91.Felsenstein J. Evolutionary trees from DNA sequences: A maximum likelihood approach. J Mol Evol. 1981;17:368–376. doi: 10.1007/BF01734359. [DOI] [PubMed] [Google Scholar]
- 92.Rivas E, Eddy SR. Probabilistic phylogenetic inference with insertions and deletions. PLoS Comput Biol. 2008;4:e1000172. doi: 10.1371/journal.pcbi.1000172. [DOI] [PMC free article] [PubMed] [Google Scholar]
- 93.Cartwright RA. Logarithmic gap costs decrease alignment accuracy. BMC Bioinformatics. 2006;7:527. doi: 10.1186/1471-2105-7-527. [DOI] [PMC free article] [PubMed] [Google Scholar]
- 94.Waterhouse AM, Procter JB, Martin DMA, Clamp M, Barton GJ. Jalview Version 2—A multiple sequence alignment editor and analysis workbench. Bioinformatics. 2009;25:1189–1191. doi: 10.1093/bioinformatics/btp033. [DOI] [PMC free article] [PubMed] [Google Scholar]
- 95.Ward JJ, McGuffin LJ, Bryson K, Buxton BF, Jones DT. The DISOPRED server for the prediction of protein disorder. Bioinformatics. 2004;20:2138–2139. doi: 10.1093/bioinformatics/bth195. [DOI] [PubMed] [Google Scholar]
- 96.Jones DT, Taylor WR, Thornton JM. A model recognition approach to the prediction of all-helical membrane protein structure and topology. Biochemistry. 1994;33:3038–3049. doi: 10.1021/bi00176a037. [DOI] [PubMed] [Google Scholar]
- 97.Wootton JC, Federhen S. Statistics of local complexity in amino acid sequences and sequence databases. Comput Chem. 1993;17:149–163. [Google Scholar]
- 98.Smith TF, Waterman MS. Identification of common molecular subsequences. J Mol Biol. 1981;147:195–197. doi: 10.1016/0022-2836(81)90087-5. [DOI] [PubMed] [Google Scholar]
- 99.Shannon P, Markiel A, Ozier O, Baliga NS, Wang JT, Ramage D, Amin N, Schwikowski B, Ideker T, Cytoscape A software environment for integrated models of biomolecular interaction networks. Genome Res. 2003;13:2498–2504. doi: 10.1101/gr.1239303. [DOI] [PMC free article] [PubMed] [Google Scholar]
- 100.Robinson MD, Grigull J, Mohammad N, Hughes TR, Fun Spec A web-based cluster interpreter for yeast. BMC Bioinformatics. 2002;3:35. doi: 10.1186/1471-2105-3-35. [DOI] [PMC free article] [PubMed] [Google Scholar]
- 101.Crooks GE, Hon G, Chandonia JM, Brenner SE. WebLogo: A sequence logo generator. Genome Res. 2004;14:1188–1190. doi: 10.1101/gr.849004. [DOI] [PMC free article] [PubMed] [Google Scholar]
- 102.Schneider TD, Stephens RM. Sequence logos: A new way to display consensus sequences. Nucleic Acids Res. 1990;18:6097–6100. doi: 10.1093/nar/18.20.6097. [DOI] [PMC free article] [PubMed] [Google Scholar]
- 103.Ghaemmaghami S, Huh WK, Bower K, Howson RW, Belle A, Dephoure N, O'Shea EK, Weissman JS. Global analysis of protein expression in yeast. Nature. 2003;425:737–741. doi: 10.1038/nature02046. [DOI] [PubMed] [Google Scholar]
- 104.Gelperin DM, White MA, Wilkinson ML, Kon Y, Kung LA, Wise KJ, Lopez-Hoyo N, Jiang L, Piccirillo S, Yu H, Gerstein M, Dumont ME, Phizicky EM, Snyder M, Grayhack EJ. Biochemical and genetic analysis of the yeast proteome with a movable ORF collection. Genes Dev. 2005;19:2816–2826. doi: 10.1101/gad.1362105. [DOI] [PMC free article] [PubMed] [Google Scholar]
- 105.Zhu H, Bilgin M, Bangham R, Hall D, Casamayor A, Bertone P, Lan N, Jansen R, Bidlingmaier S, Houfek T, Mitchell T, Miller P, Dean RA, Gerstein M, Snyder M. Global analysis of protein activities using proteome chips. Science. 2001;293:2101–2105. doi: 10.1126/science.1062191. [DOI] [PubMed] [Google Scholar]
- 106.Abramoff MD, Magalhaes PJ, Ram SJ. Image processing with ImageJ. Biophotonics Int. 2004;11:36–42. [Google Scholar]
Associated Data
This section collects any data citations, data availability statements, or supplementary materials included in this article.
Supplementary Materials
Fig. S1. Schematic of the phylo-HMM approach.
Fig. S2. Regions with no conserved segments are not detected by the phylo-HMM approach.
Fig. S3. Newly identified KEN box in Spt21 and Cbk1 interaction motif in Ssd1 are conserved in further yeast species.
Fig. S4. Simulation of protein evolution.
Fig. S5. Performance of the phylo-HMM approach on literature-curated short linear motifs.
Fig. S6. Binding of FxFP peptides to Cbk1.
Fig. S7. Phylogenetic tree of species used for this study.
Table S1. Predictions on the yeast proteome by the phylo-HMM approach. Short conserved sequences were predicted on the yeast proteome using our phylo-HMM approach. Each motif is represented by a unique identifier, as well as the gene that contains it (systematic name), its position and sequence within the S. cerevisiae protein.)
Table S2. Literature-curated characterized short linear motifs. A set of short linear motifs in yeast proteins was curated from the literature. Each short linear motif is defined by the gene that contains it (standard name and systematic name), the reported function of the motif within the gene, the regulator that interacts with the motif, its position within the protein and the sequence of amino acids reported. The reference for this information is included for each short linear motif. The following columns indicate whether the motif is found in unstructured regions (by our definition) and whether the motif was predicted by the phylo-HMM. If the motif could be defined by a consensus sequence and was found in unstructured regions, the fraction of species that contained this consensus sequence is shown. For short linear motifs that matched a known consensus, if this fraction was above 90%, we considered the consensus sequence to be conserved. For short linear motifs that did not match a known consensus, in some cases we inspected the alignment by eye and indicated these as ‘considered conserved’ if we could identify them in many species.Table S3. Enrichment analysis of motifs matching known consensus sequences. (Excel file)
Table S3. Enrichment analysis of motifs matching known KEN-box mediated APC/C degradation consensus sequences
Table S4. Clusters of similar short conserved sequences. Three tables show the results from three different cluster analyses that used different metrics to assign sequence similarity between motifs. The first table describes the results using an all-by-all pairwise distance measure (described in Methods) between the predicted segments. The second table describes the results after first extending either side of the motifs by five residues before applying the all-by-all distance measure. Using the same extended motifs, the third table describes the results considering only the top 10 most similar motifs as similar. Each motif is represented by its identifier as in Table S1, the sequence that was used in the cluster analysis, the gene that contains the motif, its position within the S. cerevisiae protein, and the cluster where it is found.