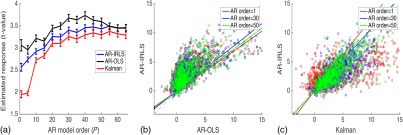
Fig. 4.
The performance of the AR-IRLS, AR-OLS, and Kalman models was examined as a function of the AR model order (). 1000 simulations were generated at a CNR of 1.0 and estimated using the three approaches at model orders from 1 to 65. (a) The average (and standard errors) of the 1000 simulations at each AR model order. (b) and (c) Scatter plots of the individual results from the , and 50 models for the comparison of the AR-IRLS/AR-OLS and AR-IRLS/Kalman models, respectively. The best-fit lines are also presented.

