

Abstract
Extracellular vesicles (EVs) range in size from 50 nm to 1 μm. Flow cytometry (FCM) is the most commonly used method for analyzing EVs; however, accurate characterization of EVs remains challenging due to their small size and lack of discrete positive populations. Here we report the use of optimization techniques that are especially well-suited for analyzing EVs from a high volume of clinical samples. Utilizing a two pronged approach that included 1) pre-filtration of antibodies to remove aggregates, followed by 2) detergent lysis of a replicate sample to account for remaining false positive events, we were able to effectively limit false positive non-EV events. In addition, we show that lysed samples are a useful alternative to isotypes for setting gates to exclude background fluorescence. To reduce background we developed an approach using filters to “wash” samples post-staining thus providing a faster alternative to ultracentrifugation and sucrose gradient fractionation. In conclusion, use of these optimized techniques enhances the accuracy and efficiency of EV detection using FCM.
Keywords: microparticles, flow cytometry, antibody aggregates, filtration, extracellular vesicles
STATEMENT OF PURPOSE
Extracellular vesicles (EVs) are small, submicron-sized vesicles released from multiple cell types (1) that play an important role in intercellular communication (2). EVs range in size from 50 nm to 1 μm, roughly 1/200th-1/10th the size of an average human cell (3) and can be detected in bodily fluids such as blood, urine, semen, and saliva (2). EVs can be further categorized into smaller groups of cell-derived vesicles such as exosomes and apoptotic bodies on the basis of their size and mechanism of formation (4). The classification and nomenclature of cell-derived vesicles continues to be a topic of ongoing debate (4,5), however, here we will use the general term “EVs” to refer to all types of extracellular biological vesicles released by cells.
Though once considered to be uninteresting debris and discounted as mere artifact, EVs are increasingly being recognized as ubiquitous, key players in the body’s complex network of intercellular signaling (6,7). The rate of EV release, while constitutive in healthy cells, is greatly increased when cells are subjected to stress, activation, stimulation, or disease (7–9). EVs express different surface markers depending on their cell of origin and immune or coagulation activation status (2,10,11). Expression of these markers enables EVs to act as physiological signal mediators, playing either immunosuppressive or immunostimulatory roles in cell-cell communication (12,13) in addition to affecting coagulation and vasoregulation (14). Some circulating EVs have been shown to promote tumor progression by suppressing immune function (15–19) and supporting tumor cell migration in metastasis (20–23), while others have been shown to suppress disease progression by conferring therapeutic benefit in the treatment of diseases such as ischemia (24) and kidney disease (25). Clinically, EVs have a wide range of applications in diagnostics and disease therapy. EVs in biological fluids can be monitored for disease biomarkers, as concentrations of some EVs are known to be associated with increased risk of specific diseases and cancers, including lymphoma (26), lung (27), breast, gastric (28), colorectal, prostate, kidney, and ovarian cancer (29–33) and cardiovascular disease (34). In addition to their use in disease monitoring, some researchers are utilizing EVs to develop new treatments and anticancer therapies. The roles of certain EV subtypes to inhibit tumor growth has been investigated as a potential treatment for cancer (35,36). More recently, researchers have shown that EVs can be manipulated to deliver tailored therapeutic cargo to specific targets within the body (37,38).
A number of methods have been used to analyze EVs, including scanning electron microscopy (39,40), transmission electron microscopy (41), atomic force microscopy and dynamic light scattering (42–45), and western blotting (46,47). Clinically, flow cytometry (FCM) is the most commonly used method for analyzing EVs in blood (5,48–50); however, accurate characterization of EVs remains challenging. Perhaps some of the most significant problems associated with measuring EVs using FCM stem from the ability/sensitivity of this method to properly discriminate positive from negative events. This is due mainly to the small size of the EVs, which results in 1) less fluorescence emitted due to the fewer number of antigens per particle and 2) limited feasibility of post-stain washing to reduce background fluorescence. Furthermore, because FCM uses a triggering threshold to initiate a signal, electronic noise and particulates in the sheath and sample buffer can generate very high background signals, which can drown out/overwhelm very small signals created by EVs. Using a side scatter threshold, researchers have reported being able to differentiate 100 nm from 300 nm beads (48), however, EVs have a lower refractive index than beads which limits their detection at these lower limits. Some researchers prefer to use a fluorescent channel as the triggering threshold (51), however, this is complicated by the fact that no pan-specific marker for all EVs exists. Annexin V, once considered to be a robust EV marker by binding to EV surface phosphatidylserine (PS), has more recently been shown to fail to bind to the majority of EVs (52,53), with binding being greatly affected by calcium concentrations and pre-analytical conditions (54). Therefore, while specific subpopulations may be better detected using a fluorescence threshold, all other subpopulations (those not carrying the fluorescent marker) will not be detected using this method. When analyzing very small particles, accuracy depends on the proper discrimination of EVs from other non-cell-derived particles and on thorough removal of background noise. Prior publications have noted difficulties associated with using FCM to analyze EVs, including false-positive signals arising from EV-mimicking immune complexes (55,56), self-aggregation of antibodies due to agitation (57), and limited applicability of traditionally used FCM controls such as FMO (fluorescence minus one) and/or antibody isotypes (58). EV sample collection and processing is yet another area in which standardization is needed, yet no consensus exists on an optimal protocol (59–61). Many different pre-analytical variables have been shown to affect EV content, including storage temperature and duration (62,63), anticoagulant/preservative used (62,64), and centrifugation method used (59,63). Specialized techniques and optimized protocols have been recommended (61); however, there is no consensus on the best method for EV detection by FCM.
Our laboratory is performing flow cytometric analyses of the circulating EV concentration and phenotype in critically ill patients transfused with blood stored for short vs. standard storage periods. Faced with a high volume of samples to test, we needed to refine our protocol in a way that would both minimize processing time and maximize accuracy and efficiency. Here we present the results of EV optimization studies that were performed on healthy controls to ensure the accuracy and efficiency of EV analysis before quantifying EVs in plasma from study subjects. Our optimization experiments focused on four key areas: removal of aggregated fluorochrome-conjugated antibodies prior to EV staining, washing of EVs after staining, the optimal control sample to use as the basis of setting gates to count positive EV events, and the effect of EV concentration on EV quantitation and the proportion of positive events measured.
MATERIALS AND METHODS
Study subjects
Study samples were obtained from subjects in the Age of Blood Evaluation (ABLE) trial (65). Intensive care unit (ICU) patients were randomly assigned to receive either fresh (< 7 days’ storage) or standard (expected mean ≈ 21 days’ storage) blood for transfusion. Whole blood was collected from these patients on day 0 (before transfusion) and on days 2, 6, and 28 post-transfusion. Some optimization steps were performed using samples from discarded Trima leukoreduction system chambers (LRSCs) from Blood Centers of the Pacific or from whole blood collected from six healthy volunteers in citrate tubes. All human subject samples were tested under an institutional review board (IRB) approved protocol and with informed consent of the subjects.
EV and cell processing
EVs were isolated from whole blood using a common differential centrifugation technique described in the literature (59,66–68). Immediately after collection, tubes were centrifuged at 1,500 x g for 10 minutes to separate cells from the supernatant, then at 13,000 x g for 10 minutes to remove platelets. The supernatant was carefully removed, and this platelet-poor plasma (PPP) was used to study EV concentration and phenotype. PPP from six normal donors was combined to create a normal donor pool. Aliquots of 0.5 mL were stored at −80°C (refer to Figure 1A for overview). Some optimization steps used EVs which had been concentrated using an additional centrifugation or filtration step. In these instances, the EVs are referred to as “concentrated” in figure legends. When centrifugation was used to concentrate EVs, 3 mL of PPP was added to 32 mL PBS and spun for 60 minutes at 100,000 x g. MP pellets were re-suspended in 1 mL RPMI 1640 (Invitrogen) and stored at −80°C. When filtration was used to concentrate EVs, 1.5 mL of PPP was added to centrifugal filters and resuspended in 400 μL PBS for immediate analysis (see below for full filtration method protocol). Peripheral blood mononuclear cells (PBMCs) were isolated from Trima LRSCs on a Ficoll-Paque PLUS density gradient (GE Healthcare Bio-Sciences). Aliquots of 20 × 106 cells were frozen in media that contained 90% fetal bovine serum (HyClone) and 10% dimethyl sulfoxide (DMSO, Fisher Bio-Reagents) and stored in liquid nitrogen vapor.
Figure 1. Processing scheme and FCM setup.
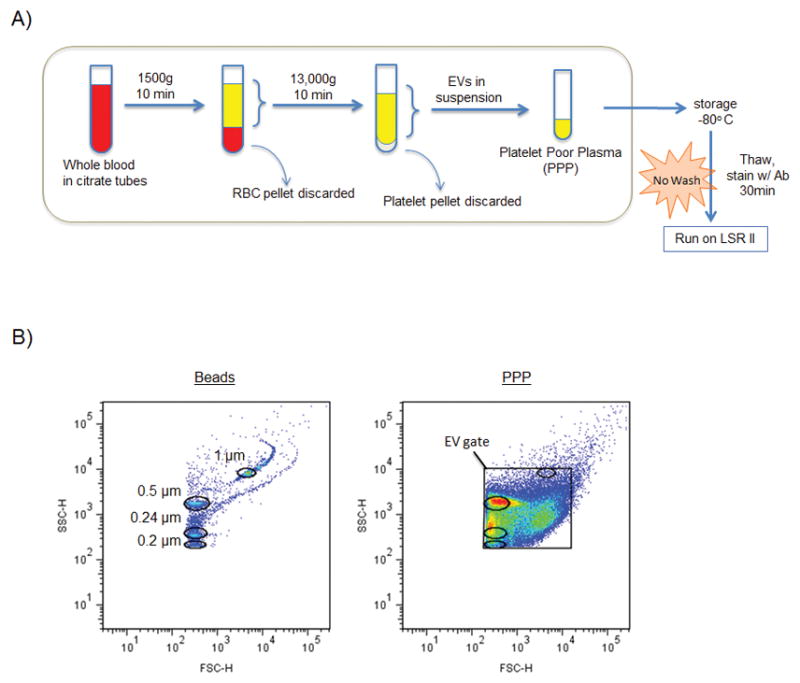
A: Initial method for isolation, storage, and analysis of EVs. Note: post-optimization protocol includes pre-stain antibody filtration and post-stain EV filtration steps. PPP = platelet poor plasma. B: Biparameter FSC-H vs. SSC-H dot plot showing locations of 0.2, 0.24, 0.5, and 1 μm sizing beads used to set up FSC and SSC voltages for FCM analysis. PBS alone (plot not shown because no events detected by cytometer) was also used to determine the maximum voltages able to exclude the majority of electronic noise. Right plot shows a PPP sample with the EV gate drawn and bead region gates overlaid.
Antibodies
In order to examine EVs for cell of origin markers (phenotype) and immune or coagulation activation markers, we used several different fluorochrome-conjugated monoclonal antibodies, including red blood cell markers: CD108-PE and CD235a-FITC, a platelet marker: CD41a-PerCP/Cy5.5, and leukocyte markers: CD3-PerCP/Cy5.5, CD19-Alexa700, CD28-FITC, CD16-V450, CD152-APC, CD14-APC/Cy7, and CD62L-APC. All isotyope controls were matched to their respective antibodies according to their fluorochrome type, concentration, heavy chain (IgA, IgG, IgD, IgE, or IgM), subclass and light chain class (kappa, lambda). Refer to Table 1 for a detailed summary of the antibodies that were used in the experiments described in this paper.
Table 1.
Antibody characteristics
| Marker | Fluorochrome | Mfgr | Cat# | Clone | Isotype |
|---|---|---|---|---|---|
| CD3 | PerCP-Cy5.5 | Biolegend | 344808 | sk7 | Ms IgG1, κ |
| CD14 | APC-Cy7 | Biolegend | 301820 | M5E2 | Ms IgG2a, κ |
| CD16 | V450 | BD | 560474 | 3G8 | Ms IgG1, κ |
| CD28 | FITC | Biolegend | 302906 | CD28.2 | Ms IgG1, κ |
| CD152 | APC | BD | 555855 | BNI3 | Ms IgG2a, κ |
| CD19 | A700 | Biolegend | 302226 | HIB19 | Ms IgG1, κ |
| CD41a | PerCP-Cy5.5 | BD | 340930 | HIP8 | Ms IgG1, κ |
| CD108 | PE | BD | 552830 | KS-2 | Ms IgG2a, κ |
| CD62L | APC | Biolegend | 304810 | Dreg56 | Ms IgG1, κ |
| CD235a | FITC | Biolegend | 349104 | GA-R2 (HIR2) | Ms IgG2a, κ |
Antibody Labeling
PPP samples were rapidly thawed and 50 or 100 μL were added to 2 to 5 μL of each monoclonal antibody. Prior to testing EV samples, each antibody was titrated using a series of serial dilutions to determine the “saturating” concentration (the lowest concentration which yielded nearly maximal fluorescence). Samples were incubated at 4°C for 30 minutes and either filtered or re-suspended in 400 μL PBS for immediate FCM analysis.
Absolute Count Analysis
TrucountTM tubes (BD Biosciences) with a known number of fluorescent beads were utilized for EV quantification. To each TrucountTM tube, 50 μL sample and 350 μL PBS were added and samples were read immediately on the flow cytometer. EV concentrations were calculated using the following equation:
Data Collection
Acquisition was performed using a 3-laser (20 mW Coherent Sapphire 488 nm blue, 25 mW Coherent Vioflame 405 nm violet, and 17 mW JDS Uniphase HeNe 633nm red) LSR II benchtop flow cytometer equipped with FACS Diva 6.0 software (BD Biosciences). Specific cytometer parameters and filter configurations used for acquisition are outlined in Table 2. Flow cytometer setup was performed using CS&T instrument setup beads (BD Biosciences). Forward scatter (FSC) and side scatter (SSC) parameters were set to log mode and the lowest threshold allowed by the cytometer (200) was selected for each. Compensation setup was performed using AbC beads (Invitrogen) and compensation values were determined by FACS Diva software. FSC/SSC voltages were set to the highest values that excluded the majority of background noise (i.e., just below the voltage threshold at which event rate surpassed 5 events/second while running a tube of PBS alone). Typically, this threshold occurred at FSC and SSC voltages of around 500–600 and 300–350, respectively. Rainbow fluorescent particles (Spherotech) were used to adjust all channel voltages between batches in order to maintain voltage consistency from run to run. Figure 1B shows the location of the EV gate in relation to 0.2, 0.24, 0.5, and 1 μm beads (0.5 mL of Biocytex Megamix-Plus SSC beads combined with 1–2 drops of Spherotech Ultra Rainbow Fluorescent Particles). These beads cannot be used to determine EV size but are useful for showing the relative PS sizes of EVs detected. All samples were acquired at low sample pressure and low flow rate (approximately 8–12 μL/min). In pre-optimization experiments (Figure 2 and Supplementary Information Figures 1 and 2), collection of 100,000 events was attempted for each sample, and in situations with very few events, tubes were run for at least 3 minutes. Post-optimization, each sample (including lysed samples) was run for exactly 1 or 2 minutes to allow for the subtraction of false positive events detected in the lysed sample over an equal time frame. FCS files were exported and data were evaluated using FlowJo software (Treestar US, Mac version 9.6.1 or PC version 7.6.5).
Table 2.
LSR II configuration
| Laser | Detector | LP Mirror | BP Filter | Fluorochrome | Marker | Alt. Marker |
|---|---|---|---|---|---|---|
| Blue | A | 735 | 780/60 | PE-Cy7 | - | - |
| B | 685 | 695/20 | PerCP-Cy5.5 | CD3 | CD41a | |
| C | 635 | 670/14 | - | - | - | |
| D | 552 | 575/26 | PE | CD108 | - | |
| E | 505 | 530/30 | FITC | CD28 | CD235a | |
| F | - | 488/10 | SSC | - | - | |
| Violet | A | 505 | 525/50 | - | - | |
| B | – | 440/40 | V450 | CD16 | - | |
| Red | A | 735 | 780/60 | APC-Cy7 | CD14 | - |
| B | 685 | 720/45 | Alexa 700 | CD19 | - | |
| C | - | 660/20 | APC | CD152 | CD62L |
LP = long wavelength pass, BP = band pass
Figure 2. Effectiveness of filtering and centrifuging to remove antibody aggregates.
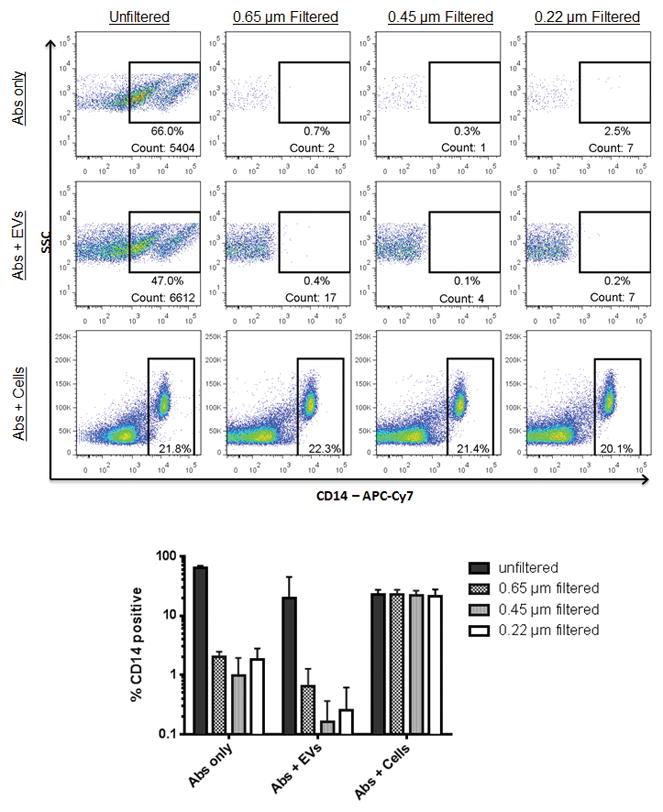
Unfiltered or filtered antibodies were added to PPP or PBMCs, and the percentage of CD14 positive events was determined. Events shown in the top two rows are within the FSC/SSC EV gate. Events shown in the bottom row are within the FSC/SSC lymphocyte gate. The bar graph shows the summary data from three replicate experiments.
Transmission Electron Microscopy
Transmission electron microscopy (TEM) was used to visualize antibodies using negative staining. Approximately 10 μL of each sample was added to a Formvar-coated 300-mesh copper grid and allowed to adhere for 2 min at room temperature. Excess liquid was removed by blotting the edge of the grid with filter paper. Next, a drop of 2% aqueous uranyl acetate solution was applied to the grid for 30 seconds. The excess stain was removed as before and the specimens were examined by TEM using a JEOL JEM-1400 electron microscope.
Lysis Step
In order to discriminate between EVs and protein aggregates, we used a lysis technique similar to that described by György et al. (55) to reveal false-positive events. A non-ionic detergent, 10% Nonidet P-40 (NP-40) (New England Biolabs, Inc.) was used to lyse EVs. After an initial reading on the flow cytometer, stained EV samples were added to 20 μL of 10% NP-40 (final concentration 0.5 % NP-40). Samples were then re-read and compared to the initial reading. Antibody-positive events remaining in the lysed sample were subtracted from the positive events in the initial reading to determine the proportion of true EVs.
Filtration
Antibody filtration was performed prior to staining using Ultrafree®-MC/Durapore®-PVDF centrifugal filter units of various pore sizes (0.1, 0.22, 0.45, and 0.65 μm, Millipore). For each panel, titrated antibodies (2–5 μL each) were combined and added to the top of a filter, the tube was centrifuged in a fixed-angle single speed microcentrifuge (Fisher Scientific) for approximately 30 seconds, and the filtrate was used for staining. Post-stain filtration was performed using the same filters and same filtration process, however, the filtrate was discarded and EVs remaining on the filter surface were resuspended in 400 μL PBS and saved for flow analysis. Originally post-stain filtration was performed at 600 x g for 30 seconds. After testing a variety of PPP samples, it was ultimately decided that an increase to 800 x g for 2–5 min would be necessary to accommodate all PPP samples, some of which required a slightly higher force to move through the filter effectively.
Statistical Analysis
Nonlinear regression analysis using a semi-log line was used to assess the correlation between EV concentration and percentages of antibody-positive events. The two-way ANOVA test followed by Tukey’s multiple comparisons test was used to evaluate differences in the percentages of CD14+ events after different sized filters were used to remove antibody aggregates in EVs and PBMCs. For EV dilution experiments slopes were determined by nonlinear regression analysis using a log-log line, and R-squared values were determined by nonlinear regression analysis using a log-log line and slope constraint equal to −1.0 in order to assess goodness-of-fit. The t-test corrected for multiple comparisons using the Holm-Sidak method was used for comparing the numbers of antibody-positive events remaining after filtration or centrifugation was used to remove antibody aggregates. The two-tailed t-test for paired comparisons was used to compare the mean percentages of antibody-positive events before and after post-stain filtration. Statistical significance was defined as p<0.05. All statistical analyses were performed using Prism 5 (GraphPad Software).
RESULTS AND DISCUSSION
Antibody aggregates fall within the EV FSC/SSC gate
Platelet-poor plasma (PPP) was isolated from clinical study or normal donor patient samples using a differential centrifugation process commonly found in the literature (59,66–68) (Fig. 1A). Some of the larger EVs may have been removed with the relatively long duration centrifugation that we used. The general techniques we describe in this paper, however, are applicable to all FCM analysis of EVs and not specific to EVs derived from PPP. Samples were then stained with one or more antibody-conjugated fluorochromes. When ABLE study samples were tested, which varied widely in EV concentration (EV/μL), a negative correlation between EV concentration and the proportion positive for cellular markers was found. The samples taking the longest to acquire 100,000 events on the cytometer, i.e., samples having the lowest EV concentrations, had the highest background and thus the highest number of positive events. Supplementary Information Figure 1A shows the results of EV analysis of two representative donors, one with a low concentration of EVs (top row) and one with a high concentration (bottom row). Plotting results from all donors revealed a significant negative correlation between EV concentration and positive events for four markers (Supplementary Information Figure 1B). To test whether the positive events could be due to artifact, antibody alone in PBS (without EVs added) was tested, and the same pattern of positive events was observed as in the samples having low EV concentration (Supplementary Information Figure 1C). Since the antibody without EV sample showed more signal than the antibody with EV, this suggested that the signal was artifactual.
Eliminating Antibody Aggregates
To eliminate false positive events, the efficacy of filters to remove presumed antibody aggregates from the EV gate was tested. We experimented using several different sized filters (0.1, 0.22, 0.45, and 0.65 μm) and found that all filters were highly effective at removing aggregates without compromising the antibody’s ability to stain PBMCs (Fig. 2). Next, to determine the most suitable method for removing antibody aggregates, we compared our filtration method against a common centrifugation method found in the literature (17000 x g for 5 min) (69). Filtration was more effective than centrifugation at removing aggregates from all antibodies tested, and this was confirmed by electron microscopy (Supplementary Information Figure 2). Of note, longer centrifugation times than we used in the current experiments have been described (69), but we only tested a five minute centrifugation in the current work in an attempt to develop a protocol suited to high-throughput sample analysis. Similar 5-minute centrifugation protocols to remove antibody aggregates were recommended by other researchers as well, including 16,000 x g for 5 min (70) and 18,000 x g for 5 min (63). Antibodies filtered with smaller pore sizes were equally as effective as those filtered with larger pore sizes. We did not experience problems with clogging of the filters using any pore size during antibody filtration. One drawback to using filters for antibody aggregate removal is the cost; the retail price of each filter is approximately $2. However, because all antibodies can be combined in one tube before filtering, if 40 samples were run per batch, the cost would be 5 cents per sample. In batched analyses the filter for removing antibody aggregates comprises a small fraction of the total cost of testing each sample.
EV Gating Strategies
The final step in successfully analyzing flow cytometry data is setting gates to separate positive from negative events. Many researchers use isotypes to do this (60,71,72), though a lysis method for identifying false positive EV events has been described (55,56). The lysis step utilizes a detergent to disrupt EVs, with immune complexes and other non-EV related events remaining after detergent lysis eliminates the EVs. In samples with paired lysed and unlysed samples, the lack of a true EV population expressing CD16 can be appreciated (Supplementary Information Figure 3A). After optimizing the use of a lysis step, lysed samples were compared to isotype stained samples for setting background fluorescence gates (Supplementary Information Figure 3B). In these examples the donor’s lysed sample was superior to the isotype control for defining background fluorescence for the CD235a and CD41a antibodies because the background more closely matched that of the fully stained Ab sample. Similarly, Figure 3 shows the ability of three different negative controls (FMO, isotypes, and lysed) to accurately predict the background fluorescence of a fully stained, non-post-stain-filtered sample. FMO controls provided an appropriate indication of background fluorescence for CD41a and CD62L but not for CD235a stains. Isotype controls accurately portrayed background fluorescence in CD235a and CD41a but failed to do so for CD62L. Background fluorescence of the lysed sample, on the other hand, matched all three markers in the fully stained sample. After analyzing a large panel of samples in a similar fashion to Figure 3, lysed controls worked as well as isotype controls for setting background fluorescence gates 72% of the time (83/116) and better than isotype controls in 28% of cases examined (33/116). These results demonstrate that the selection of an appropriate control sample to use for gating can vary depending on the antibody and marker measured.
Figure 3. Detergent lysis assists in setting gates for positive events.
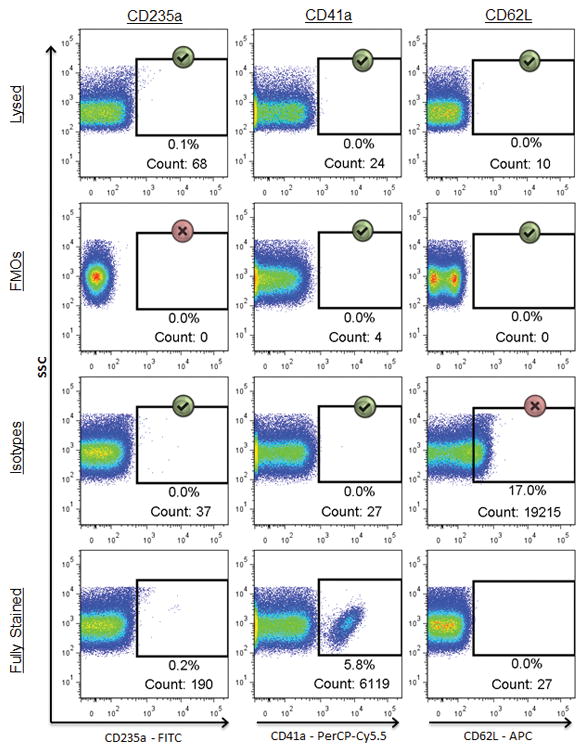
Events shown are within the FSC/SCC EV gate. Comparison of three different negative controls (FMO, isotype, or lysed) in their ability to provide appropriate indications of background fluorescence across three different markers in a fully stained sample (bottom row). Gates for each marker were made using the FMO (top row) and then copied to the rows beneath. Green check marks indicate instances in which the background fluorescence appropriately matches that of the corresponding marker in the fully stained sample, while the red X’s denote controls which poorly predicted the background fluorescence in the fully stained sample.
Currently many researchers using flow cytometry to analyze EVs use isotype controls as a means for setting positive vs. negative discrimination gates (55,56,60,71,72). However, our attempts to replicate the background of an antibody with its isotype proved to be difficult, as it was impossible to know whether the signal was true background or simply an artifact caused by the differences in spectral properties between the two stains. Indeed, a number of publications have noted similar issues associated with using isotype controls for this purpose (58,59). Isotype gates can vary widely depending on a number of factors including: antibody supplier, fluorochrome:protein ratio, antibody concentration, propensity for aggregation, and antibody subclass (7,48,58). Though these variables can be accounted for/controlled to a certain degree, it is difficult if not impossible to match perfectly the background fluorescence of a fluorochrome-conjugated antibody to that of its isotype. Considering the low number of antigens per EV (and correspondingly small fluorescence signal emitted), even minute differences in background signal between an antibody and its isotype will significantly affect proper gate placement and the ability to accurately distinguish positive events. Of all of the controls we tested (FMO, unstained, isotype, and lysed), lysed samples proved to be the most consistently reliable as an indicator of background fluorescence across all markers when samples were left unwashed after staining. Other researchers have reported the use of antigen-negative EVs as negative controls for setting background fluorescence gates (58). However, because background fluorescence can often vary from individual to individual, it may be inappropriate to apply the gates created from a single sample of entirely different origin to all clinical samples in the study. Furthermore, this method requires the use of twice the amount of antibodies as well as a working bank of EVs known to be negative for all antibodies in question, which poses logistical difficulties.
The use of a lysis method is an established practice in EV analysis for identifying false positive events (55); however its utility as a replacement for isotypes in determining background fluorescence has not yet been described. In our research we found that the lysis technique for gate placement worked as well or better than isotypes across all antibodies tested. It should be noted, however, that while using lysed samples for predicting background worked for our purposes, it may not necessarily be the best solution in all situations. One limitation of the lysis method is its inability to identify nonspecific binding of antibodies to EVs or other lipid vesicles such as chylomicrons. Furthermore, because lysis is not EV-specific, some non-EVs may become lysed and some small EVs may be resistant to lysis. For some, using a combination of the lysed sample and its isotype might work better than either alone for providing the best indication of background fluorescence for gate placement.
Washing after EV staining
Removing unbound antibody after staining EVs often requires the use of lengthy, multi-step washing procedures such as ultracentrifugation or sucrose fractionation. In an attempt to develop a protocol suited to high-throughput sample analysis, we developed a technique using filters to wash EVs post-staining. After staining with pre-filtered antibody panels, EVs were originally added atop 0.2 μm centrifugal filters with 300 μL PBS and centrifuged at low speed (approximately 600 x g) for 10–30 seconds. After testing a variety of PPP samples it was found that some required centrifugation at 800 x g for 2–5 minutes, which was the final protocol we adopted. The tops of the filters were resuspended in 400 μL PBS and analyzed using flow cytometry. Figure 4 shows the results using antibodies for which resolution was improved after implementing post-stain filtration to remove unbound antibody. Similar results were obtained with each antibody tested (data not shown). Assay reproducibility was tested across seven different markers in three experiments performed in triplicate on PPP from a single normal donor. Coefficients of variation (CVs) for non-post-stain-filtered samples were 38.7, 15.6, 11.6, 28.9, 40.1, 12.8, and 2.4 for the markers CD14, CD16, CD19, CD152, CD235a, CD108, and CD41a, respectively. Coefficients of variation for post-stain-filtered samples were 10.9, 40.7, 4.9, 11.3, 19.6, 16.4, and 7.5 for the same markers, which was not significantly different from the samples that were not post-stain filtered (p=0.45).
Figure 4.
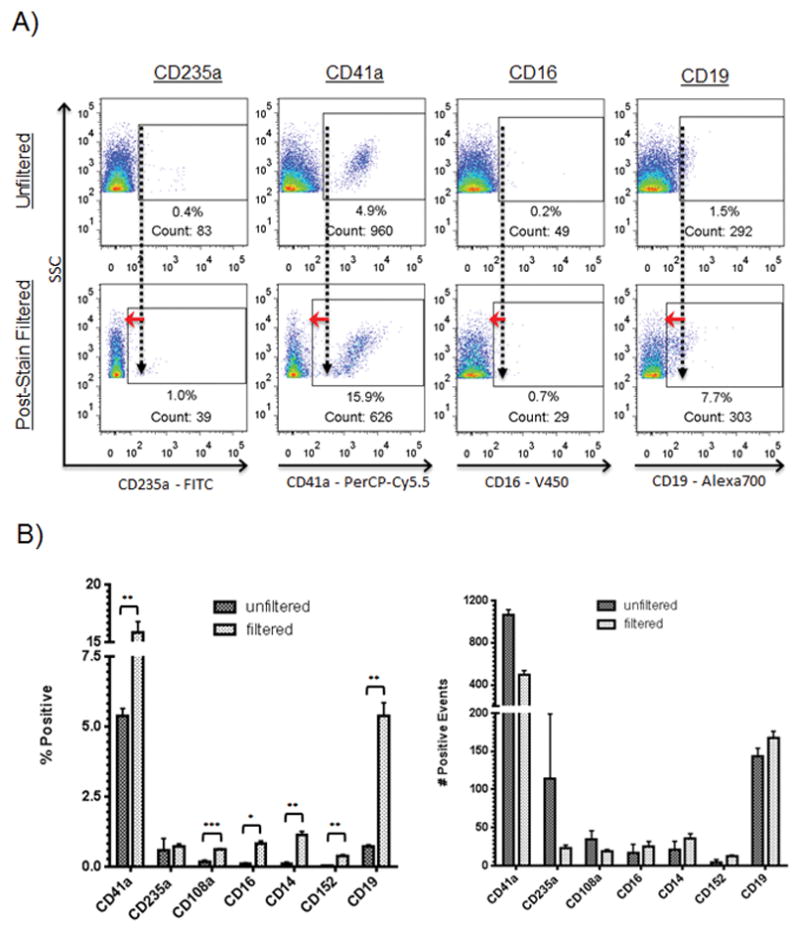
Effect of post-stain filtration. EV samples were acquired before and after post-stain filtration of aliquots of the same sample. Briefly, stained EV samples were added atop a 0.22 μm filter, centrifuged, and the EVs remaining on top resuspended in 400 μL PBS and read using FCM. A: Representative flow cytometric dot plots showing effect of post-stain filtration. Events shown are within the FSC/SSC EV gate. Values show percentages of positive events. EV samples were read before and after post-stain filtration. Antibodies were added to EVs for 30 minutes then either diluted and read immediately using FCM (top row) or post-stain filtered and then read (bottom row). Red arrows highlight the difference in background staining intensity. B: Effect of post-stain filtration on seven CD markers using EVs from normal donors run in triplicate in three experiments. *** p<0.0005, ** p<0.005., * p<0.05
Of the washing techniques currently used to remove unbound antibody post-staining, all are time-consuming, multi-step procedures not suitable for high-throughput analysis. The most common methods, ultracentrifugation and sucrose fractionation, require long processing times and expensive equipment. Density gradient techniques described in the literature require 14- to 20-hour centrifugations at forces of up to 192,000 x g (3,70). Here we report the use of a novel filtration technique for reducing background fluorescence that is simple, fast, and effective. It should be noted that a significant limitation of this method is the loss of particles such as exosomes and small EVs that are small enough to pass through the 220 nm filter. This is an important consideration, as increasing evidence suggests that these very small EVs comprise the active/functional fraction of EVs as a whole, at least in some settings (68). One solution to this limitation would be to recover the filtrate, couple the smaller EVs to beads to allow washing, and analyze bead-bound small EVs; however, this would limit one’s ability to measure co-expression of multiple antigens on single EVs. While the increase in signal-to-noise ratio is of obvious benefit, the loss of smaller EVs represents a significant limitation when considering any washing method (63).
Effect of EV Concentration on Assay Sensitivity
It has been described that the flow cytometer can detect multiple small vesicles simultaneously illuminated by the cytometer’s laser beam, counting them as a single event (50). The phenomenon of coincidence detection would presumably be more pronounced in samples with higher concentrations of EVs, which could affect the number and type of events detected. Figure 5 shows the results of six different dilutions of PPP on EV detection using FCM. PPP from five healthy donors was stained for CD41a, then post-stain filtered and resuspended in PBS. The samples were then serially diluted, and each was read for 60 seconds on a flow cytometer. While the percentage of positive events was fairly unpredictable at very low EV concentrations, the number of positive events detected within a fixed time frame decreased proportionally with dilution factor, yielding approximately the same calculated number of CD41a+ events at each dilution. CVs of CD41a+ calculated counts were 5.4, 9.8, 9.6, 16.3, and 8.4 for the five donors across all the dilutions, comparable to the CV of 7.5 for replicates of one sample tested undiluted presented in Figure 4. These data show that across the concentration range of approximately 100 to 100,000 positive events collected, the calculated count of EVs positive for CD41a did not vary substantially, implying that co-incident particle detection did not play a significant role in detecting particles >200 nm at the concentrations tested.
Figure 5.
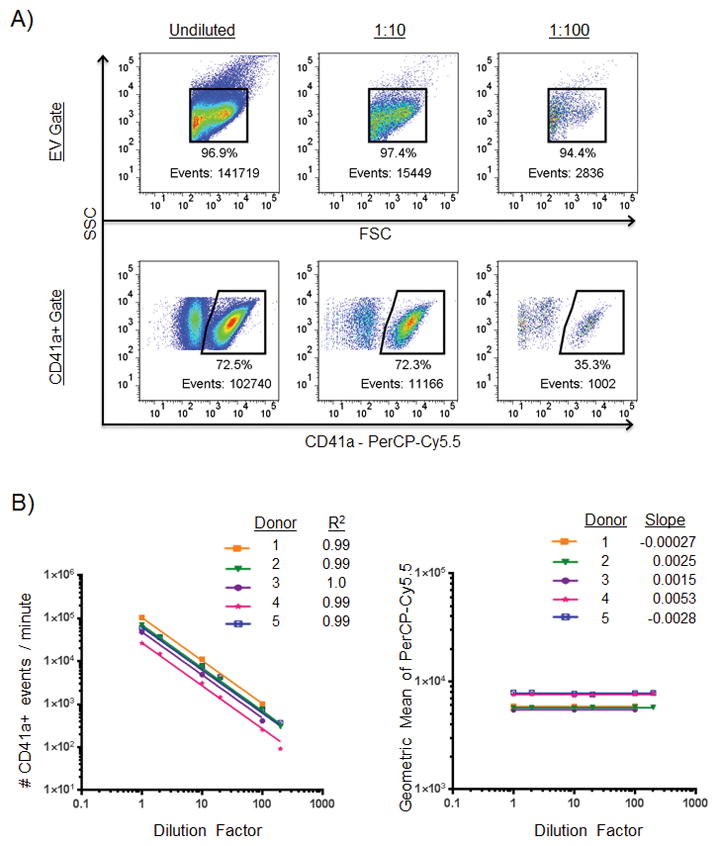
Effect of EV concentration on CD41a- positive marker detection. A: Representative plots showing an undiluted sample (left column) and the same sample diluted 1:10 (middle column) and 1:100 (right column). Events shown in the bottom row are within the FSC/SSC EV gate above. Events numbers within positive cell marker gates are more reliable than percentages within those gates or event numbers within total EV gates. B: Effect of EV concentration on number of CD41a positive events detected by the cytometer and geometric mean. Samples of PPP from five healthy normal donors were concentrated using filters then serially diluted to six different concentrations. The left plot shows the relationship between EV concentration and number of events. R-squared values indicate goodness-of-fit of each donor as determined by nonlinear regression analysis with slope constrained to −1.0. The right plot shows the relationship between EV concentration and the PerCP-Cy5.5 geometric mean intensities of CD41a+ events at each of the six dilutions. Slopes were determined by nonlinear regression analysis.
Because coincidence detection is dependent on the number of surrounding EVs in a given sample, we thought it might be necessary to normalize the EV concentration of each sample prior to analyzing with FCM. However, we found no evidence to support coincident particle counting in the dilution range we tested. In our dilution experiments we found that the percentages of positive events were equal and event counts were proportional to dilution factor between 1 x 10⁵ and 1 x 10⁶ EV/μL. With each 10-fold dilution, the number of positive events detected predictably dropped by a factor of 10. At higher dilutions, however, the percentages of events staining positive for a given marker became much less reliable due to a constant number of artifactual events in the denominator, while event counts staining positive for a given marker remained consistent with dilution factor. Whereas percentage varied considerably at higher dilutions (due to the noise making up a larger proportion of the denominator at higher dilutions), the number of positive events was consistent and reliable. With the analysis of these dilution experiments, we gained a new understanding of our results and learned that the best parameter to record was the number of positive events in a set time period, not percentage of positive EV events. With this finding, we changed our recording methods to place new emphasis on number of positive events collected within a fixed time frame, rather than percentage of the total EV population collected being positive for the marker in question. Because of the influence of background noise at low EV concentrations, we concluded that counting the number of positive events within a fixed time frame yielded more reproducible results than using the percentage of the total EV population being positive for the marker in question. The CVs in these dilution experiments (between 5.4–16.3, mean=9.9) were similar to the CV we observed in our reproducibility experiments (7.5), thus concentration is unlikely to play a huge role in our sample to sample variability.
CONCLUSION
Here we have presented optimization techniques that are especially well-suited for analyzing EVs from a high volume of clinical samples. In particular, we showed that 1) filters are a good alternative to centrifugation for removing antibody aggregates before staining, 2) lysed samples are a useful alternative to isotypes for setting gates to exclude background fluorescence, 3) filters can be used to “wash” samples post-staining thus providing a faster alternative to ultracentrifugation and sucrose gradient fractionation, and 4) normalization of EV concentration prior to staining is unnecessary in the concentration range we examined. Methods for EV analysis, while considerably improved over the last decade, are still a work in progress. Ultimately, the best methods for analyzing EVs will depend on the individual lab’s needs and tools available to the researcher. The techniques described here will assist with eliminating the antibody aggregates commonly found in commercial preparations, increasing signal–to-noise ratio, and setting gates in a rational fashion that minimizes detection of background fluorescence.
Supplementary Material
Acknowledgments
The authors would like to thank Dale Hirschkorn from BSRI for his help with flow cytometer instrument settings and Larry Ackerman from the Diabetes and Endocrinology Research Center Microscopy Core at University of California, San Francisco for processing samples for electron microscopy. This work was supported by NIH grants HL095470 and U01 HL072268 and DoD contracts W81XWH-10-1-0023 and W81XWH-2-0028.
Footnotes
Author Contributions
H.C.I. designed and performed the experiments, analyzed and interpreted the data, and wrote the manuscript. A.D. designed and performed the experiments. A.S. and J.L. coordinated collection of study participant samples. P.C.S. coordinated collection of study participant samples and edited the paper. P.J.N. designed the experiments, interpreted the data, and edited the paper.
Conflict of Interest Disclosures
The authors have no conflict of interest to disclose.
References
- 1.Momen-Heravi F, Balaj L, Alian S, Mantel P-Y, Halleck AE, Trachtenberg AJ, Soria CE, Oquin S, Bonebreak CM, Saracoglu E, Skog J, Kuo WP. Current methods for the isolation of extracellular vesicles. Biol Chem. 2013;394:1253–62. doi: 10.1515/hsz-2013-0141. [DOI] [PMC free article] [PubMed] [Google Scholar]
- 2.Raposo G, Stoorvogel W. Extracellular vesicles: Exosomes, microvesicles, and friends. J Cell Biol. 2013;200:373–383. doi: 10.1083/jcb.201211138. [DOI] [PMC free article] [PubMed] [Google Scholar]
- 3.Nolte-’t Hoen ENM, van der Vlist EJ, Aalberts M, Mertens HCH, Bosch BJ, Bartelink W, Mastrobattista E, van Gaal EVB, Stoorvogel W, Arkesteijn GJA, Wauben MHM. Quantitative and qualitative flow cytometric analysis of nanosized cell-derived membrane vesicles. Nanomedicine Nanotechnol Biol Med. 2012;8:712–720. doi: 10.1016/j.nano.2011.09.006. [DOI] [PMC free article] [PubMed] [Google Scholar]
- 4.Barteneva NS, Fasler-Kan E, Bernimoulin M, Stern JN, Ponomarev ED, Duckett L, Vorobjev IA. Circulating microparticles: square the circle. BMC Cell Biol. 2013;14:23. doi: 10.1186/1471-2121-14-23. [DOI] [PMC free article] [PubMed] [Google Scholar]
- 5.Van der Pol E, Böing AN, Harrison P, Sturk A, Nieuwland R. Classification, functions, and clinical relevance of extracellular vesicles. Pharmacol Rev. 2012;64:676–705. doi: 10.1124/pr.112.005983. [DOI] [PubMed] [Google Scholar]
- 6.Cocucci E, Racchetti G, Meldolesi J. Shedding microvesicles: artefacts no more. Trends Cell Biol. 2009;19:43–51. doi: 10.1016/j.tcb.2008.11.003. [DOI] [PubMed] [Google Scholar]
- 7.Furmanski P. Revealing the mechanism of tissue damage due to tobacco use: finally, a smoking gun? Am. J Pathol. 2013;182:1489–1493. doi: 10.1016/j.ajpath.2013.02.004. [DOI] [PubMed] [Google Scholar]
- 8.Vasina EM, Cauwenberghs S, Feijge MAH, Heemskerk JWM, Weber C, Koenen RR. Microparticles from apoptotic platelets promote resident macrophage differentiation. Cell Death Dis. 2011;2:e210. doi: 10.1038/cddis.2011.94. [DOI] [PMC free article] [PubMed] [Google Scholar]
- 9.Dignat-George F, Boulanger CM. The Many Faces of Endothelial Microparticles. Arterioscler Thromb Vasc Biol. 2011;31:27–33. doi: 10.1161/ATVBAHA.110.218123. [DOI] [PubMed] [Google Scholar]
- 10.Mathivanan S, Ji H, Simpson RJ. Exosomes: Extracellular organelles important in intercellular communication. J Proteomics. 2010;73:1907–1920. doi: 10.1016/j.jprot.2010.06.006. [DOI] [PubMed] [Google Scholar]
- 11.Strasser EF, Happ S, Weiss DR, Pfeiffer A, Zimmermann R, Eckstein R. Microparticle detection in platelet products by three different methods. Transfusion (Paris) 2013;53:156–166. doi: 10.1111/j.1537-2995.2012.03720.x. [DOI] [PubMed] [Google Scholar]
- 12.Sugawara A, Nollet KE, Yajima K, Saito S, Ohto H. Preventing platelet-derived microparticle formation--and possible side effects-with prestorage leukofiltration of whole blood. Arch Pathol Lab Med. 2010;134:771–775. doi: 10.5858/134.5.771. [DOI] [PubMed] [Google Scholar]
- 13.Théry C, Ostrowski M, Segura E. Membrane vesicles as conveyors of immune responses. Nat Rev Immunol. 2009;9:581–593. doi: 10.1038/nri2567. [DOI] [PubMed] [Google Scholar]
- 14.Spinella PC, Sparrow RL, Hess JR, Norris PJ. Properties of stored red blood cells: understanding immune and vascular reactivity. Transfusion (Paris) 2011;51:894–900. doi: 10.1111/j.1537-2995.2011.03103.x. [DOI] [PMC free article] [PubMed] [Google Scholar]
- 15.Andreola G, Rivoltini L, Castelli C, Huber V, Perego P, Deho P, Squarcina P, Accornero P, Lozupone F, Lugini L, Stringaro A, Molinari A, Arancia G, Gentile M, Parmiani G, Fais S. Induction of Lymphocyte Apoptosis by Tumor Cell Secretion of FasL-bearing Microvesicles. J Exp Med. 2002;195:1303–1316. doi: 10.1084/jem.20011624. [DOI] [PMC free article] [PubMed] [Google Scholar]
- 16.Huber V, Fais S, Iero M, Lugini L, Canese P, Squarcina P, Zaccheddu A, Colone M, Arancia G, Gentile M, Seregni E, Valenti R, Ballabio G, Belli F, Leo E, Parmiani G, Rivoltini L. Human Colorectal Cancer Cells Induce T-Cell Death Through Release of Proapoptotic Microvesicles: Role in Immune Escape. Gastroenterology. 2005;128:1796–1804. doi: 10.1053/j.gastro.2005.03.045. [DOI] [PubMed] [Google Scholar]
- 17.Kim JW, Wieckowski E, Taylor DD, Reichert TE, Watkins S, Whiteside TL. Fas Ligand–Positive Membranous Vesicles Isolated from Sera of Patients with Oral Cancer Induce Apoptosis of Activated T Lymphocytes. Clin Cancer Res. 2005;11:1010–1020. [PubMed] [Google Scholar]
- 18.Taylor DD, Gerçel-Taylor Ç, Lyons KS, Stanson J, Whiteside TL. T-Cell Apoptosis and Suppression of T-Cell Receptor/CD3-ζ by Fas Ligand-Containing Membrane Vesicles Shed from Ovarian Tumors. Clin Cancer Res. 2003;9:5113–5119. [PubMed] [Google Scholar]
- 19.Valenti R, Huber V, Iero M, Filipazzi P, Parmiani G, Rivoltini L. Tumor-Released Microvesicles as Vehicles of Immunosuppression. Cancer Res. 2007;67:2912–2915. doi: 10.1158/0008-5472.CAN-07-0520. [DOI] [PubMed] [Google Scholar]
- 20.Dolo V, D’Ascenzo S, Violini S, Pompucci L, Festuccia C, Ginestra A, Vittorelli ML, Canevari S, Pavan A. Matrix-degrading proteinases are shed in membrane vesicles by ovarian cancer cells in vivo and in vitro. Clin Exp Metastasis. 1999;17:131–140. doi: 10.1023/a:1006500406240. [DOI] [PubMed] [Google Scholar]
- 21.Ginestra A, La Placa MD, Saladino F, Cassarà D, Nagase H, Vittorelli ML. The amount and proteolytic content of vesicles shed by human cancer cell lines correlates with their in vitro invasiveness. Anticancer Res. 1998;18:3433–3437. [PubMed] [Google Scholar]
- 22.Rak J. Microparticles in Cancer. Semin Thromb Hemost. 2010;36:888–906. doi: 10.1055/s-0030-1267043. [DOI] [PubMed] [Google Scholar]
- 23.Hood JL, San RS, Wickline SA. Exosomes Released by Melanoma Cells Prepare Sentinel Lymph Nodes for Tumor Metastasis. Cancer Res. 2011;71:3792–3801. doi: 10.1158/0008-5472.CAN-10-4455. [DOI] [PubMed] [Google Scholar]
- 24.Ranghino A, Cantaluppi V, Grange C, Vitillo L, Fop F, Biancone L, Deregibus MC, Tetta C, Segoloni GP, Camussi G. Endothelial progenitor cell-derived microvesicles improve neovascularization in a murine model of hindlimb ischemia. Int J Immunopathol Pharmacol. 2012;25:75–85. doi: 10.1177/039463201202500110. [DOI] [PubMed] [Google Scholar]
- 25.Gatti S, Bruno S, Deregibus MC, Sordi A, Cantaluppi V, Tetta C, Camussi G. Microvesicles derived from human adult mesenchymal stem cells protect against ischaemia–reperfusion-induced acute and chronic kidney injury. Nephrol Dial Transplant. 2011;26:1474–1483. doi: 10.1093/ndt/gfr015. [DOI] [PubMed] [Google Scholar]
- 26.Miguet L, Béchade G, Fornecker L, Zink E, Felden C, Gervais C, Herbrecht R, van Dorsselaer A, Mauvieux L, Sanglier-Cianferani S. Proteomic Analysis of Malignant B-Cell Derived Microparticles Reveals CD148 as a Potentially Useful Antigenic Biomarker for Mantle Cell Lymphoma Diagnosis. J Proteome Res. 2009;8:3346–3354. doi: 10.1021/pr801102c. [DOI] [PubMed] [Google Scholar]
- 27.Fleitas T, Martínez-Sales V, Vila V, Reganon E, Mesado D, Martín M, Gómez-Codina J, Montalar J, Reynés G. Circulating Endothelial Cells and Microparticles as Prognostic Markers in Advanced Non-Small Cell Lung Cancer. PLoS ONE. 2012;7:e47365. doi: 10.1371/journal.pone.0047365. [DOI] [PMC free article] [PubMed] [Google Scholar]
- 28.Baran J, Baj-Krzyworzeka M, Weglarczyk K, Szatanek R, Zembala M, Barbasz J, Czupryna A, Szczepanik A, Zembala M. Circulating tumour-derived microvesicles in plasma of gastric cancer patients. Cancer Immunol Immunother CII. 2010;59:841–850. doi: 10.1007/s00262-009-0808-2. [DOI] [PMC free article] [PubMed] [Google Scholar]
- 29.Angelillo-Scherrer A. Leukocyte-derived microparticles in vascular homeostasis. Circ Res. 2012;110:356–369. doi: 10.1161/CIRCRESAHA.110.233403. [DOI] [PubMed] [Google Scholar]
- 30.Grange C, Tapparo M, Collino F, Vitillo L, Damasco C, Deregibus MC, Tetta C, Bussolati B, Camussi G. Microvesicles Released from Human Renal Cancer Stem Cells Stimulate Angiogenesis and Formation of Lung Premetastatic Niche. Cancer Res. 2011;71:5346–5356. doi: 10.1158/0008-5472.CAN-11-0241. [DOI] [PubMed] [Google Scholar]
- 31.Momen-Heravi F, Balaj L, Alian S, Tigges J, Toxavidis V, Ericsson M, Distel RJ, Ivanov AR, Skog J, Kuo WP. Alternative Methods for Characterization of Extracellular Vesicles. Front Physiol. 2012;3 doi: 10.3389/fphys.2012.00354. [DOI] [PMC free article] [PubMed] [Google Scholar]
- 32.Graves LE, Ariztia EV, Navari JR, Matzel HJ, Stack MS, Fishman DA. Proinvasive Properties of Ovarian Cancer Ascites-Derived Membrane Vesicles. Cancer Res. 2004;64:7045–7049. doi: 10.1158/0008-5472.CAN-04-1800. [DOI] [PubMed] [Google Scholar]
- 33.Van Doormaal FF, Kleinjan A, Di Nisio M, Büller HR, Nieuwland R. Cell-derived microvesicles and cancer. Neth J Med. 2009;67:266–273. [PubMed] [Google Scholar]
- 34.Sinning J-M, Losch J, Walenta K, Böhm M, Nickenig G, Werner N. Circulating CD31+/Annexin V+ microparticles correlate with cardiovascular outcomes. Eur Heart J. 2011;32:2034–2041. doi: 10.1093/eurheartj/ehq478. [DOI] [PubMed] [Google Scholar]
- 35.Bruno S, Grange C, Collino F, Deregibus MC, Cantaluppi V, Biancone L, Tetta C, Camussi G. Microvesicles derived from mesenchymal stem cells enhance survival in a lethal model of acute kidney injury. PloS One. 2012;7:e33115. doi: 10.1371/journal.pone.0033115. [DOI] [PMC free article] [PubMed] [Google Scholar]
- 36.Bruno S, Collino F, Deregibus MC, Grange C, Tetta C, Camussi G. Microvesicles derived from human bone marrow mesenchymal stem cells inhibit tumor growth. Stem Cells Dev. 2013;22:758–771. doi: 10.1089/scd.2012.0304. [DOI] [PubMed] [Google Scholar]
- 37.Sun D, Zhuang X, Xiang X, Liu Y, Zhang S, Liu C, Barnes S, Grizzle W, Miller D, Zhang H-G. A Novel Nanoparticle Drug Delivery System: The Anti-inflammatory Activity of Curcumin Is Enhanced When Encapsulated in Exosomes. Mol Ther. 2010;18:1606–1614. doi: 10.1038/mt.2010.105. [DOI] [PMC free article] [PubMed] [Google Scholar]
- 38.EL Andaloussi S, Mäger I, Breakefield XO, Wood MJA. Extracellular vesicles: biology and emerging therapeutic opportunities. Nat Rev Drug Discov. 2013;12:347–357. doi: 10.1038/nrd3978. [DOI] [PubMed] [Google Scholar]
- 39.Tilley RE, Holscher T, Belani R, Nieva J, Mackman N. Tissue Factor Activity is Increased in a Combined Platelet and Microparticle Sample from Cancer Patients. Thromb Res. 2008;122:604–609. doi: 10.1016/j.thromres.2007.12.023. [DOI] [PMC free article] [PubMed] [Google Scholar]
- 40.Rood IM, Deegens JKJ, Merchant ML, Tamboer WPM, Wilkey DW, Wetzels JFM, Klein JB. Comparison of three methods for isolation of urinary microvesicles to identify biomarkers of nephrotic syndrome. Kidney Int. 2010;78:810–816. doi: 10.1038/ki.2010.262. [DOI] [PubMed] [Google Scholar]
- 41.Peramo P, et al. Physical Characterization of Mouse Deep Vein Thrombosis Derived Microparticles by Differential Filtration with Nanopore Filters. doi: 10.3390/membranes2010001. [DOI] [PMC free article] [PubMed] [Google Scholar]
- 42.Van der Pol E, Hoekstra AG, Sturk A, Otto C, van Leeuwen TG, Nieuwland R. Optical and non-optical methods for detection and characterization of microparticles and exosomes. J Thromb Haemost JTH. 2010;8:2596–2607. doi: 10.1111/j.1538-7836.2010.04074.x. [DOI] [PubMed] [Google Scholar]
- 43.Yuana Y, Bertina RM, Osanto S. Pre-analytical and analytical issues in the analysis of blood microparticles. Thromb Haemost. 2011;105:396–408. doi: 10.1160/TH10-09-0595. [DOI] [PubMed] [Google Scholar]
- 44.György B, Szabó TG, Pásztói M, Pál Z, Misják P, Aradi B, László V, Pállinger É, Pap E, Kittel Á, Nagy G, Falus A, Buzás EI. Membrane vesicles, current state-of-the-art: emerging role of extracellular vesicles. Cell Mol Life Sci. 2011;68:2667–2688. doi: 10.1007/s00018-011-0689-3. [DOI] [PMC free article] [PubMed] [Google Scholar]
- 45.Lawrie AS, Albanyan A, Cardigan RA, Mackie IJ, Harrison P. Microparticle sizing by dynamic light scattering in fresh-frozen plasma. Vox Sang. 2009;96:206–212. doi: 10.1111/j.1423-0410.2008.01151.x. [DOI] [PubMed] [Google Scholar]
- 46.Miguet L, Sanglier S, Schaeffer C, Potier N, Mauvieux L, Van Dorsselaer A. Microparticles: a new tool for plasma membrane sub-cellular proteomic. Subcell Biochem. 2007;43:21–34. doi: 10.1007/978-1-4020-5943-8_3. [DOI] [PubMed] [Google Scholar]
- 47.Smalley DM, Root KE, Cho H, Ross MM, Ley K. Proteomic discovery of 21 proteins expressed in human plasma-derived but not platelet-derived microparticles. Thromb Haemost. 2007;97:67–80. [PubMed] [Google Scholar]
- 48.Lacroix R, Robert S, Poncelet P, Dignat-George F. Overcoming Limitations of Microparticle Measurement by Flow Cytometry. Semin Thromb Hemost. 2010;36:807–818. doi: 10.1055/s-0030-1267034. [DOI] [PubMed] [Google Scholar]
- 49.Mobarrez F, Antovic J, Egberg N, Hansson M, Jörneskog G, Hultenby K, Wallén H. A multicolor flow cytometric assay for measurement of platelet-derived microparticles. Thromb Res. 2010;125:e110–116. doi: 10.1016/j.thromres.2009.10.006. [DOI] [PubMed] [Google Scholar]
- 50.Van der Pol E, van Gemert MJC, Sturk A, Nieuwland R, van Leeuwen TG. Single vs. swarm detection of microparticles and exosomes by flow cytometry. J Thromb Haemost JTH. 2012;10:919–930. doi: 10.1111/j.1538-7836.2012.04683.x. [DOI] [PubMed] [Google Scholar]
- 51.Hexley P, PK, TC, FG Protocol Standardization Reveals MV Correlation to Healthy Donor BMI. Exosomes Microvesicles. 2014:1. [Google Scholar]
- 52.Shet AS, Aras O, Gupta K, Hass MJ, Rausch DJ, Saba N, Koopmeiners L, Key NS, Hebbel RP. Sickle blood contains tissue factor–positive microparticles derived from endothelial cells and monocytes. Blood. 2003;102:2678–2683. doi: 10.1182/blood-2003-03-0693. [DOI] [PubMed] [Google Scholar]
- 53.Connor DE, Exner T, Ma DDF, Joseph JE. The majority of circulating platelet-derived microparticles fail to bind annexin V, lack phospholipid-dependent procoagulant activity and demonstrate greater expression of glycoprotein Ib. Thromb Haemost. 2010;103:1044–1052. doi: 10.1160/TH09-09-0644. [DOI] [PubMed] [Google Scholar]
- 54.Montoro-García S, Shantsila E, Orenes-Piñero E, Lozano ML, Lip GYH. An innovative flow cytometric approach for small-size platelet microparticles: influence of calcium. Thromb Haemost. 2012;108:373–383. doi: 10.1160/TH12-02-0120. [DOI] [PubMed] [Google Scholar]
- 55.György B, Módos K, Pállinger É, Pálóczi K, Pásztói M, Misják P, Deli MA, Sipos Á, Szalai A, Voszka I, Polgár A, Tóth K, Csete M, Nagy G, Gay S, Falus A, Kittel Á, Buzás EI. Detection and isolation of cell-derived microparticles are compromised by protein complexes resulting from shared biophysical parameters. Blood. 2011;117:e39–e48. doi: 10.1182/blood-2010-09-307595. [DOI] [PubMed] [Google Scholar]
- 56.György B, Szabó TG, Turiák L, Wright M, Herczeg P, Lédeczi Z, Kittel Á, Polgár A, Tóth K, Dérfalvi B, Zelenák G, Böröcz I, Carr B, Nagy G, Vékey K, Gay S, Falus A, Buzás EI. Improved Flow Cytometric Assessment Reveals Distinct Microvesicle (Cell-Derived Microparticle) Signatures in Joint Diseases. PLoS ONE. 2012;7:e49726. doi: 10.1371/journal.pone.0049726. [DOI] [PMC free article] [PubMed] [Google Scholar]
- 57.György B, Pasztoi M, Buzas EI. Response: systematic use of Triton lysis as a control for microvesicle labeling. Blood. 2012;119:2175–2176. [Google Scholar]
- 58.Trummer A, De Rop C, Tiede A, Ganser A, Eisert R. Isotype controls in phenotyping and quantification of microparticles: a major source of error and how to evade it. Thromb Res. 2008;122:691–700. doi: 10.1016/j.thromres.2008.01.005. [DOI] [PubMed] [Google Scholar]
- 59.Dey-Hazra E, Hertel B, Kirsch T, Woywodt A, Lovric S, Haller H, Haubitz M, Erdbruegger U. Detection of circulating microparticles by flow cytometry: influence of centrifugation, filtration of buffer, and freezing. Vasc Health Risk Manag. 2010;6:1125–1133. doi: 10.2147/VHRM.S13236. [DOI] [PMC free article] [PubMed] [Google Scholar]
- 60.Jayachandran M, Miller VM, Heit JA, Owen WG. Methodology for isolation, identification and characterization of microvesicles in peripheral blood. J Immunol Methods. 2012;375:207–214. doi: 10.1016/j.jim.2011.10.012. [DOI] [PMC free article] [PubMed] [Google Scholar]
- 61.Witwer KW, Buzas EI, Bemis LT, Bora A, Lasser C, Lotvall J, Nolte-’t Hoen EN, Piper MG, Sivaraman S, Skog J, Thery C, Wauben MH, Hochberg F. Standardization of sample collection, isolation and analysis methods in extracellular vesicle research. [Accessed March 11, 2014];J Extracell Vesicles. 2013 2 doi: 10.3402/jev.v2i0.20360. Available at: http://www.ncbi.nlm.nih.gov/pmc/articles/PMC3760646/ [DOI] [PMC free article] [PubMed] [Google Scholar]
- 62.Shah MD, Bergeron AL, Dong J-F, López JA. Flow cytometric measurement of microparticles: Pitfalls and protocol modifications. Platelets. 2008;19:365–372. doi: 10.1080/09537100802054107. [DOI] [PubMed] [Google Scholar]
- 63.Ayers L, Kohler M, Harrison P, Sargent I, Dragovic R, Schaap M, Nieuwland R, Brooks SA, Ferry B. Measurement of circulating cell-derived microparticles by flow cytometry: Sources of variability within the assay. Thromb Res. 2011;127:370–377. doi: 10.1016/j.thromres.2010.12.014. [DOI] [PubMed] [Google Scholar]
- 64.Lacroix R, Judicone C, Mooberry M, Boucekine M, Key NS, Dignat-George F The ISTH SSC Workshop. Standardization of pre-analytical variables in plasma microparticle determination: results of the International Society on Thrombosis and Haemostasis SSC Collaborative workshop. J Thromb Haemost JTH. 2013 doi: 10.1111/jth.12207. [DOI] [PMC free article] [PubMed] [Google Scholar]
- 65.Lacroix J, Hébert P, Fergusson D, Tinmouth A, Blajchman MA, Callum J, Cook D, Marshall JC, McIntyre L, Turgeon AF ABLE study group. The Age of Blood Evaluation (ABLE) randomized controlled trial: study design. Transfus Med Rev. 2011;25:197–205. doi: 10.1016/j.tmrv.2011.03.001. [DOI] [PubMed] [Google Scholar]
- 66.Shet AS. Characterizing blood microparticles: Technical aspects and challenges. Vasc Health Risk Manag. 2008;4:769–774. doi: 10.2147/vhrm.s955. [DOI] [PMC free article] [PubMed] [Google Scholar]
- 67.Orozco AF, Lewis DE. Flow cytometric analysis of circulating microparticles in plasma. Cytometry A. 2010;77A:502–514. doi: 10.1002/cyto.a.20886. [DOI] [PMC free article] [PubMed] [Google Scholar]
- 68.Danesh A, Inglis HC, Jackman RP, Wu S, Deng X, Muench MO, Heitman JW, Norris PJ. Exosomes from red blood cell units bind to monocytes and induce proinflammatory cytokines, boosting T-cell responses in vitro. Blood. 2014;123:687–696. doi: 10.1182/blood-2013-10-530469. [DOI] [PMC free article] [PubMed] [Google Scholar]
- 69.Aass HCD, Øvstebø R, Trøseid A-MS, Kierulf P, Berg JP, Henriksson CE. Fluorescent particles in the antibody solution result in false TF- and CD14-positive microparticles in flow cytometric analysis. Cytometry A. 2011;79A:990–999. doi: 10.1002/cyto.a.21147. [DOI] [PubMed] [Google Scholar]
- 70.Van der Vlist EJ, Nolte-’t Hoen ENM, Stoorvogel W, Arkesteijn GJA, Wauben MHM. Fluorescent labeling of nano-sized vesicles released by cells and subsequent quantitative and qualitative analysis by high-resolution flow cytometry. Nat Protoc. 2012;7:1311–1326. doi: 10.1038/nprot.2012.065. [DOI] [PubMed] [Google Scholar]
- 71.Amabile N, Renard JM, Caussin C, Boulanger CM. Circulating immune complexes do not affect microparticle flow cytometry analysis in acute coronary syndrome. Blood. 2012;119:2174–5. doi: 10.1182/blood-2011-11-393181. Available at: http://bloodjournal.hematologylibrary.org/content/119/9/2174.full. [DOI] [PubMed] [Google Scholar]
- 72.Gelderman MP, Simak J. Flow Cytometric Analysis of Cell Membrane Microparticles. In: Thompson JD, Ueffing M, Schaeffer-Reiss C, editors. Funct Proteomics. Vol. 484. Totowa, NJ: Humana Press; 2008. [Accessed August 22, 2013]. pp. 79–93. Available at: http://www.springerprotocols.com/Abstract/doi/10.1007/978-1-59745-398-1_6. [DOI] [PubMed] [Google Scholar]
Associated Data
This section collects any data citations, data availability statements, or supplementary materials included in this article.