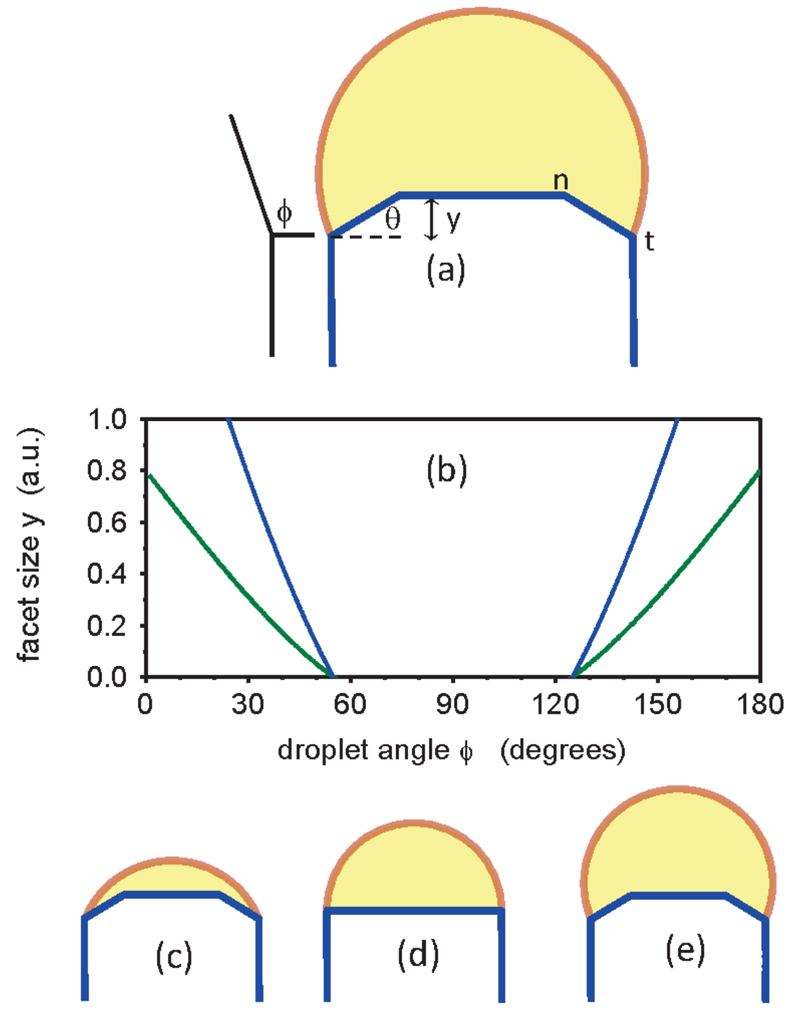
Figure 4.
Model relating droplet size to interface morphology. (a) Schematic diagram of a “quasi-2D” ideal, symmetrical nanowire to illustrate the droplet angle ϕ and edge facet angle θ and length (in growth direction) y. n marks the interior point where ZB nucleates. t marks the trijunction. (b) y vs. ϕ, calculated for two different values of supersaturation for the symmetrical situation. There is a range of ϕ in which y=0, i.e. c1 changes sign and the edge facet goes out of existence. Note that supersaturation (low=blue, high=green) does not affect this range. (c-e) Schematic diagrams of the nanowire and droplet for ϕ>90°, ϕ=90°, and ϕ<90°. The possibility of depinning of the droplet from point t is not included in the model.

